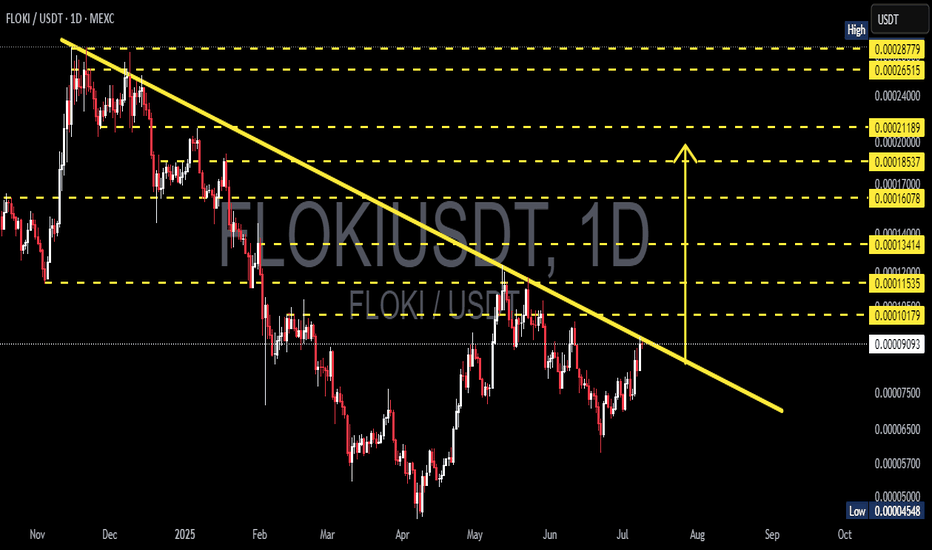
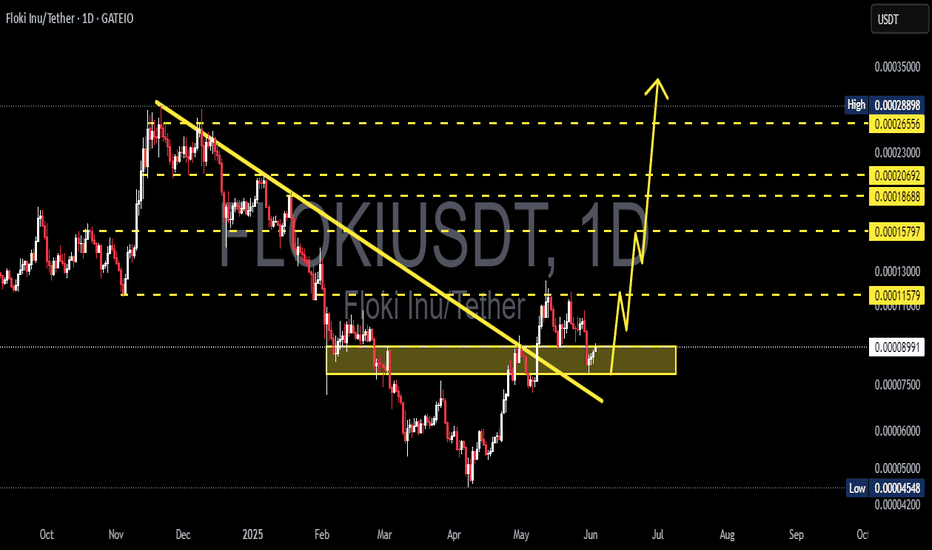
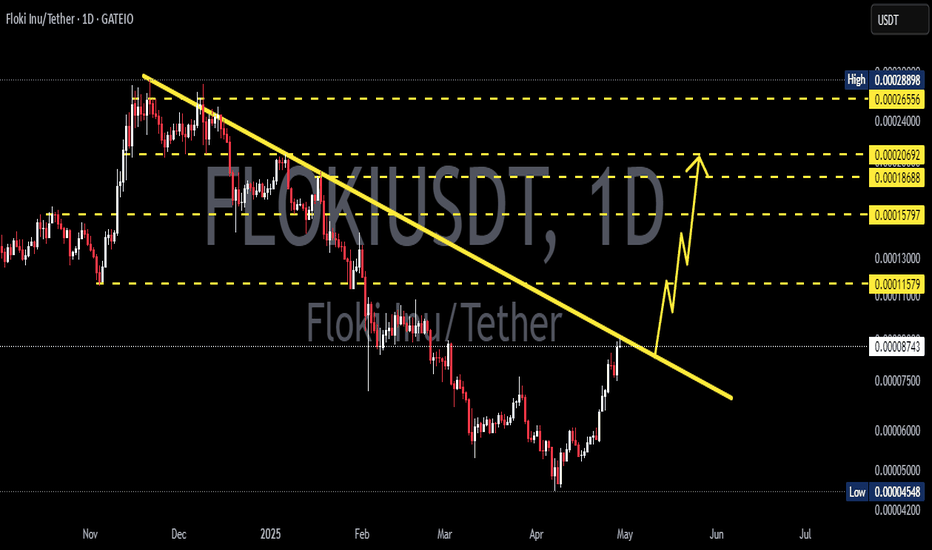
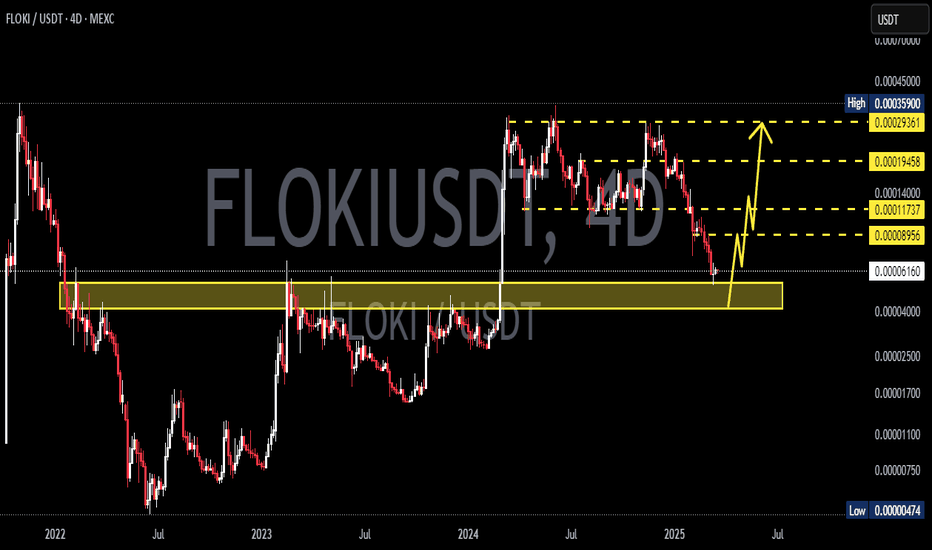
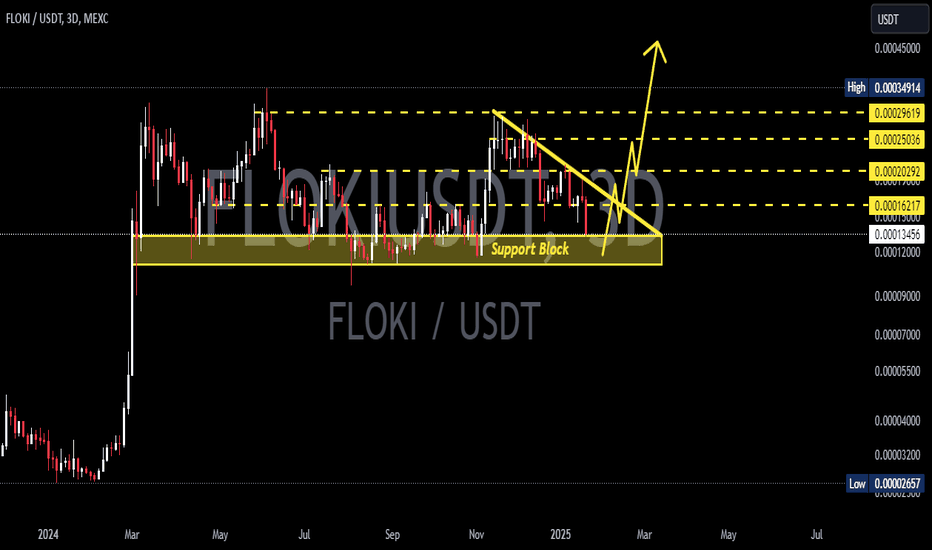
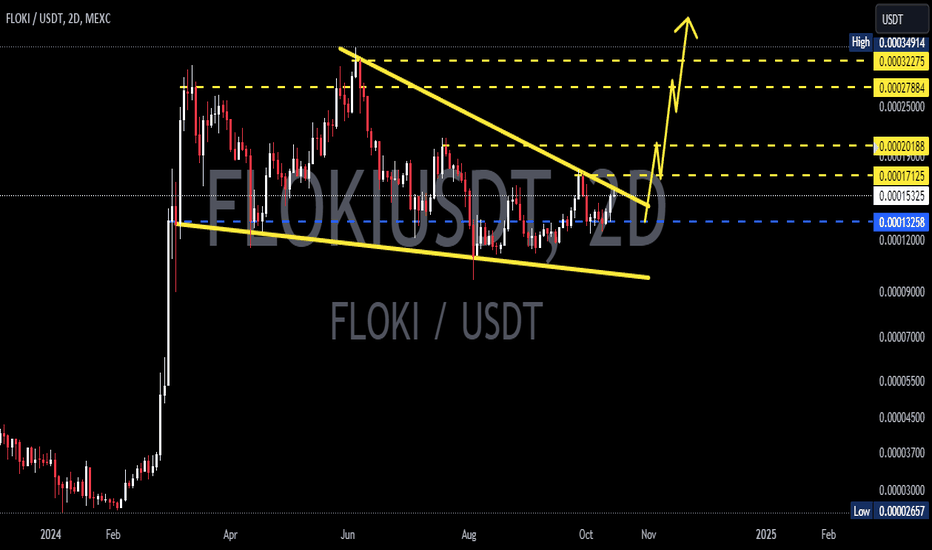
FLOKI/USDT — Major Breakout Incoming? The Calm Before a BullishThe daily chart of FLOKI/USDT reveals a highly compelling technical setup. After a prolonged downtrend that started in late 2024, FLOKI is now testing a key descending trendline — signaling a potential trend reversal and the beginning of a new bullish phase if a breakout is confirmed.
📊 Detailed Technical Analysis:
🔍 Pattern Formation:
Descending Trendline Resistance: Acting as a dynamic resistance since the November 2024 high, capping every major rally attempt.
Consistent Higher Lows: Since March 2025, FLOKI has been forming a series of higher lows — an early bullish sign of accumulation.
Volatility Squeeze: Recent candles are consolidating near the apex of the triangle, suggesting a breakout move is imminent.
Bullish Structure Forming: A successful breakout would complete a bullish reversal pattern on the daily chart.
🟢 Bullish Scenario (Breakout Confirmation):
If the price closes above 0.0001079 on the daily timeframe and confirms a clean breakout above the descending trendline, we can anticipate an extended move to the upside.
🎯 Key upside targets based on historical resistance zones:
1. Target 1: 0.00011535 → Previous minor resistance
2. Target 2: 0.00013414 → March 2025 supply zone
3. Target 3: 0.00016078 → Strong horizontal resistance
4. Target 4: 0.00020000 → Major psychological level
5. Target 5: 0.00028779 → Previous swing high (November 2024)
💥 A full breakout move to the top could offer over 200% potential upside, making it a high-reward setup for well-managed long entries.
🔴 Bearish Scenario (Rejection):
If FLOKI fails to break above the descending trendline:
⚠️ We could see a retracement to lower support levels:
Minor Support: 0.00007500
Key Support: 0.00005700
Last Defense: 0.00004548 → Previous cycle low
A breakdown below these support levels would invalidate the bullish setup and shift momentum back in favor of the bears.
🧠 Pro Tips:
Watch for Volume Confirmation during the breakout — high volume adds credibility.
Focus on Body Closes, not just wicks, when identifying valid breakouts.
Manage Risk Wisely — a stop loss just below the trendline offers solid risk-to-reward.
📅 Conclusion:
FLOKI/USDT is at a critical technical juncture. A confirmed breakout above the descending trendline could spark a strong bullish trend, while a rejection may lead to deeper correction or consolidation.
💡 The next few candles will likely determine the medium-term direction for FLOKI.
#FLOKI #FLOKIUSDT #AltcoinBreakout #CryptoSetup #TechnicalAnalysis #BullishCrypto #BreakoutTrade #TrendReversal #CryptoSignals
Flokiusdsignals
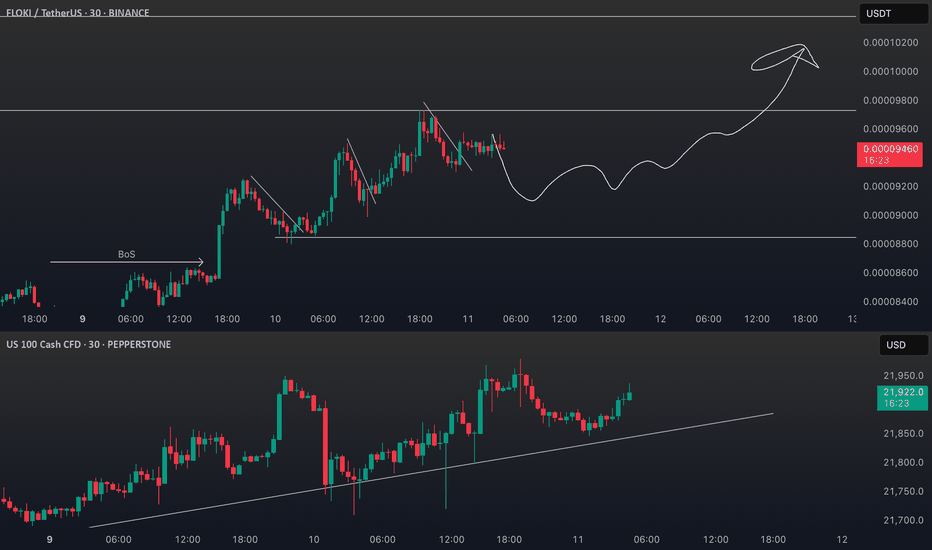
FLOKI Technical Outlook: Trend, Patterns, and Trade PlanFloki (FLOKI) continues to demonstrate robust bullish momentum on the higher timeframes, with price action respecting the prevailing uptrend 📈. After continued retracements and expansion, the structure remains constructive, and my directional bias is firmly bullish.
While the emergence of a three-drive pattern warrants some caution ⚠️, the overall trend suggests that any corrective move could present a high-probability long opportunity. Wait for a retrace to key support zones before considering entries. My targets are set at previous swing highs visible on the 4H chart, with stops placed just below the most recent low for prudent risk management.
As always, this is not financial advice—trade safe and stick to your plan! 🚀
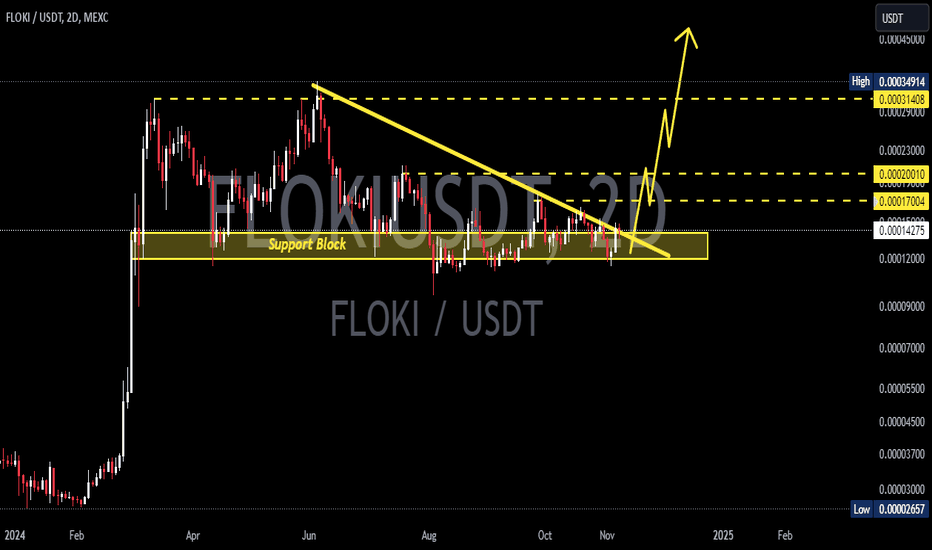
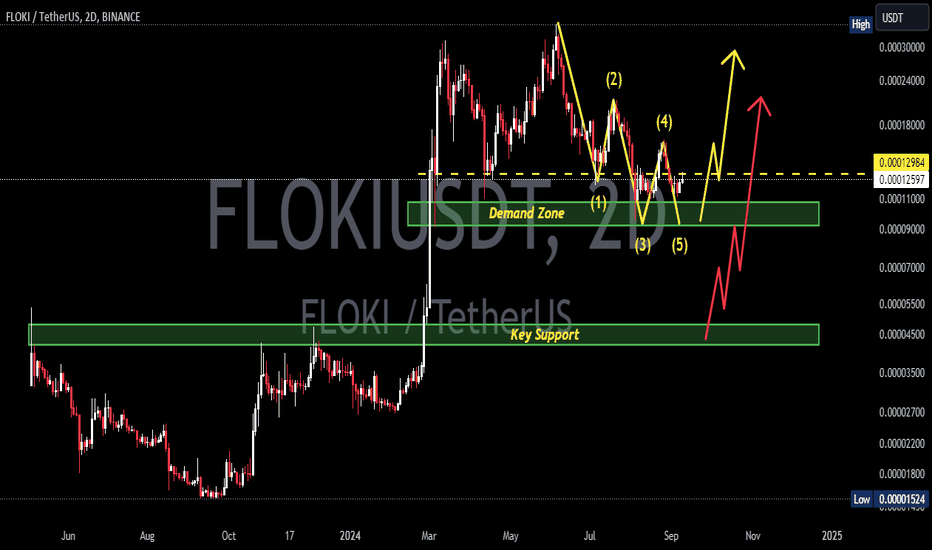
FLOKIUSDTFLOKI ~ 2D ✅
#FLOKI We hope that this Demand Zone will be retested to attract buyers. This scenario would be possible Dobble Bottom-up.
However, if this Demand Zone is not strong enough to withstand selling pressure and buyers lose momentum, it will be very clear that the price will fall at the key support that we expect.
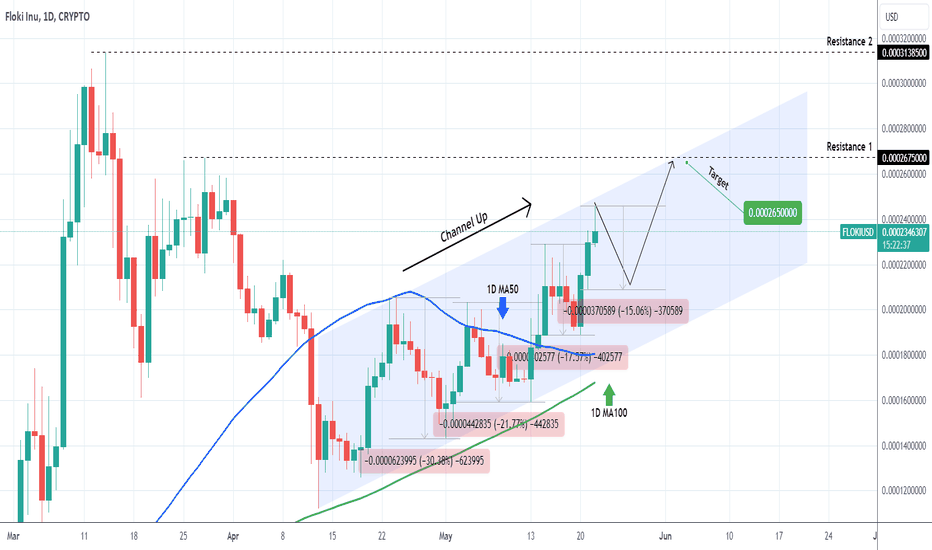
FLOKIUSD Wait for this pull-back and buy.Floki Inu (FLOKIUSD) hit the top (Higher Highs trend-line) of the 1-month Channel Up that started on the April 13 Low. Based on the price action that followed, we should now see a pull-back of at least -15% before the new Bullish Leg begins.
We expect that to go for a test of Resistance 1 before the Channel Up breaks parabolically upwards into the new Alt Season. As a result we will go for a short-term buy at -15% and target 0.0002650 (just below Resistance 1).
-------------------------------------------------------------------------------
** Please LIKE 👍, FOLLOW ✅, SHARE 🙌 and COMMENT ✍ if you enjoy this idea! Also share your ideas and charts in the comments section below! This is best way to keep it relevant, support us, keep the content here free and allow the idea to reach as many people as possible. **
-------------------------------------------------------------------------------
💸💸💸💸💸💸
👇 👇 👇 👇 👇 👇
FLOKI / FLOKIUSDTLet's see
Good Luck >>
• Warning •
Any deal I share does not mean that I am forcing you to enter into it, you enter in with your full risk, because I'll not gain any profits with you in the end.
The risk management of the position must comply with the stop loss.
(I am not sharing financial or investment advice, you should do your own research for your money.)
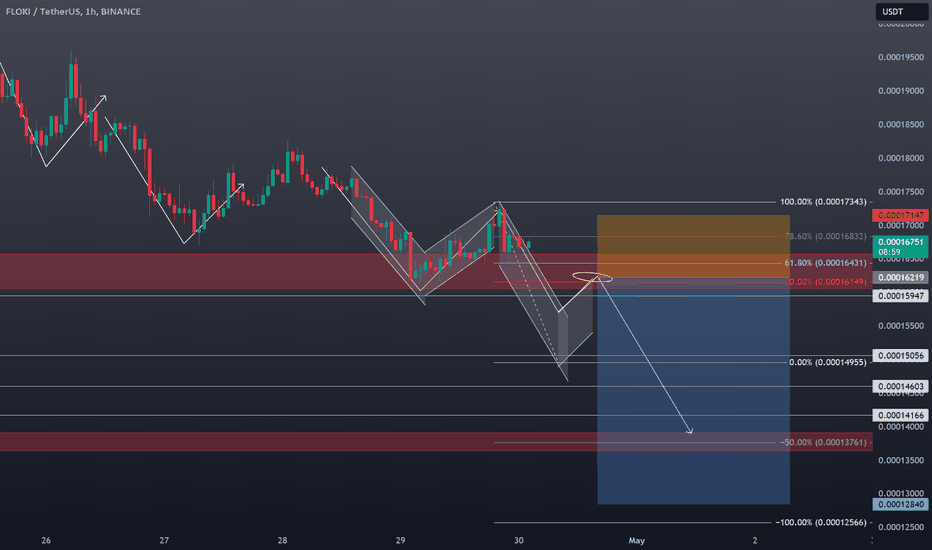
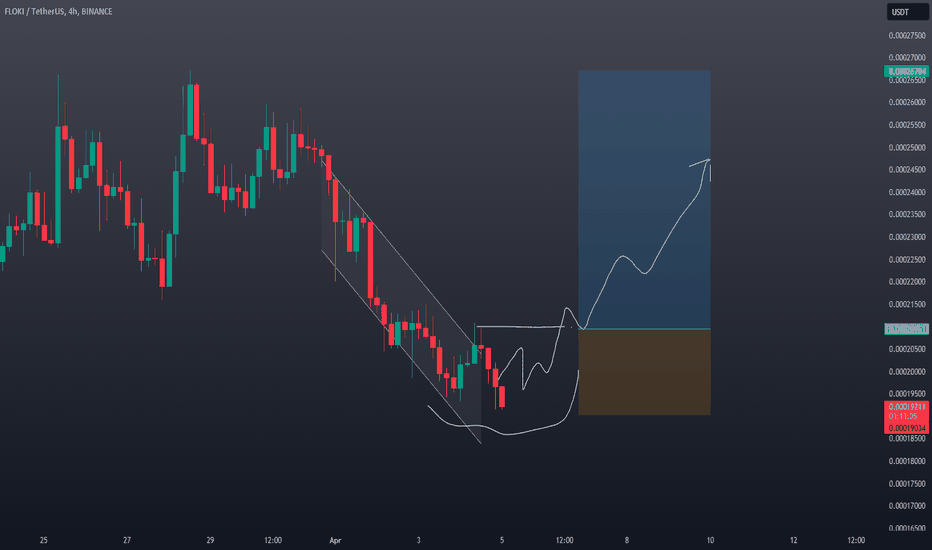
FLOKI Technical Analysis and Trade IdeaRecently, FLOKI has experienced downward pressure. A bearish pattern is evident on the 4-hour chart. At present, there’s a pullback into a major resistance zone with a minor bounce off, and we’re on the lookout for another expansion and pullback to consider a short position if the price action turns out to be favorable. The video discusses the prevailing trend, recent price movements, overall market structure, and presents several trading ideas for your consideration.
Please remember, the content provided is solely for educational purposes and should not be taken as investment advice. Trading involves significant risk, highlighting the importance of consistently applying strong risk management strategies.
FLOKI Technical Analysis and Trade Idea
In this video, we delve into a prospective trading opportunity. Our analysis encompasses examining the prevailing trend, scrutinizing price movements, appraising market dynamics, and pinpointing a possible entry point under favourable circumstances, as elucidated in the video. It is crucial to incorporate sound risk management principles into your trading approach. As always, it is imperative to emphasize that this content is intended solely for educational purposes and should not be construed as financial advice.
FLOKIUSD Massive buy initiated, ATH test at least.Floki Inu (FLOKIUSD) is posting a massive 3 week bullish sequence that the crypto hasn't seen since January. This time it is on a 1W MACD Bullish Cross that is still below the 0.0 neutral mark, meaning that the upside potential is significant.
We expect a pull-back towards the 1D MA50 (red trend-line), but as long as it holds, it should spur the second wave of aggressive buying towards at least the 0.0000685 All Time High (ATH). The upside of this asset as a high risk investment is very high in our opinion.
-------------------------------------------------------------------------------
** Please LIKE 👍, FOLLOW ✅, SHARE 🙌 and COMMENT ✍ if you enjoy this idea! Also share your ideas and charts in the comments section below! This is best way to keep it relevant, support us, keep the content here free and allow the idea to reach as many people as possible. **
-------------------------------------------------------------------------------
💸💸💸💸💸💸
👇 👇 👇 👇 👇 👇
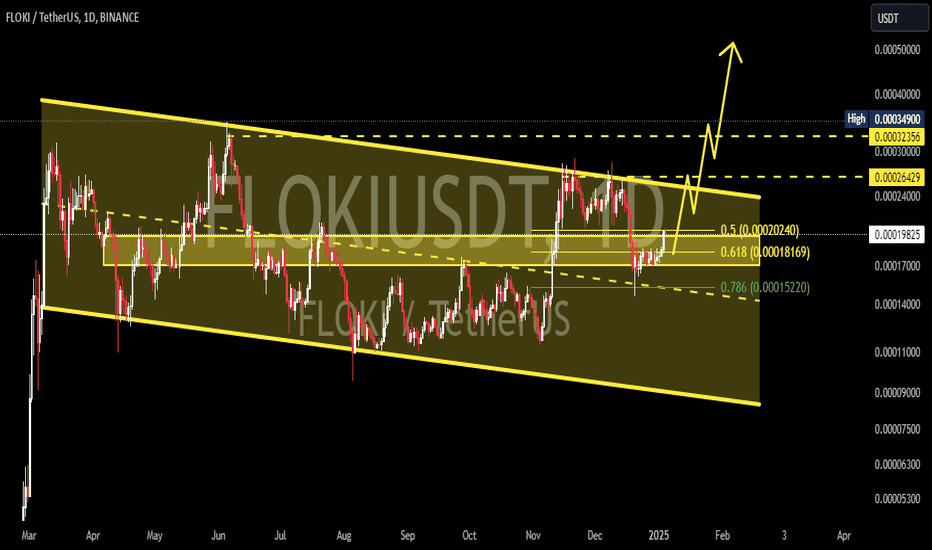
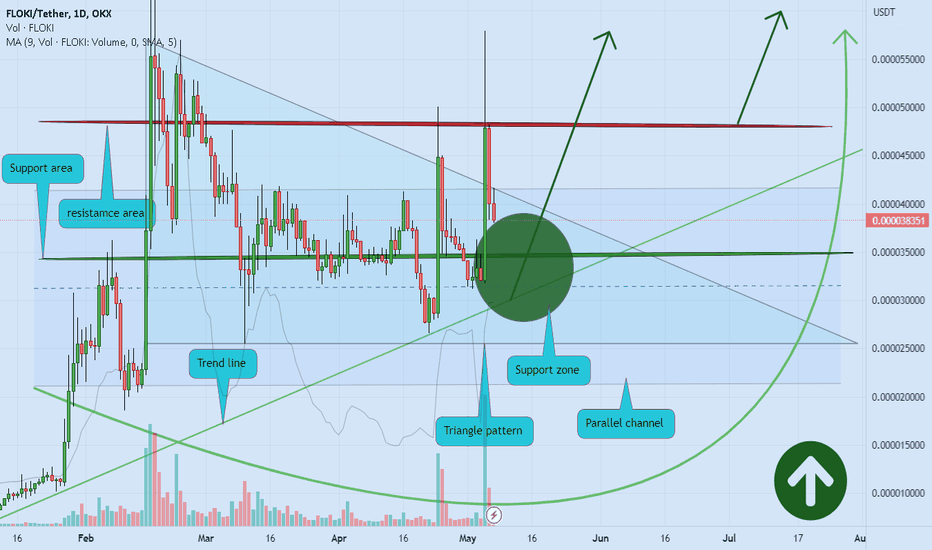
FLOKIUSDT retest of the triangle pattern and more gain 📖💡🚀Hello 🐋
Based on the chart, the price is in the parallel channel close to the triangle support (previous triangle resistance area) and new volume recognize for the price, and it is close to the Fibonacci support level ✔️
if
the price doesn't break the support zone to the downside, we will see more gain, at least to our upper trend line 💣🚀
otherwise
we can see more correction to lower support level ❌🧨
if
breakout of the upper resistance zone be completed, we can see more pump to the upside ✔️🚀
Please, feel free to share your point of view, write it in the comments below, thanks 🐋
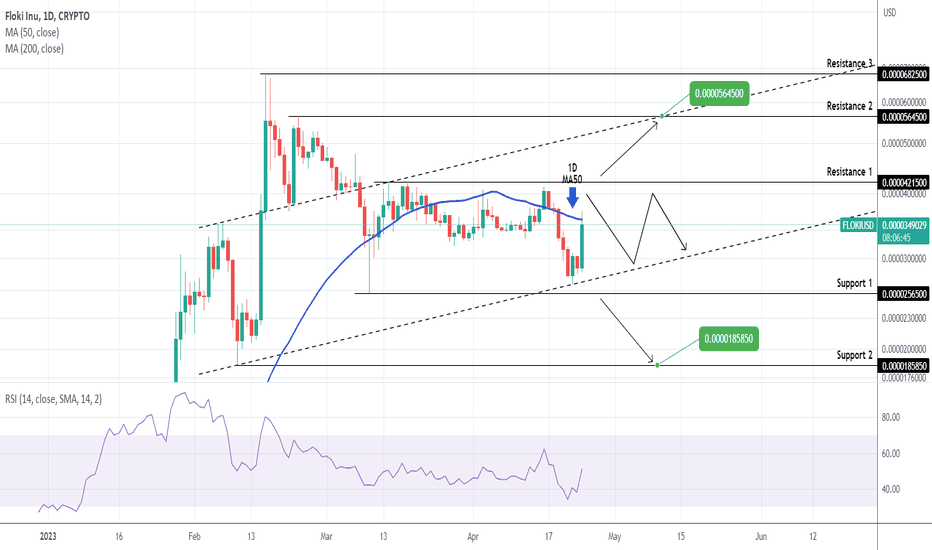
FLOKIUSD Resistance and Support strategy only.Floki Inu (FLOKIUSD) is having the strongest 1D rise since February 22, hitting again the 1D MA50 (blue trend-line). This doesn't alter the neutral sentiment within Resistance 1 and Support 2. We are only buying above Resistance 1, targeting Resistance 2 (0.00005645) on what can be the Higher High of an emerging Channel Up pattern or sell below Support 1, targeting Support 2 (0.0000185850).
-------------------------------------------------------------------------------
** Please LIKE 👍, FOLLOW ✅, SHARE 🙌 and COMMENT ✍ if you enjoy this idea! Also share your ideas and charts in the comments section below! **
-------------------------------------------------------------------------------
💸💸💸💸💸💸
👇 👇 👇 👇 👇 👇
