FLOW, FIL, GRTHello?
Traders, welcome.
If you "Follow", you can always get new information quickly.
Please also click "Boost".
Have a good day.
-------------------------------------
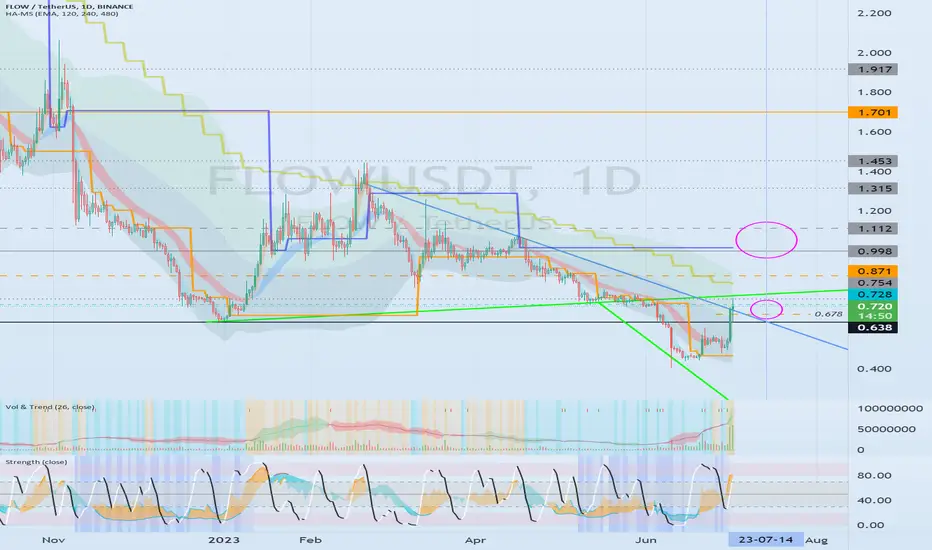
(FLOWUSDT chart)
The HA-Low indicator on the 1W chart is about to form at the 0.678 point.
Therefore, when it is created at the 0.678 point, it is necessary to check whether it is supported around 0.638-0.754.
If supported, you can buy.
If you bought
1st: 0.871
2nd: 0.998-1.112
3rd: 1.315
Split selling is possible when resistance is received around the 1st - 3rd above.
Since the HA-Low indicator on the 1M chart is formed at the 1.701 point, a full-fledged uptrend is expected to begin when the price rises above the HA-Low indicator on the 1M chart.
(FLOWKRW chart)
The key is whether you can rise with support around 917-1015.
when it rises,
1st : 1160
2nd: 1315-1490.0
Split selling is possible when resistance is received near the 1st and 2nd above.
However, since the HA_Low indicator on the 1M chart is formed at the 2355 point, it is expected that the full-fledged uptrend will begin only when it rises above the HA-Low indicator on the 1M chart.
-------------------------------------------------- ----
(FILUSDT chart)
Looking at the 1M chart,
Support and resistance points are formed at 5.686.
Therefore, it is expected that the full-fledged uptrend will begin only when it rises above 5.686.
Looking at the 1D chart,
The HA-Low indicator on the 1D and 1W charts is close up.
And, you can see that the HA-High indicator on the 1D chart is also close.
So, if possible, I would recommend waiting for support around 4.404-4.698.
If you confirmed the support and bought it,
1st: 5.130-5.686
2nd: 7.230
Split selling is possible when resistance is received near the 1st and 2nd above.
-------------------------------------------------- ----------------
(GRTUSDT chart)
Looking at the 1M chart,
It is expected that the full-fledged uptrend will begin only when it rises above the 0.1636 point.
Looking at the 1D chart,
It gained support around 0.0974-0.1047 and rose.
thus,
1st: 0.1292-0.1355
2nd: 0.1606-0.1636
Split selling is possible when resistance is received near the 1st and 2nd above.
It is expected that the actual uptrend will begin only when it rises above the 0.1997 point formed on the 1W chart.
(GRTKRW chart)
The role of support and resistance is weak since the chart was created not long ago, so please refer to it.
It is expected that the upward trend will start only when it rises above 172, which is the volume profile section formed on the 12h chart.
If it declines, you should check for support around 130-136.
-------------------------------------------------- -------------------------------------------
** All descriptions are for reference only and do not guarantee profit or loss in investment.
** Even if you know other people's know-how, it takes a considerable period of time to make it your own.
** This is a chart created with my know-how.
---------------------------------
FLOWKRW
Flow (FLOW) - July 21Hello?
Welcome, traders.
By "following", you can always get new information quickly.
Please also click "Like".
Have a good day.
-------------------------------------
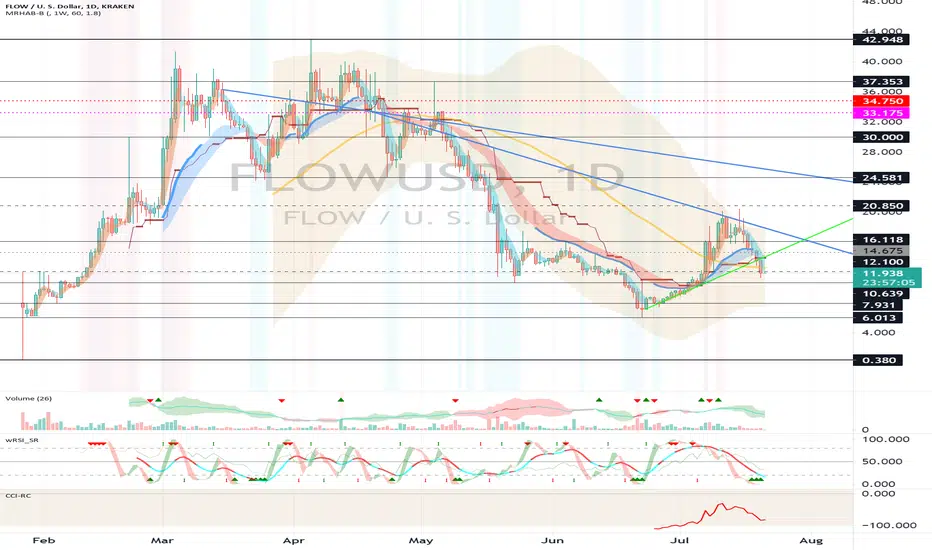
(FLOWUSD 1W Chart)
(1D chart)
If the price is maintained in the 10.639-16.118 range, it is expected that the uptrend will continue.
However, it is important to break out of the downtrend line.
-------------------------------------
(FLOWBTC 1W chart)
(1D chart)
If the price is maintained above the 41701 Satoshi-44875 Satoshi section, it is expected that the uptrend will continue.
If it goes down, we should see support from the 31098 Satoshi-34627 Satoshi section and see if it can rise.
------------------------------------------
We recommend that you trade with your average unit price.
This is because, if the price is below your average unit price, whether it is in an uptrend or in a downtrend, there is a high possibility that you will not be able to get a big profit due to psychological burden.
The center of all trading starts with the average unit price at which you start trading.
If you ignore this, you may be trading in the wrong direction.
Therefore, it is important to find a way to lower the average unit price and adjust the proportion of the investment, ultimately allowing the funds corresponding to the profits to regenerate themselves.
------------------------------------------------------------ -----------------------------------------------------
** All indicators are lagging indicators.
Therefore, it is important to be aware that the indicator moves accordingly with the movement of price and volume.
However, for the sake of convenience, we are talking in reverse for the interpretation of the indicator.
** The wRSI_SR indicator is an indicator created by adding settings and options to the existing Stochastic RSI indicator.
Therefore, the interpretation is the same as the traditional Stochastic RSI indicator. (K, D line -> R, S line)
** The OBV indicator was re-created by applying a formula to the DepthHouse Trading indicator, an indicator disclosed by oh92. (Thanks for this.)
** See support, resistance, and abbreviation points.
** Support or resistance is based on the closing price of the 1D chart.
** All descriptions are for reference only and do not guarantee a profit or loss in investment.
Explanation of abbreviations displayed in the chart
R: A point or section of resistance that requires a response to preserve profits.
S-L: Stop Loss point or section
S: A point or section where you can buy to make a profit as a support point or section
(Short-term Stop Loss can be said to be a point where profit and loss can be preserved or additional entry can be made through split trading. It is a short-term investment perspective.)
GAP refers to the difference in prices that occurred when the stock market, CME, and BAKKT exchanges were closed because they are not traded 24 hours a day.
G1 : Closing price when closed
G2: Opening price
(Example) Gap (G1-G2)