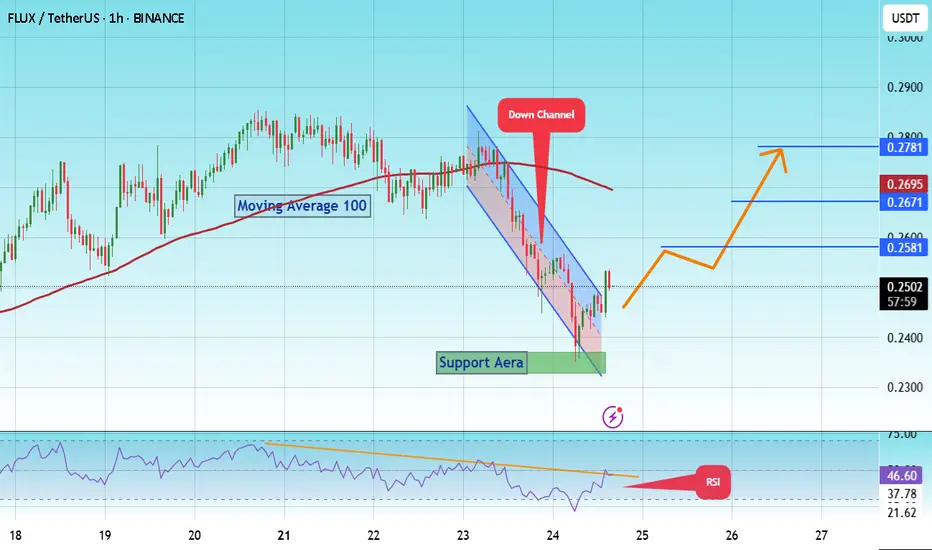
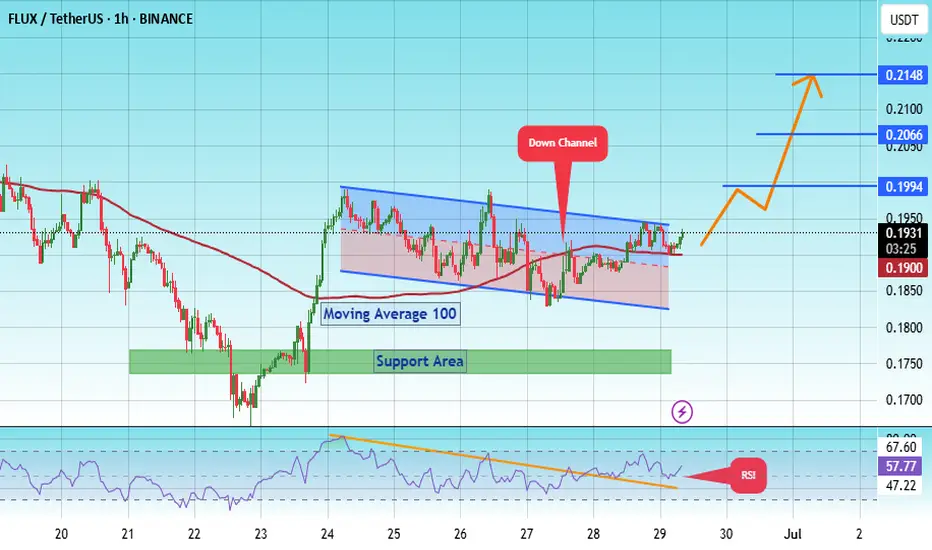
#FLUX/USDT Forming Bullish Falling Wedge#FLUX
The price is moving within a descending channel on the 1-hour frame and is expected to break and continue upward.
We have a trend to stabilize above the 100 moving average once again.
We have a downtrend on the RSI indicator that supports the upward break.
We have a support area at the lower boundary of the channel at 0.2370, acting as strong support from which the price can rebound.
We have a major support area in green that pushed the price upward at 0.2340.
Entry price: 0.2495
First target: 0.2580
Second target: 0.2670
Third target: 0.2780
To manage risk, don't forget stop loss and capital management.
When you reach the first target, save some profits and then change the stop order to an entry order.
For inquiries, please comment.
Thank you.
FLUXUSDT
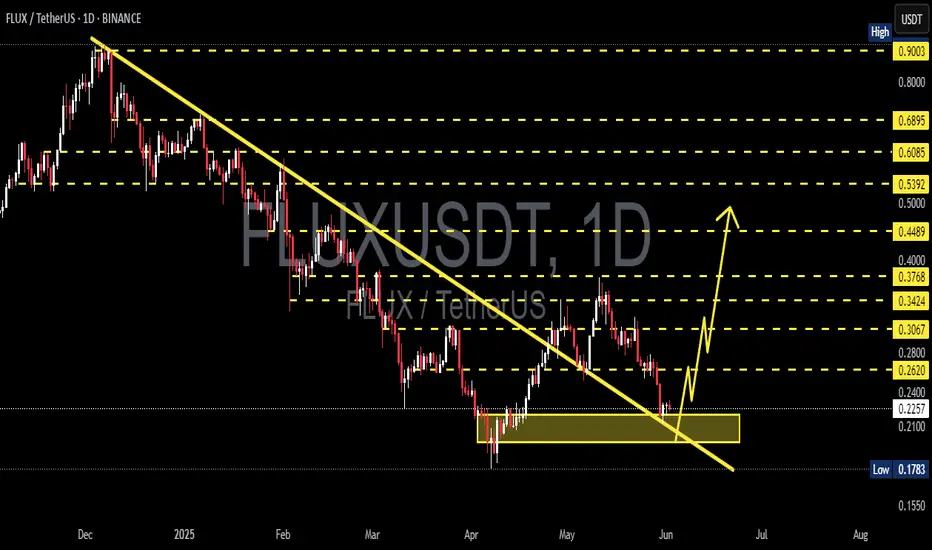
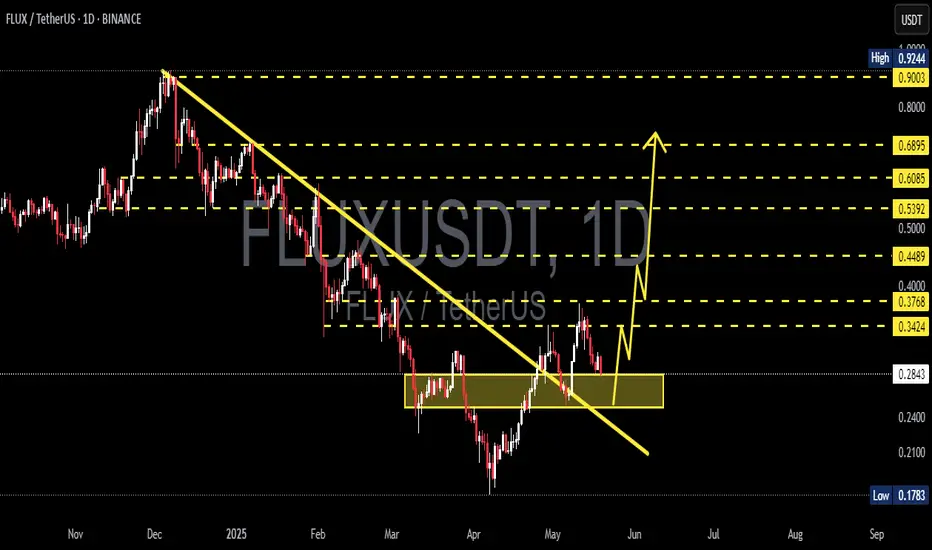
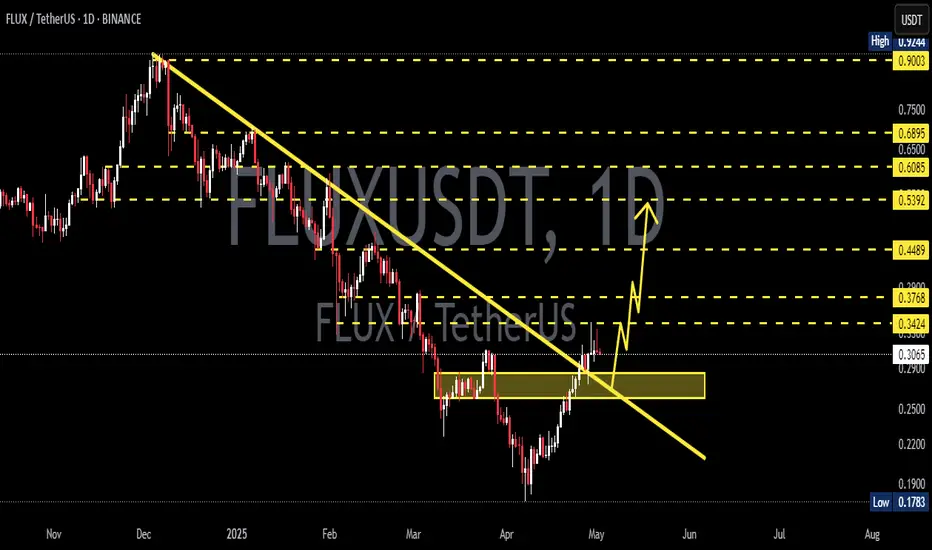
FLUX/USDT – Major Trendline Breakout!
📊 Technical Analysis Overview (Daily Timeframe)
After months of persistent downtrend pressure since late 2024, FLUX/USDT has finally flashed a high-probability bullish reversal signal. The recent breakout above a long-standing descending trendline may mark the beginning of a new bullish structure that could fuel an explosive upside move.
🔍 Market Structure & Technical Pattern
✅ Descending Trendline Breakout:
FLUX has successfully broken out of the dominant bearish trendline that has acted as resistance since December 2024. This breakout is an early sign of a trend reversal, shifting momentum in favor of the bulls.
✅ Demand Zone Reclaim (0.22 – 0.26 USDT):
This critical horizontal range has served as both support and resistance in recent months. Price has now reclaimed this zone with strength, indicating renewed buying pressure and a possible shift into accumulation or markup phase.
✅ Bullish Breakout Candle:
A strong bullish candle has closed above both the descending trendline and the demand zone, confirming breakout strength and increasing the odds of bullish continuation.
✅ Potential Bullish Continuation Setup:
If the price holds above 0.26 and prints a higher low, this will likely confirm a bullish structure and support a continuation move toward key resistance levels.
📈 Bullish Scenario – Potential Upside Targets
Should bullish momentum sustain, here are the major resistance levels to watch:
1. 0.3085 USDT – Immediate resistance zone.
2. 0.3522 USDT – Historical horizontal resistance.
3. 0.4535 – 0.5336 USDT – Consolidation range from Q1 2025.
4. 0.6870 USDT – Psychological level and potential Fibonacci confluence.
5. 0.7646 – 0.8959 USDT – Long-term bullish target, up to +200% from current levels.
📌 Note: A breakout supported by strong volume will add greater confirmation to the bullish thesis.
📉 Bearish Scenario – Watch Out for a Fakeout
Although the breakout looks promising, risks remain:
If the price fails to hold above 0.26, it may result in a false breakout.
A break below 0.24 could push price back into the 0.20 – 0.22 USDT zone.
If selling intensifies, FLUX may retest the 0.1653 USDT low.
⚠️ Always manage risk. A re-entry below the broken support would invalidate the breakout setup.
📌 Summary Strategy:
✅ Confirmed breakout from multi-month downtrend structure.
🟨 Demand zone has flipped into support.
📈 Multiple upside targets with strong reward-to-risk potential.
⚠️ Watch for confirmation via volume and price retest behavior.
#FLUXUSDT #CryptoBreakout #AltcoinAnalysis #FLUX #TechnicalAnalysis #TrendReversal #CryptoTrading #TradingViewTA #PriceAction #CryptoBulls

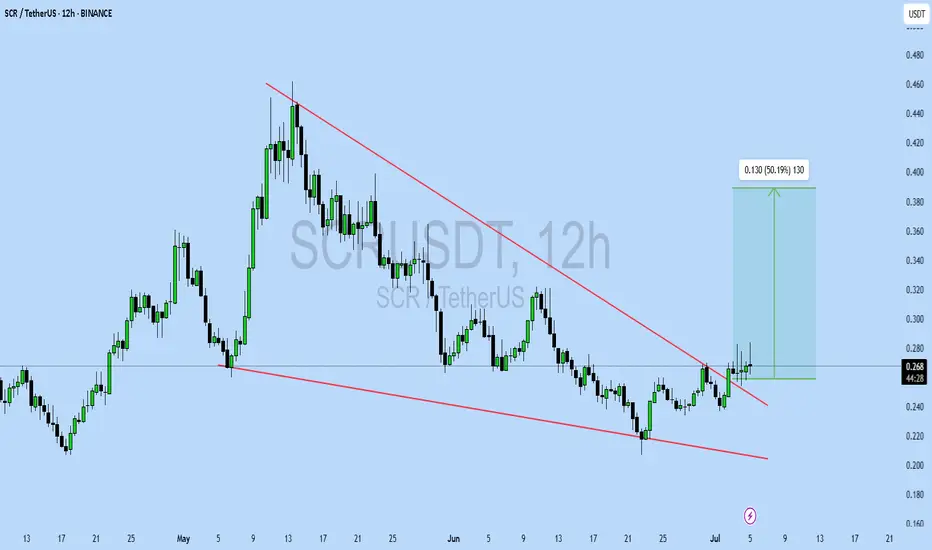
SCRUSDT UPDATE
Pattern: Falling Wedge Breakout
Current Price: \$0.268
Target Price: \$0.398
Target % Gain: 50.1%
Technical Analysis: SCR has broken out of a falling wedge pattern on the 12H chart with a clean close above resistance. The breakout is backed by bullish candles and increasing volume, suggesting a potential 50% move upward.
Time Frame: 12H
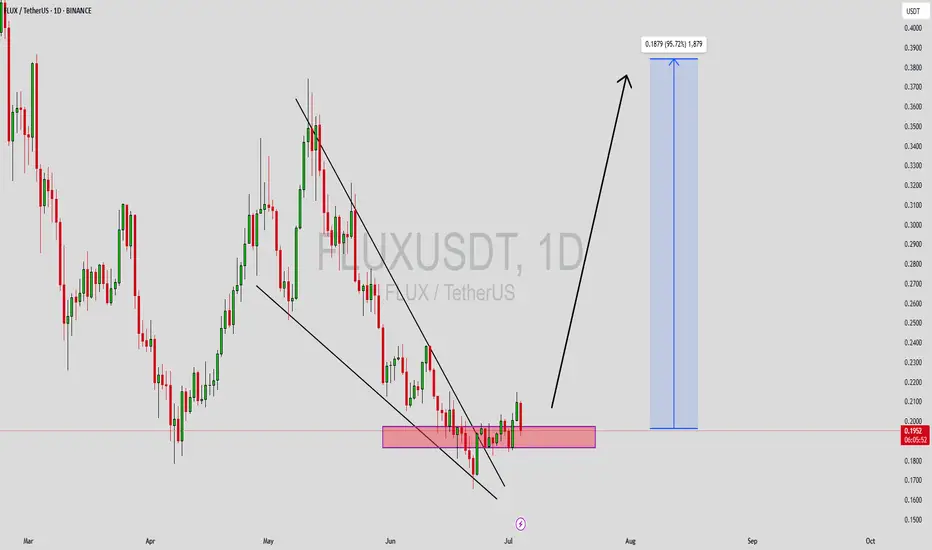
FLUXUSDT Forming Bullish Falling WedgeFLUXUSDT is showing promising technical signals for a potential bullish reversal after a sustained period of downward movement. The chart indicates that the price has been consolidating within a falling wedge pattern and has now broken out of that range with increasing volume — a classic sign that momentum could be shifting in favor of the bulls. With an expected gain projection of 80% to 90%+, traders are eyeing this setup for possible high-reward opportunities in the short to medium term.
The FLUX project continues to gain interest among investors due to its innovative approach to decentralized cloud infrastructure. This growing ecosystem, which supports Web3 applications and scalable decentralized computing, has captured the attention of developers and blockchain enthusiasts alike. Positive sentiment around new partnerships and development updates may add fuel to this technical breakout.
Market depth and recent trading activity suggest that strong support has been established around the recent accumulation zone, highlighted by the red box on the chart. If FLUXUSDT can hold above this level and sustain its breakout, the next resistance levels could act as stepping stones towards the projected target range. As always, monitoring volume and overall market sentiment will be crucial to confirm the breakout's strength.
✅ Show your support by hitting the like button and
✅ Leaving a comment below! (What is You opinion about this Coin)
Your feedback and engagement keep me inspired to share more insightful market analysis with you!
#FLUX breakout confirmed.#FLUX
The price is moving within a descending channel on the 1-hour frame, adhering well to it, and is heading for a strong breakout and retest.
We have a bounce from the lower boundary of the descending channel. This support is at 0.1840.
We have a downtrend on the RSI indicator that is about to be broken and retested, supporting the upside.
There is a major support area in green at 0.1750, which represents a strong basis for the upside.
Don't forget a simple thing: ease and capital.
When you reach the first target, save some money and then change your stop-loss order to an entry order.
For inquiries, please leave a comment.
We have a trend of consolidation above the 100 Moving Average.
Entry price: 0.1930.
First target: 0.1994.
Second target: 0.2066.
Third target: 0.2150.
Don't forget a simple thing: ease and capital.
When you reach the first target, save some money and then change your stop-loss order to an entry order.
For inquiries, please leave a comment.
Thank you.
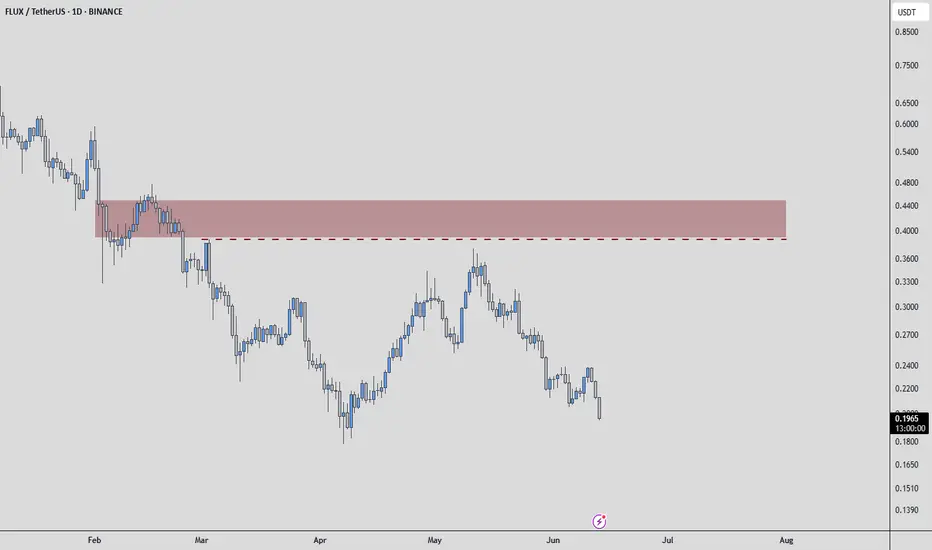
FLUXUSDT: Patience for the Confirmed ShortFor FLUXUSDT, the prevailing market sentiment is undoubtedly bearish. While the general atmosphere leans towards further downside, the discerning investor understands the importance of strategic patience. My analysis indicates that to engage in a short position prudently, it is beneficial to await price interaction with the red box.
This is not a market to rush. The general consensus points to selling, but a disciplined approach demands specific confirmation at a predetermined level. That red box on your chart is the critical area I'm observing for a high-probability short entry.
Here’s why, and your plan for action:
Waiting for the Trigger: My intention is to initiate a short only after price has engaged with this red zone. This ensures that any move is not premature but grounded in market reaction to a key resistance area.
Confirm the Downside: Your decisive move comes with precise confirmation. This means:
Volume Footprint: I'll be meticulously scrutinizing the volume footprint as price touches the red box, seeking clear signs of renewed seller strength and distribution.
CDV (Cumulative Delta Volume): Look for CDV to turn definitively negative or show a deepening bearish divergence. This affirms that sellers are regaining undeniable control.
LTF Breakdowns: On the low timeframes (LTF), demand concrete breakdowns. Price must fail to hold, retest the red box as new resistance, and then continue lower with conviction. This is your undeniable signal.
My overall bias for FLUXUSDT remains bearish. I only trade assets showing a sudden and significant increase in volume, and while this is a short setup, the volume dynamics confirming weakness at a key resistance are what I seek.
Keep a sharp eye on that red box. If these confirmations align, you'll uncover a precise, high-probability short entry. This is where smart, confirmed decisions are made, avoiding the impulsivity that often plagues less disciplined traders.
📌I keep my charts clean and simple because I believe clarity leads to better decisions.
📌My approach is built on years of experience and a solid track record. I don’t claim to know it all but I’m confident in my ability to spot high-probability setups.
📌If you would like to learn how to use the heatmap, cumulative volume delta and volume footprint techniques that I use below to determine very accurate demand regions, you can send me a private message. I help anyone who wants it completely free of charge.
🔑I have a long list of my proven technique below:
🎯 ZENUSDT.P: Patience & Profitability | %230 Reaction from the Sniper Entry
🐶 DOGEUSDT.P: Next Move
🎨 RENDERUSDT.P: Opportunity of the Month
💎 ETHUSDT.P: Where to Retrace
🟢 BNBUSDT.P: Potential Surge
📊 BTC Dominance: Reaction Zone
🌊 WAVESUSDT.P: Demand Zone Potential
🟣 UNIUSDT.P: Long-Term Trade
🔵 XRPUSDT.P: Entry Zones
🔗 LINKUSDT.P: Follow The River
📈 BTCUSDT.P: Two Key Demand Zones
🟩 POLUSDT: Bullish Momentum
🌟 PENDLEUSDT.P: Where Opportunity Meets Precision
🔥 BTCUSDT.P: Liquidation of Highly Leveraged Longs
🌊 SOLUSDT.P: SOL's Dip - Your Opportunity
🐸 1000PEPEUSDT.P: Prime Bounce Zone Unlocked
🚀 ETHUSDT.P: Set to Explode - Don't Miss This Game Changer
🤖 IQUSDT: Smart Plan
⚡️ PONDUSDT: A Trade Not Taken Is Better Than a Losing One
💼 STMXUSDT: 2 Buying Areas
🐢 TURBOUSDT: Buy Zones and Buyer Presence
🌍 ICPUSDT.P: Massive Upside Potential | Check the Trade Update For Seeing Results
🟠 IDEXUSDT: Spot Buy Area | %26 Profit if You Trade with MSB
📌 USUALUSDT: Buyers Are Active + %70 Profit in Total
🌟 FORTHUSDT: Sniper Entry +%26 Reaction
🐳 QKCUSDT: Sniper Entry +%57 Reaction
📊 BTC.D: Retest of Key Area Highly Likely
📊 XNOUSDT %80 Reaction with a Simple Blue Box!
📊 BELUSDT Amazing %120 Reaction!
📊 Simple Red Box, Extraordinary Results
📊 TIAUSDT | Still No Buyers—Maintaining a Bearish Outlook
📊 OGNUSDT | One of Today’s Highest Volume Gainers – +32.44%
📊 TRXUSDT - I Do My Thing Again
📊 FLOKIUSDT - +%100 From Blue Box!
📊 SFP/USDT - Perfect Entry %80 Profit!
📊 AAVEUSDT - WE DID IT AGAIN!
I stopped adding to the list because it's kinda tiring to add 5-10 charts in every move but you can check my profile and see that it goes on..
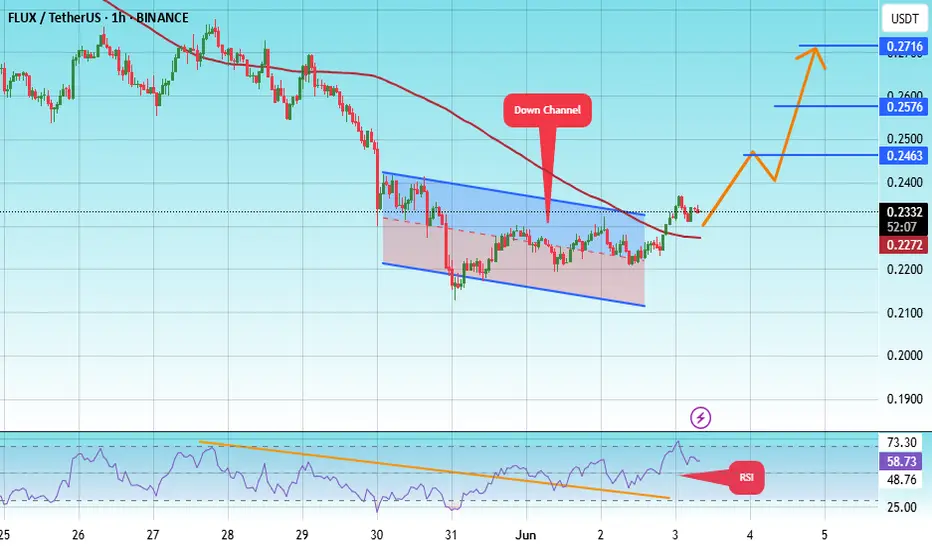
#FLUX/USDT#FLUX
The price is moving within a descending channel on the 1-hour frame, adhering well to it, and is heading towards a strong breakout and retest.
We are experiencing a rebound from the lower boundary of the descending channel. This support is at 0.2150.
We are experiencing a downtrend on the RSI indicator, which is about to break and retest, supporting the upward trend.
We are heading towards stability above the 100 moving average.
Entry price: 0.2335
First target: 0.2463
Second target: 0.2576
Third target: 0.2716
FLUXUSDT 1D AnalysisFLUX ~ 1D Analysis
#FLUX Buy back gradually from here with a short term target of at least 15%+.
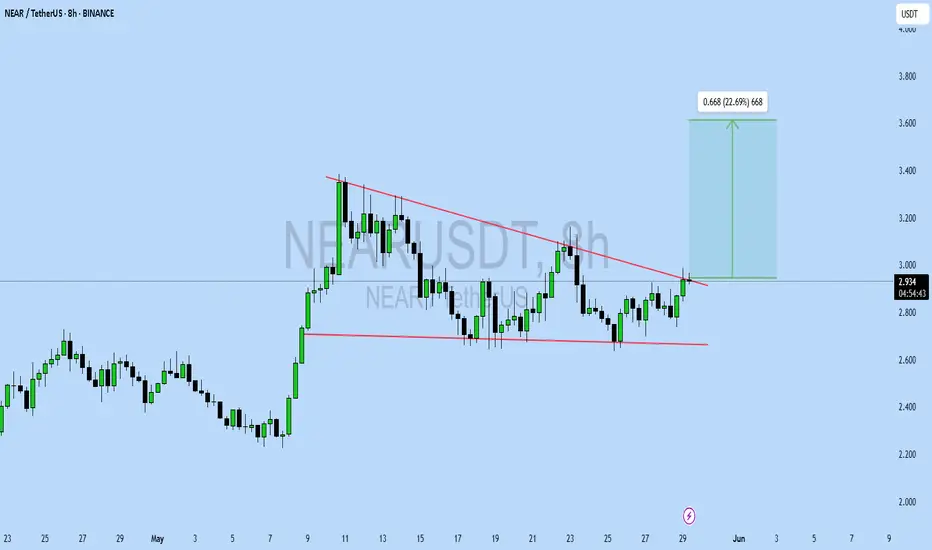
NEARUSDT UPDATE
Pattern: Descending Triangle Breakout
Current Price: \$2.937
Target Price: \$3.60
Target % Gain: 22.69%
Technical Analysis: NEAR has broken out of a descending triangle on the 8H chart. Price is closing above resistance with decent momentum, indicating a potential move toward \$3.60.
Time Frame: 8H
FLUXUSDT 1D Analysis FLUX ~ 1D Analysis
#FLUX Buy gradually from here if you still have confidence in this coin with a short term target of at least 15%++ from here.
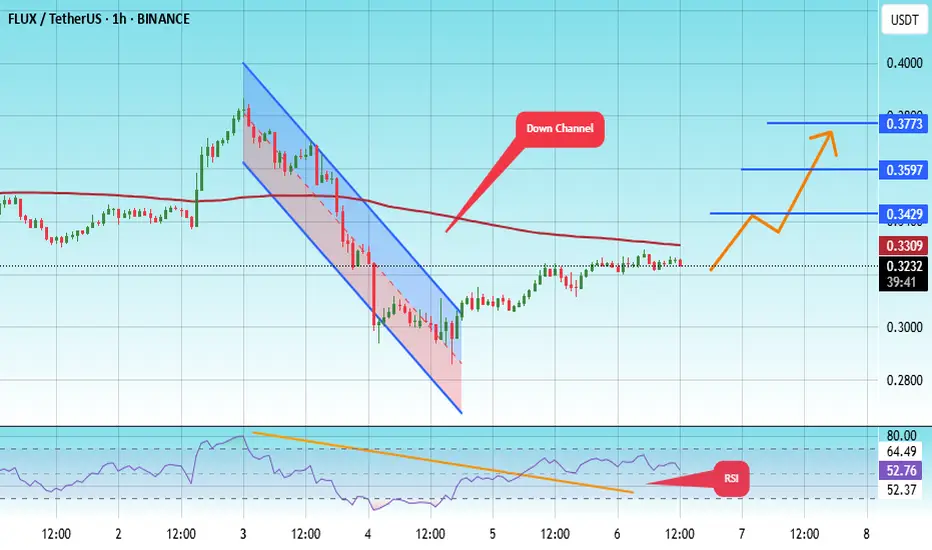
#FLUX/USDT#FLUX
The price is moving in a descending channel on the 1-hour frame and is adhering to it well and is heading to break it strongly upwards and retest it
We have a rebound from the lower limit of the descending channel, this support is at a price of 0.2820
We have a downtrend on the RSI indicator that is about to be broken and retested, which supports the rise
We have a trend to stabilize above the moving average 100
Entry price 0.3231
First target 0.3430
Second target 0.3600
Third target 0.3773
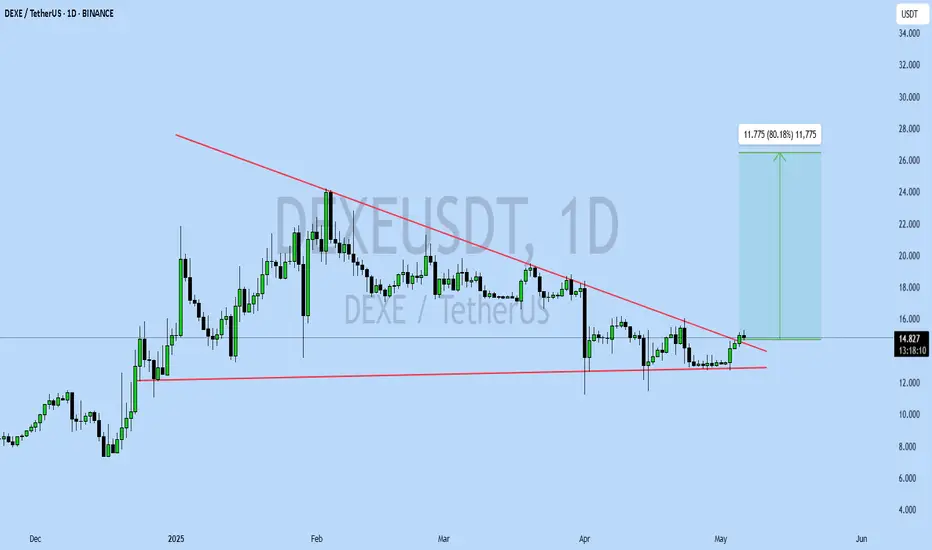
DEXEUSDT UPDATE
Pattern: Bullish Pennant Pattern
Current Price: $14.835
Target Price: $26.61
Target % Gain: 80.18%
Technical Analysis: DEXE has broken out of a descending triangle pattern on the 1D chart. The breakout is supported by a strong bullish candle and sustained price action above the trendline resistance, indicating momentum toward the target.
Time Frame: 1D
Risk Management Tip: Always use proper risk management.
SCRTUSDT UPDATE
SCRT Technical Setup
Pattern: Falling Wedge Breakout
Current Price: $0.2453
Target Price: $0.59
Target % Gain: 160.55%
Technical Analysis: SCRT has broken out of a falling wedge on the 1D chart, indicating a bullish reversal. The breakout is confirmed with strong green candles and volume build-up.
Time Frame: 1D
Risk Management Tip: Always use proper risk management.

KAVAUSDT UPDATEPattern: Falling Wedge Breakout
Current Price: $0.4567
Target Price: $0.74
Target % Gain: 60.53%
Technical Analysis: KAVA has broken out of a long-term falling wedge on the 1D chart, with strong bullish momentum and price closing above the trendline resistance. This breakout signals potential continuation toward the projected target.
Time Frame: 1D

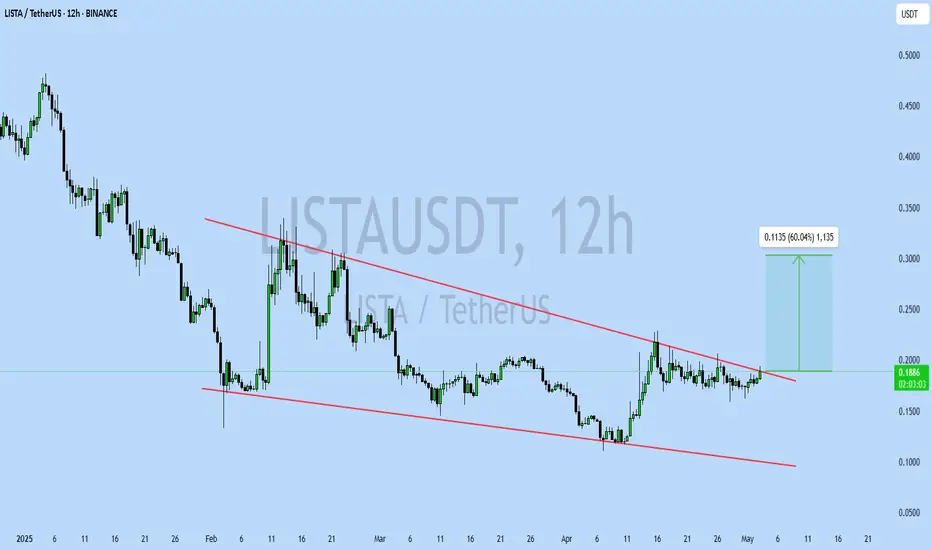
LISTAUSDT UPDATELISTAUSDT Technical Setup
Pattern: Falling Wedge Breakout
Current Price: $0.1893
Target Price: $0.30
Target % Gain: 60.04%
Technical Analysis: LISTA has broken out of a falling wedge pattern on the 12H chart with increasing momentum. Price is holding above the breakout trendline, suggesting bullish continuation. A confirmed breakout with volume could push price to the projected target.
Time Frame: 12H
Risk Management Tip: Always use proper risk management.
FLUXUSDT 1D AnalysisFLUX ~ 1D Analysis
#FLUX Buy when re -testing this support block with a short -term target of at least 10%+ from here.
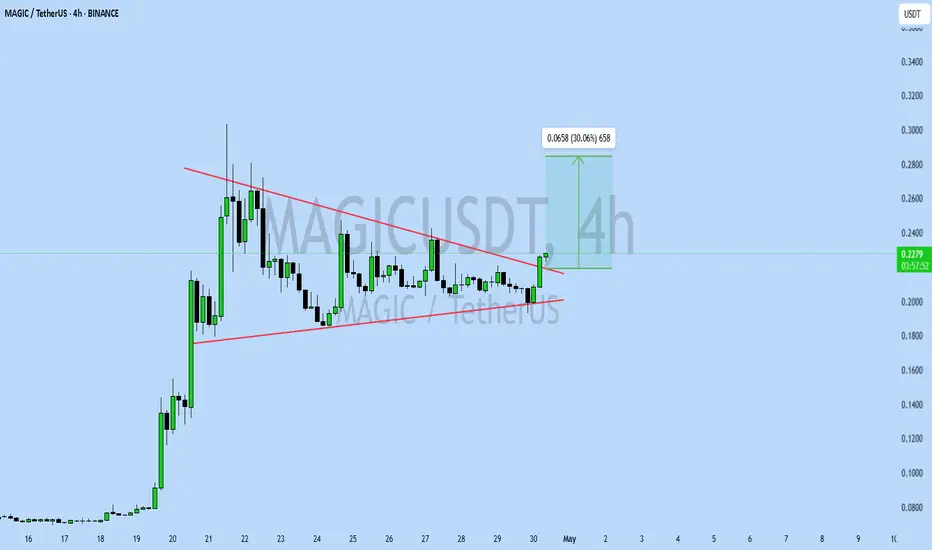
MAGICUSDT UPDATE
MAGIC Technical Setup
Pattern: Symmetrical Triangle Breakout
Current Price: $0.2253
Target Price: $0.290,
Target % Gain: 30.06%
Technical Analysis: MAGIC has broken out of a symmetrical triangle on the 4H chart with a strong green candle and volume spike, signaling bullish momentum and a potential 30% upside move.
Time Frame: 4H
Risk Management Tip: Always use proper risk management.
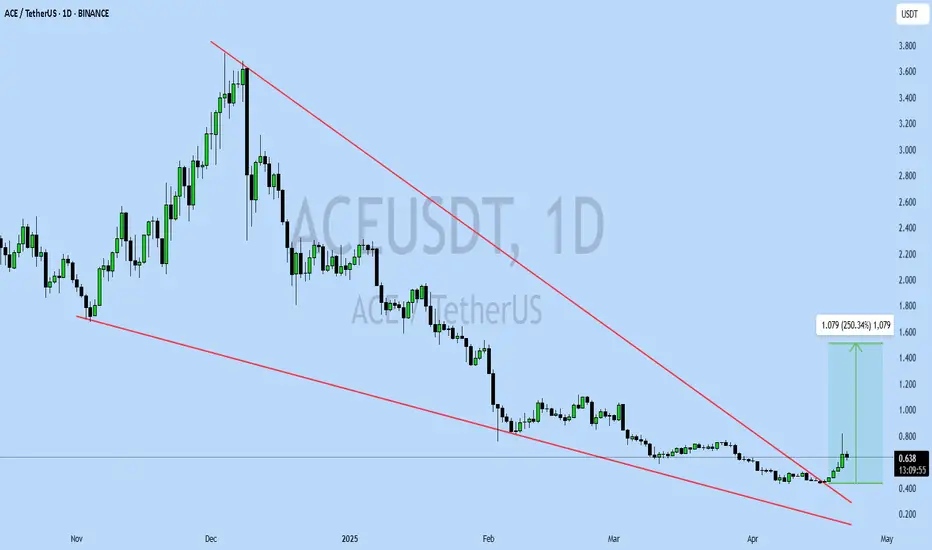
ACEUSDT UPDATEACE/USDT Technical Setup
Pattern: Falling Wedge Breakout
Current Price: $0.635
Target Price: $1.714
Target % Gain: 250.34%
Technical Analysis: ACE has broken out of a long-term falling wedge pattern on the 1D chart with strong bullish momentum. Volume has increased significantly, confirming the breakout with potential for a 250% upside move.
Time Frame: 1D
Risk Management Tip: Always use proper risk management.
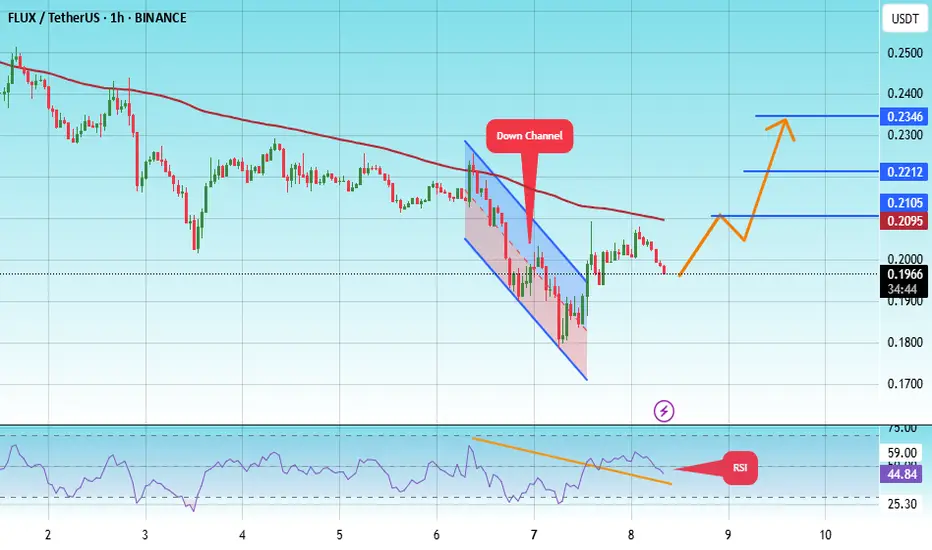
#FLUX/USDT#FLUX
The price is moving within a descending channel on the 1-hour frame, adhering well to it, and is on its way to breaking it strongly upwards and retesting it.
We are seeing a rebound from the lower boundary of the descending channel, which is support at 0.1766.
We have a downtrend on the RSI indicator that is about to break and retest, supporting the upward trend.
We are looking for stability above the 100 Moving Average.
Entry price: 0.1966
First target: 0.2095
Second target: 0.2212
Third target: 0.2346
DEGOUSDT UPDATEDEGO/USDT Technical Setup
Pattern: Falling Wedge Breakout
Current Price: $1.808
Target Price: $3.70
Target % Gain: 115.05%
Technical Analysis: DEGO broke out of a falling wedge on the 1D chart, showing bullish momentum with a clean candle close above resistance and follow-through volume. Chart suggests potential continuation toward the measured target.
Time Frame: 1D
Risk Management Tip: Always use proper risk management.

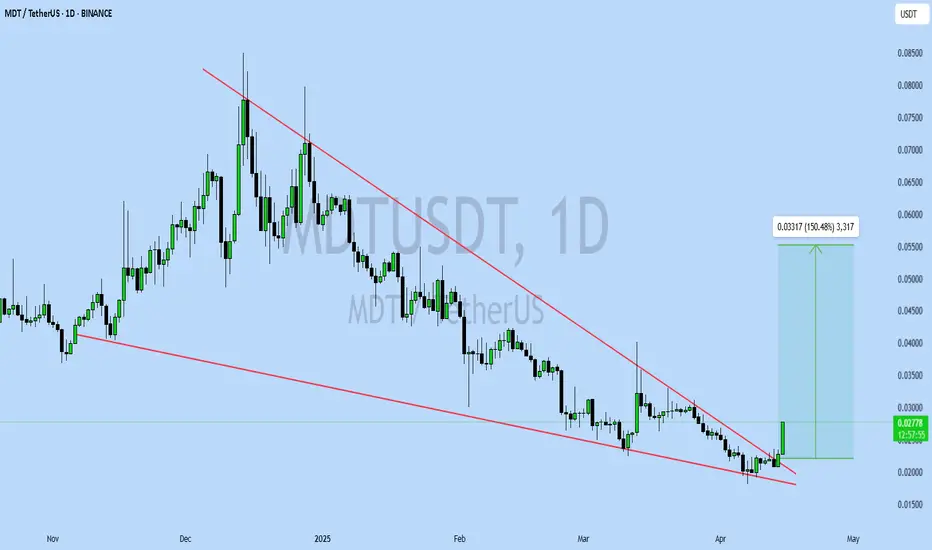
MDTUSDT UPDATEMDT/USDT Technical Setup
Pattern: Falling Wedge Breakout
Current Price: $0.02544
Target Price: $0.0586
Target % Gain: 150.48%
Technical Analysis: MDT has broken out of a falling wedge on the 1D chart with a strong bullish candle and an 11.82% daily gain, confirming momentum. Breakout volume and candle close above resistance support further upside.
Time Frame: 1D
Risk Management Tip: Always use proper risk management.
DOGEUSDT UPDATEDOGEUSDT is a cryptocurrency trading at $0.16485, with a target price of $0.30000. This represents a potential gain of over 90%. The technical pattern observed is a Bullish Falling Wedge, indicating a possible trend reversal. This pattern suggests that the downward trend may be coming to an end. A breakout from the wedge could lead to a significant upward movement in price. The Bullish Falling Wedge is a positive indicator, signaling a potential price surge. Investors are showing optimism about DOGEUSDT's future performance. The current price may present a buying opportunity. Reaching the target price would result in substantial returns for investors. DOGEUSDT is positioned for a potential breakout and significant gains.

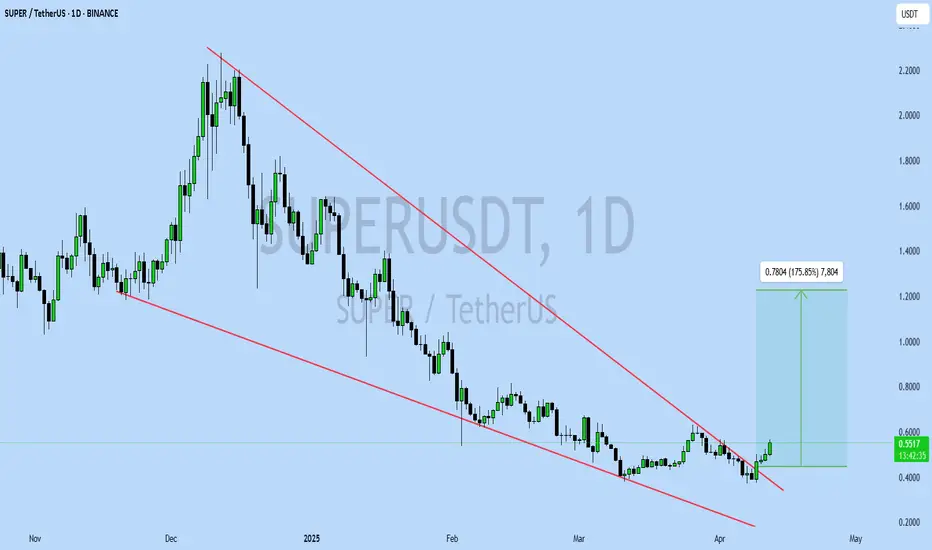
SUPERUSDT UPDATESUPERUSDT is a cryptocurrency trading at $0.5519, with a target price of $1.2000. This represents a potential gain of over 170%. The technical pattern observed is a Bullish Falling Wedge, indicating a possible trend reversal. This pattern suggests that the downward trend may be coming to an end. A breakout from the wedge could lead to a significant upward movement in price. The Bullish Falling Wedge is a positive indicator, signaling a potential price surge. Investors are showing optimism about SUPERUSDT's future performance. The current price may present a buying opportunity. Reaching the target price would result in substantial returns for investors. SUPERUSDT is positioned for a potential breakout and significant gains.