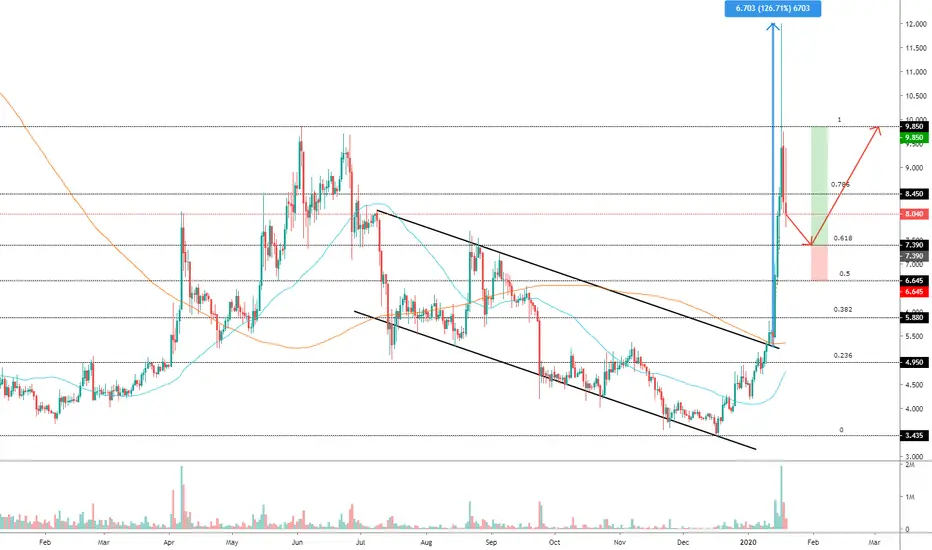
ETCUSD: what's going on?One week ago on Sunday (12th of January) Ethereum Classic completed the "Agharta" hard fork, which makes it "more interoperable" with sister-chain ethereum.. whatever that means, ETC more than doubled its value in a couple of days during the week.
Technically speaking the price broke out from the descending bearish trend, which provided a good signal for possible trend reversal and opening long positions on 12th of January..this proved to be a good idea! However, 2 days ago (on 17th of January) the price formed a kind of a shooting star candlestick chart pattern (which was more like an inverted hammer pattern but in the up-move), so at the moment the correction or realization of profit is taking place.
Now the question is how deep is it going to be?
I think buying now is more like a FOMO, so it's better to wait for a correction at least until 61,8 fibo retracement level, which is around 7.39 price.. from there it's possible that we are going to see a rebound and continuation of the uptrend.
If playing the above mentioned scenario, the target can be around 9.85 and stops below 6.645 (R:R=3.3).
It's also possible that we are going to see a deeper correction to 5.88 price level..so everyone should calculate and implement their own risk management strategy.
ETC annual yield: 1,023%
//
Follow me to stay updated.)
Followthetrend
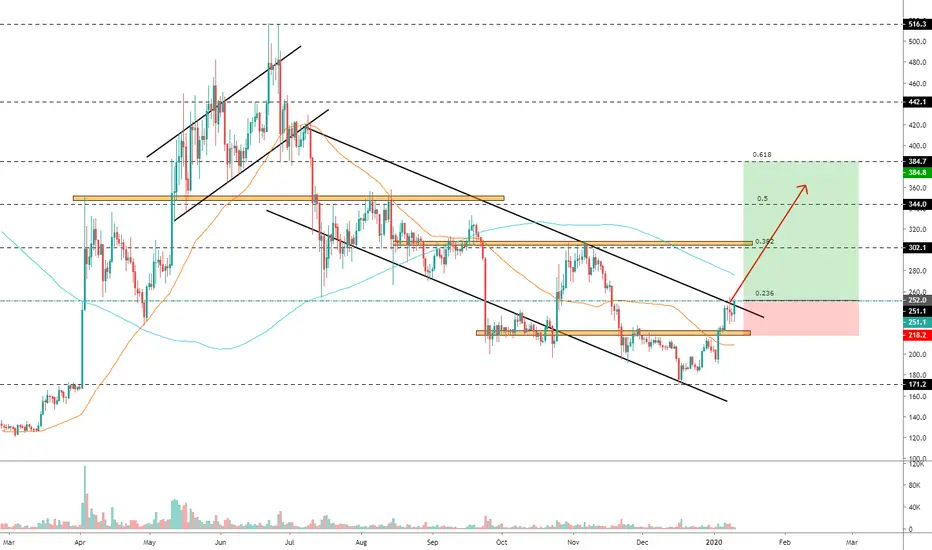
BCHUSD: possible long scenarioIn my previous post i was wondering whether BCHUSD going to go up.
Now BCHUSD price is testing the downtrend line formed since July 2019, if today the price closes above the line it seems reasonable to join bulls.
The target can be around 384 price or 61,8 Fibonacci retracement level, while setting stop below 218 is decent from R:R (4:1) prospective.
BCH annual yield: 3,7657%
//
Follow me to stay updated with my ideas!)
EURUSD high probability shortSince April 2018, EUR/USD has been in a down trend, with lower lows, and lower highs. The reason why the title says "High probability" is because I see similarity between what happened with EU from the beginning of June 2019 - end of juli 2019. This "coincidence", in addition to the over one and a half year declining trend, makes me comfortable with executing this position shortly. I will be waiting for confirmation before going short. What i will be looking for in terms of a confirmation is: A. Strong resistance from 200MA (purple line) on the Daily chart. B. fast EMA (green line close to price) crossing the slow EMA (red line close to price) downwards. C.Bearish volume.
PS: The short RR on my chart is visualisation for my prediction ONLY, and is not ment to be applied as a trading-plan.
I will be commenting on this idea when time is right.


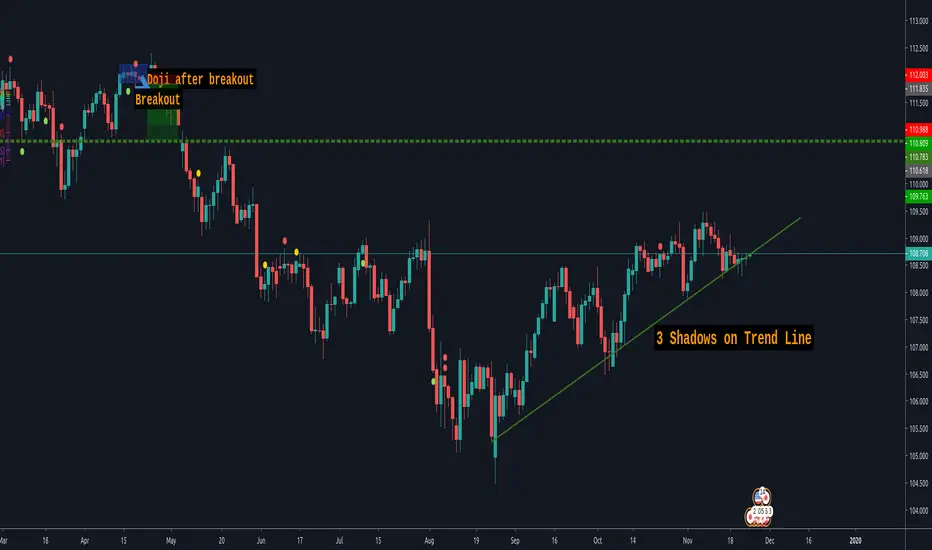
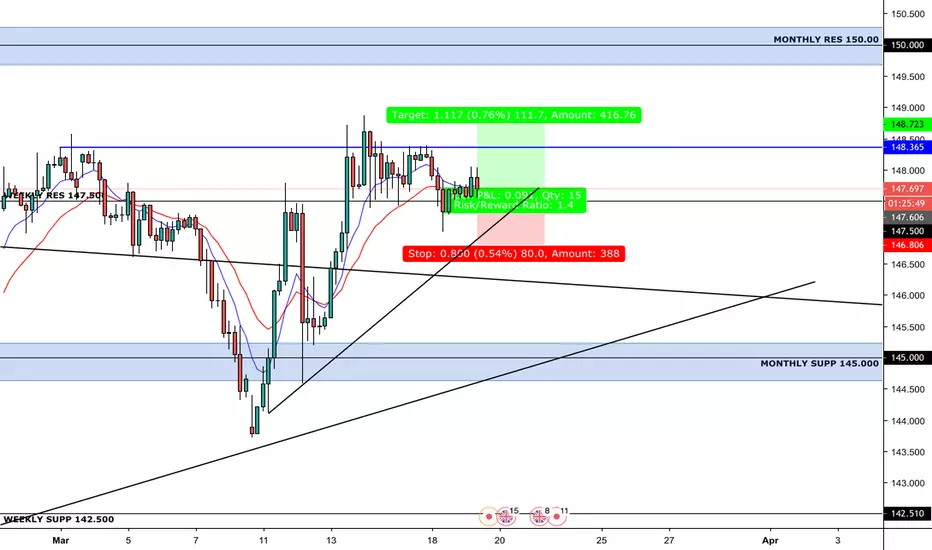
3 ShadowsWe can see 3 shadows on Trend Line, a Huge patern, very goood oportunity to go with the Trend! FX:USDJPY
Follow the trendAfter Gold broke the first parallel down trend we saw the highest ROC and It is usually highest in the openings of a bull market.
Now the ROC is in a fairly good spot, not overbought.
The AM & PM Fix doesn't show any signs of gold having peaked yet.
Where the ROC points price tends tp follow, gold could advance more. We have currently rejected the lower trendline (1483) in the newer more exponential channel up, also right above the long support at 1477.
In my humble view, we will see gold rise further and try and take out the resistance line at 1570 yet again, if successful the way to 1800 is rather clear of resistance.
As always there will be fluctuations.
Happy trading & a good day


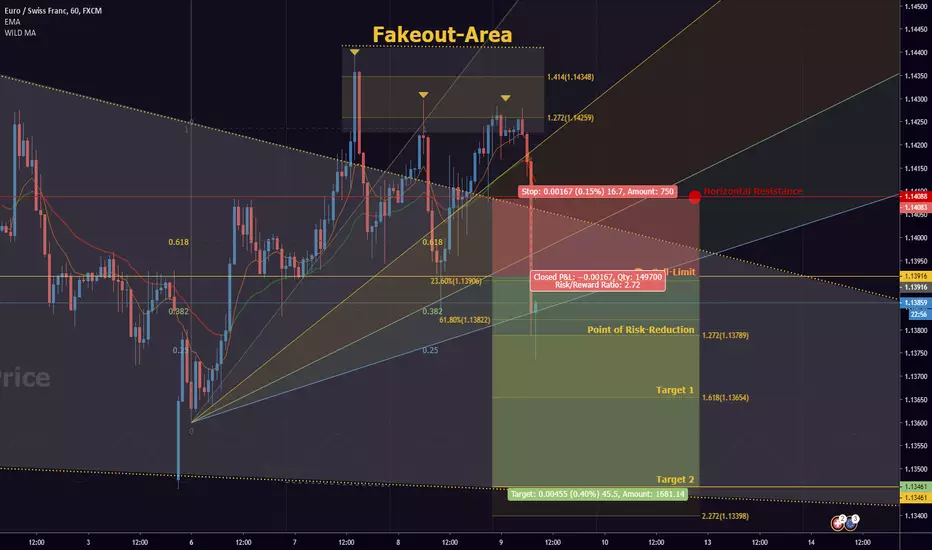
EUR/CHF: Day-Swing-Setup! Huge MOMENTUMHey tradomaniacs,
welcome to another free signal!
Important: The market is still news driven and very nervous due to tradewar-talks!
Tarrifs might come this midnight (german time). So be carefully and reduce your risk as good as possible!
-----------------------------
Type: Day-Swingtrade
Sell-Limit: 1,13916
Stop-Loss: 1,14088
Target 1: 1,13655
Target 2: 1,13461
Point of risk-reduction: 1,13793
-----------------------------
LEAVE A LIKE AND A COMMENT - I appreciate every support! =)
Peace and good trades
Irasor
Wanna see more? Don`t forget to follow me.
Any questions? PM me. :-)
EUR USD SHORT AFTER WEEKS OF LOWER LOWS BEING CREATED AND 68.1% FIB BEING HIT AND NO CANDLES BEING ABLE TO BREAK ABOVE JUST WAITING FOR THIS TREND LINE TO BE BROKEN FOR CONFIRMATION TO ENTER SHORT TO CREATE A NEW LOWER LOW....!!!!!
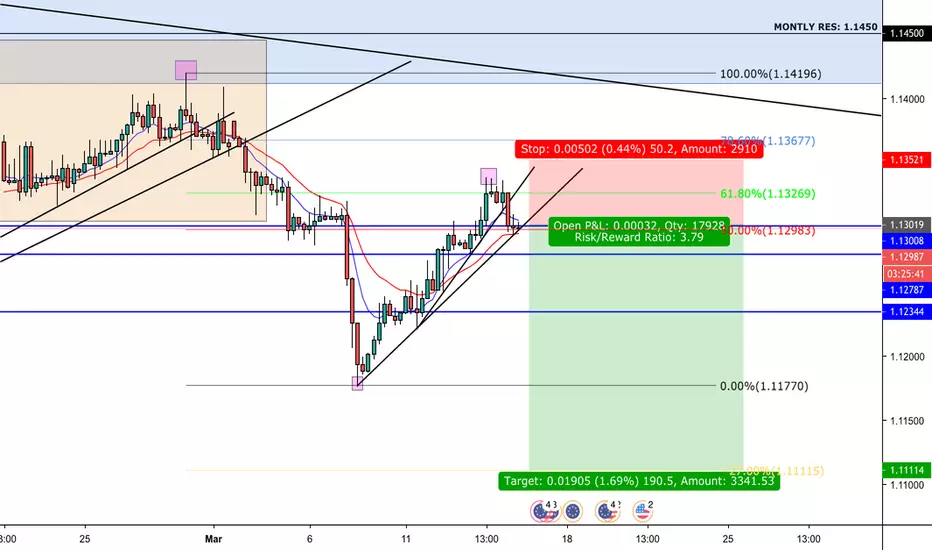
GBP JPY LONG TO JUST ABOVE DAILY RESISTANCEAfter 5 days of consolidation above the weekly resistance now support . also a fake breakout yesterday and MA's still in the biased direction in the weekly daily and 4 hour. i favour a long position for 118 pips.
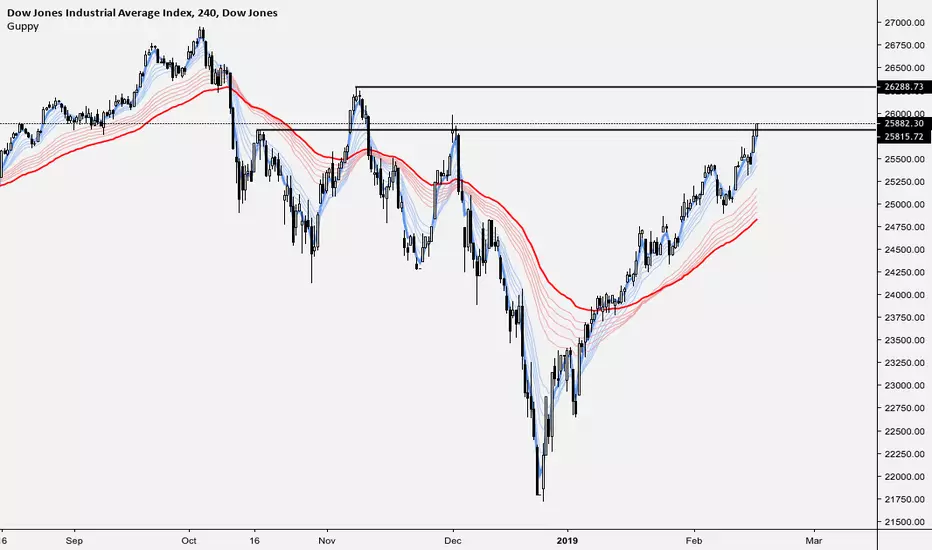
Stop shorting and protect your capital Kindly reminder : as a trader, protect your capital must be your priority
On the social networks, i see many people shorting the SP500 , DJI and co. Please, stop it for the moment. PS : stop shorting doesn't mean you must long ;)
Many people are trying to predict the next leg down. OK, we can see bearish divergences but what more ? In a strong trend, indicators are not so relevant...
Just follow the trend, which is easier than predict something. In this case, I use the Guppy :
- On the daily, traders are above investors = bullish
- On the H4, traders are above investors = bullish
- On the H1, traders are above investors = bullish
In all these time frames, the first EMA is bellow the price = bullish .
My conclusion : We are in a strong bullish trend , maybe I will consider to short if traders are bellow investors in the H4 at least. If you want to short, why not because we are near resistences but you must wait a signal !
Clément

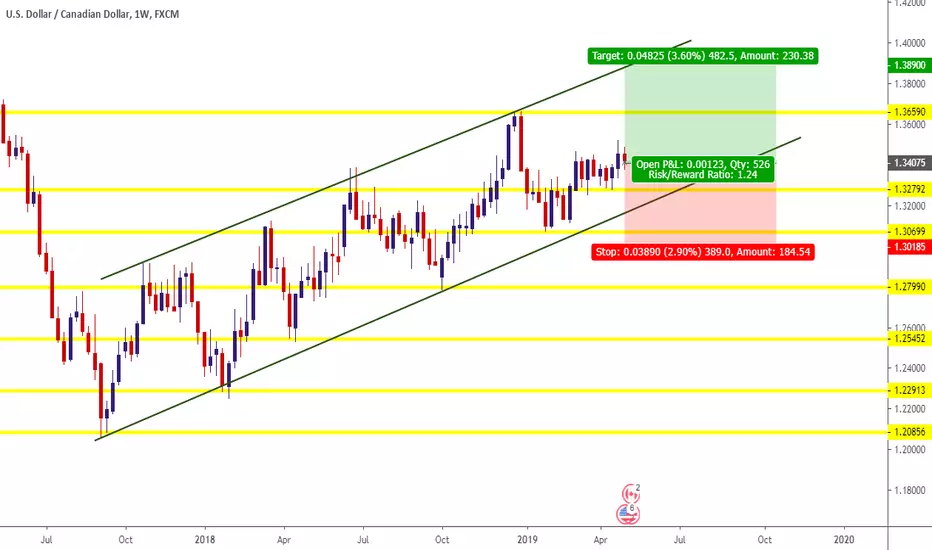
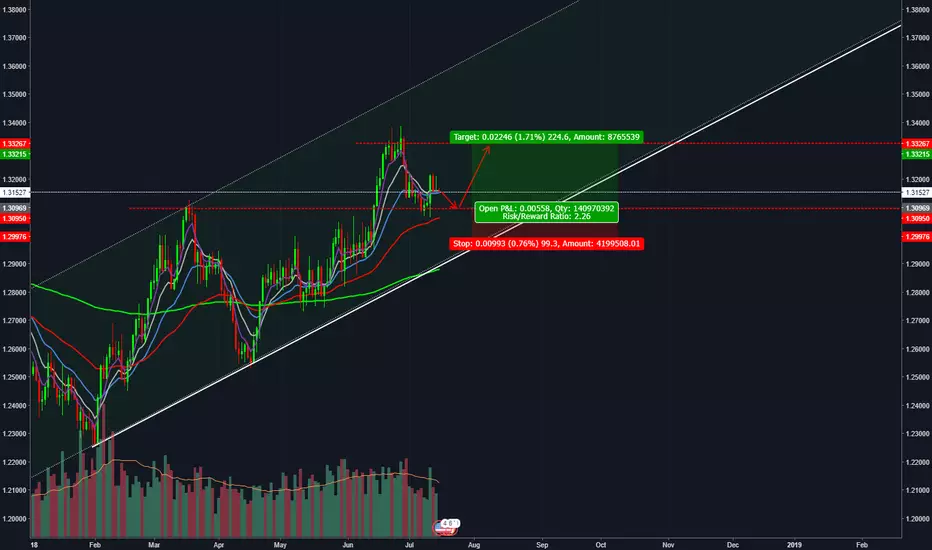
Just Follow The Beautiful Trend!USDCAD has been trending up beautifully!! I'm going LONG, just waiting for a pullback on 1.30939. I don't wanna go against the trend!!
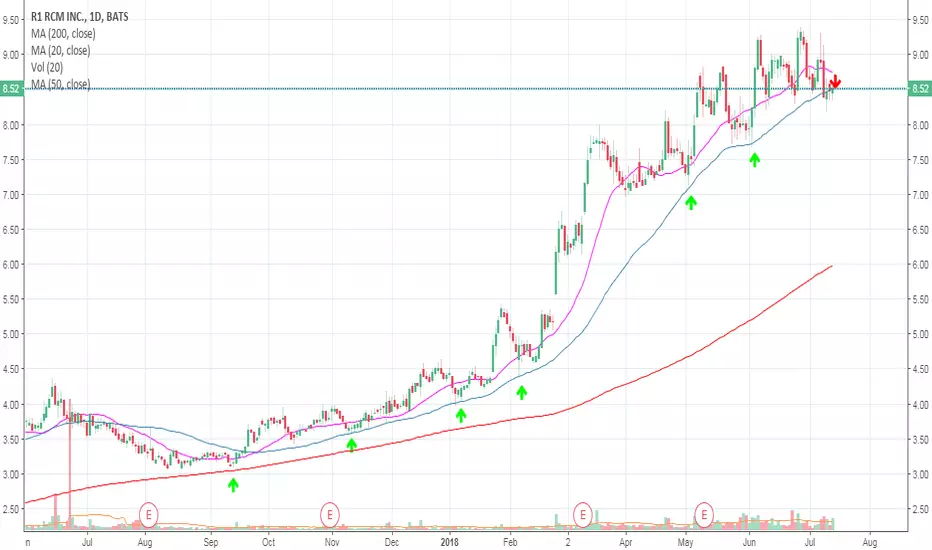
$RCM Trend FollowingThe sma200 and sma50 offered great entries to ride this strong uptrend.
Follow moving averages, enerything else is noise, only price pays.
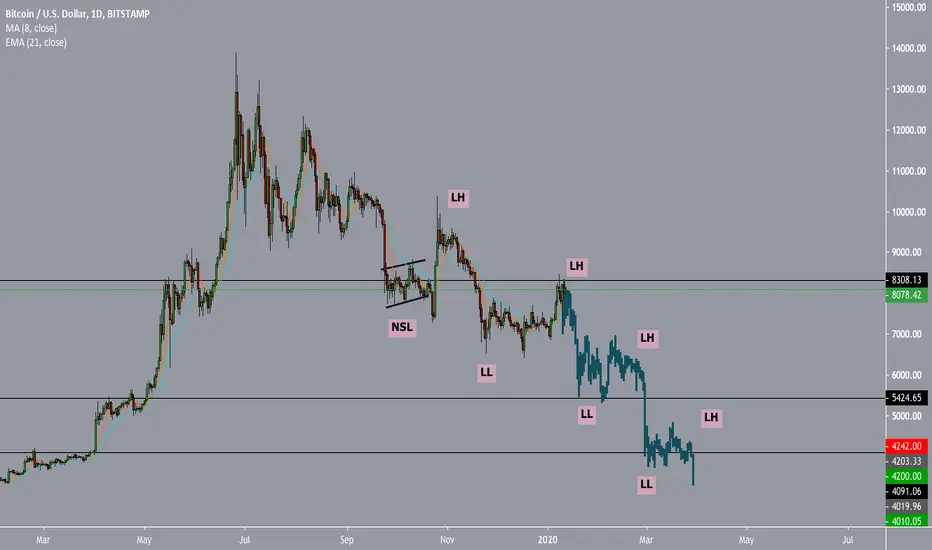
UPDATE: the Red Sea Path to the $5400 is Upon UsAs I stated in my last published idea, Bitcoin is falling and falling fast. Please put your pride aside and make money will you can while the market continues to tank before the regulators come in. WE ARE IN A BEAR MARKET! Let us not keep falling for the moon reversal that Bitcoin keeps fooling us with!
Now, with that said- lets get down to the numbers
Simply put, check out the dark red channel that will serve as the red carpet arrival to Bitcoins $5400 mark.
WARNING;;; there is a heavy chance that we will see some form of resistance at these places:
- $6000 mark-
-$5900 mark-
- $5780 mark-
All 3 of these marks (marked in orange on the chart) stand as one of the swings that formed a resistance to the price continuing its progression within this bear market.
+++PLEASE do not fall for the bear trap at these reversal levels+++
In closing, (HERE IS A LITTLE BACKGROUND) ::: I want you guys to know that I am an avid believer in the bright future of cryptocurrency. I was once a proud "HODLER" myself until I couldn't take checking my blockfolio every two days to see another 2k down the drain. Just like you I was convinced that, "you don't take a loss until you sell" - which is true. However, I have been shorting the market since the 7.8k mark and have made my losses back plus a healthy amount on the side. With this large amount of extra money in my trading account, I can now buy back the market once the regulators come- until then... I will be collecting and hope you guys decide to as well.

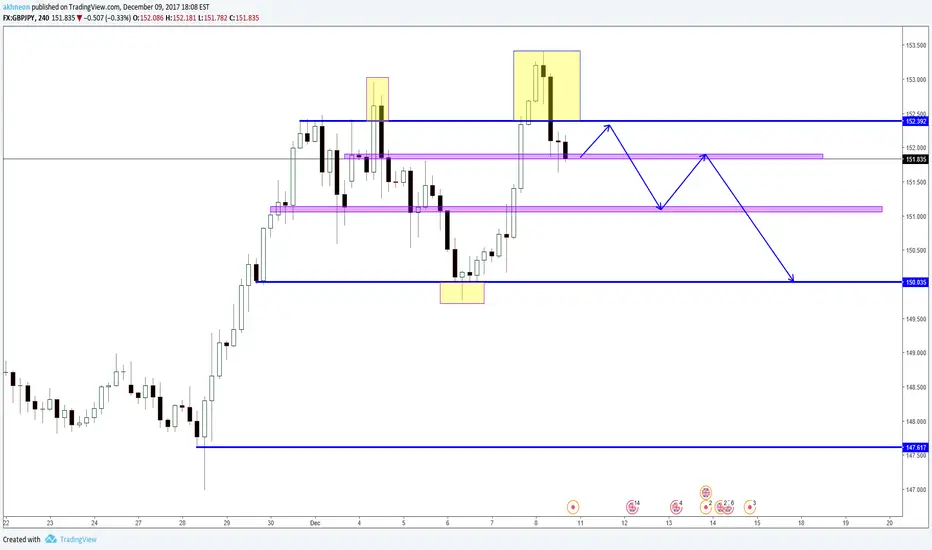
GBPJPY - Bearish Movement - Support & Resistance First of all , I've mapped out the support and resistance's and there is a clear bearish movement, its reached one of the support at the
151.835 key level , we should be seeing a retest pushing back towards the resistance and we should hopefully see it drop down to the 151.183 key level! FX:GBPJPY
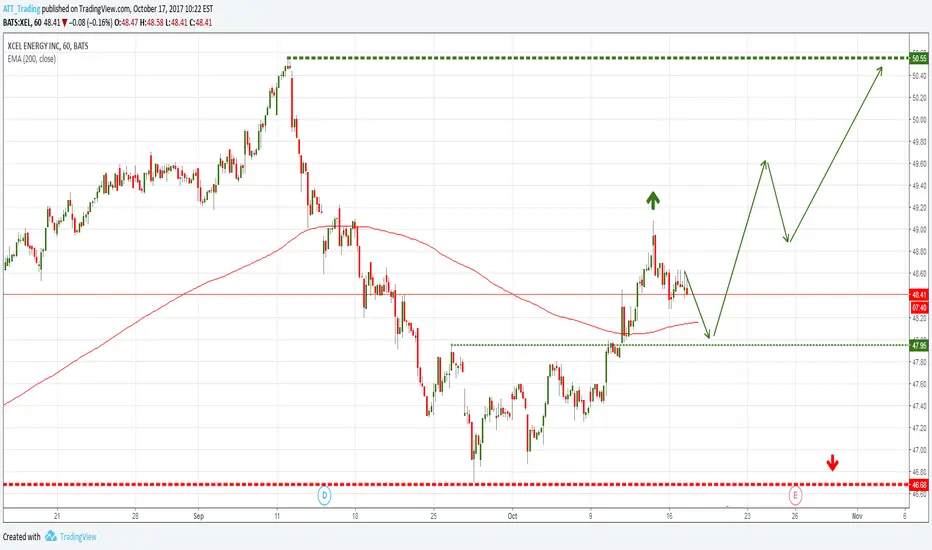
XEL Xcel Energy Inc. long - How high can it fly?The stock is still in an intact upward trend, and is currently about 50% into the correction of the previous upward movement. In order to find an entry in the long direction, we should be on the lookout for signals in the subordinate trend. In the hourly trend, we could soon see next upward-pointing 123s occurring. Here, the entry can be made at the point 2 or subsequently from out of the correction, with a stop loss at the point 3 that will have formed by then. For a target level, we can use the area around 50.50 USD (green line). If the value significantly and sustainably falls below 45.20 USD (red line), the long scenario should be abandoned.
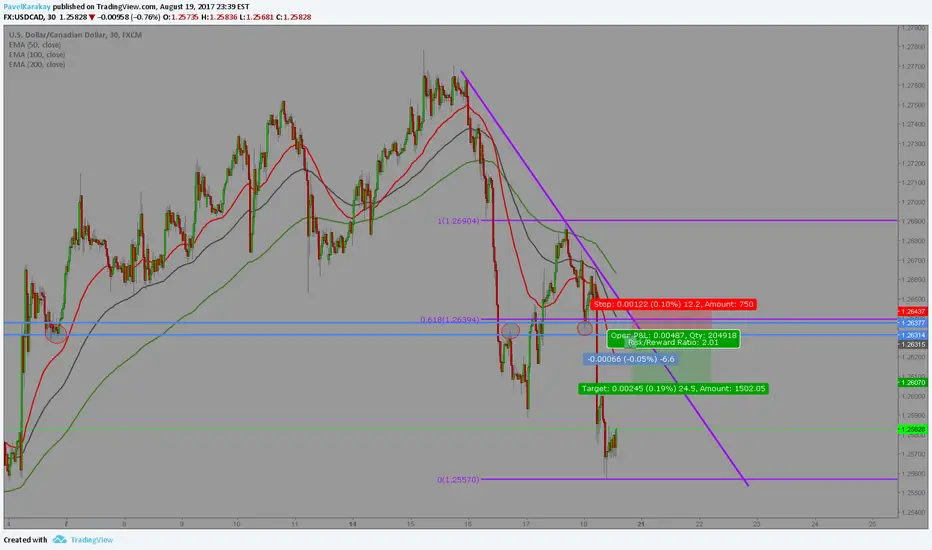
USDCADFollow the Trend!
Entry at 100 ema
--Must be within 6 pips of lower horizontal resistance
Reasons for entry.
1. 3 emas down trend
2. 100 ema resistance
3. Minor horizontal resistance
4. Drawn trend line resistance
5. Fib level resistance
SL above upper horizontal resistance 6 pips(spread + 3)
TP 2:1
Trade at your own risk.
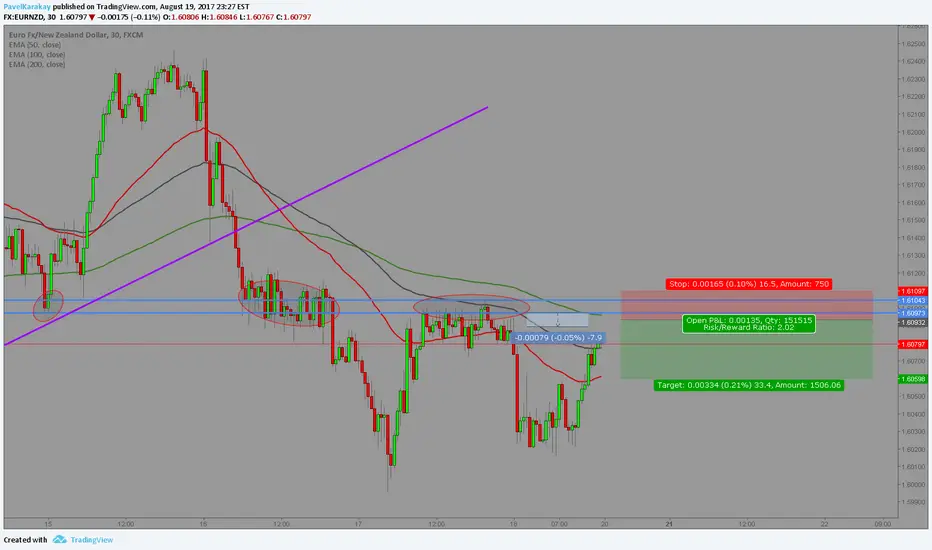
EURNZDFollow the Trend!
Entry at 200 ema
-- must be within 8 pips of lower horizontal resistance
Reasons for entry
1. 3 emas down trend.
2. Horizontal resistance.
3. 200 ema resistance.
SL above upper horizontal resistance 6 pips(spread +3)
TP 2:1
Trade at your own risk.