SPY Bull Run Eyes $492 Post-FOMC: Key Indicators & Gaps AnalyzedSPY's Bullish Surge: Decoding Market Indicators and Gaps
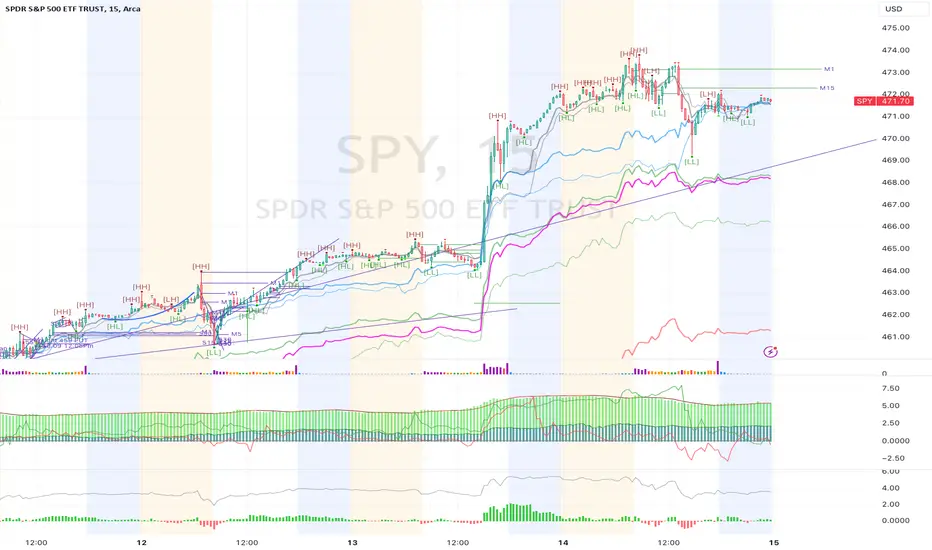
The SPY is riding a bullish wave, scaling new heights with remarkable momentum. On my chart, three proprietary indicators are at play, offering unique insights into the market's pulse. Particularly noteworthy is the indicator that measures cycle direction strength across time frames. Currently, it signals substantial bullish force from the higher period cycles – a force that remains unyielded.
Post-FOMC statements have set the upper resistance for SPY around $492, and that's my line in the sand for considering any short positions. We're not there yet, and the strength indicators suggest the climb isn't over.
Thursday's trading painted a complex picture: an impulse wave downwards, which acts as a correction to the previous day's upward surge, left a notable gap at 472.30. The odds are in favor of this gap being filled before the market rings in the new day. Yet, from the vantage point of the shorter cycle, the target gap stands higher at 462.88.
When it comes to trading these gaps, the rule of thumb is clear: the market must tread in the gap's direction for it to be closed. As traders, we watch these patterns closely, for they often spell the difference between an ordinary trade and a strategic win.
Stay tuned, follow for updates, and trade with the confidence of informed insights.