Footprint

BTC Sell Off Here is What Happened and what you can learnHello and Thanks for stopping by, this is my first tutorial post so go easy on me haaaaa
Ok well all is self explanatory really as you can read by the chart .
Lessons that can be learned from this can be repeated over and over again but the truth is we will always see the same scenario playing out over and over again because that is what feeds those who are succesfull at trading .
Simply put what you see on the chart is a example of greed and stupidity, Ok we have seen it all 1000s of times before but someone out there does not want to make the same mistakes again and this post is designed to help you better prepare yourself for this eventuality and give you some positive guidelines to improve as a trader .
1, Do not Long Tops and dont short bottoms . FOMO might work some of the time but most of the time you will regret it
2, Plan the Trade and trade the plan or you will only plan to Fail
3, Patience always pays * wait for the Retrace or the breakout depending on the trade you want to take with a solid plan in mind
4, Always use a SL and know when and where you are wrong. Risk management is so important learning to protect your capital keeps you in Business
5, There is a time and a place for Leverage learn this without going BUST
6, Understand the importance of Position size and use a Position size Calculator if that makes it easier
7, Learn the power of Footprint Charts and how to use that candle Data to your advantage. Seeing Millions at the top or bottom really is a great advantage
8, Take profits on the way up or down at strategic points , Locking in profits guarantees you get paid and you wont get caught out being Greedy
9, The market has no emotions only traders do ! If you are emotional you are probably taking too much risk of your capital...
10, Accept that being wrong in Trading is Normal, provided you calculate every trade you will only lose the minimum and live to trade another day
11, Most of the time There will always be that grab Liquidity move, up or down, remember that ! Rather than placing a SL where its crowded. Don t think Like the Herd
12, Learn why Open Interest is important and how funding impacts you ! This is probably overlooked by many whom trade BTC Perpetuals
I will leave you with this Quote " The Market does not know you exist. You can do nothing to influence it. You can only control your behaviour"
Thankyou for reading my post and I hope it helps somebody .

AUDUSD - Institutional Liquidity - Understand the WhyImagine understanding how to execute with precision?
Imagine understanding the Why behind the markets....
Liquidity, Footprints, Level ll which is all considered within the framework of 'smart money concepts'
December is traditionally known for the lack of liquidity and reduced volume in turn which causes increased volatility. Traditionally many including myself trade less throughout December and I tend to wrap my trading up around The second week of the month to spend time with my family, friends and loved ones. As we all know from an institutional stand point the seasonal holiday tends to be the month many take off to do the same but other than the above do you ever wonder why? ...... Bonus Month. PnL on institutions books are calculated for the year end and of course subjective to performance the portfolio manager & team are paid in accordance with the 'Net ROI (Factoring in either the hurdle rate or the watermark)
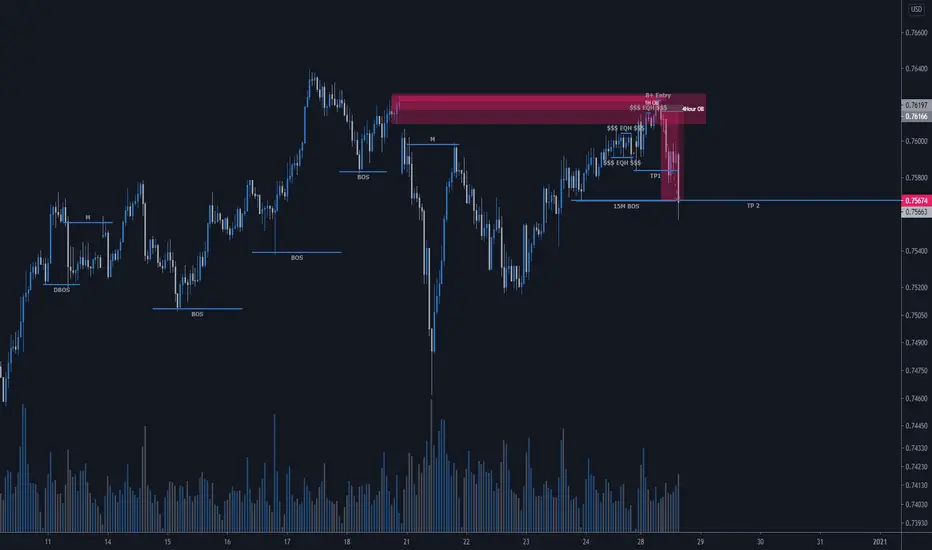
Now the above is somewhat irrelevant but it's important to understand the Why..... So lets now take a look at understanding the Why behind this AUD/USD Short on 28th December 2020 at 08:44am shortly after the London/European open, But, first here are the performance metrics and values;
Percentage ROI: +15.87%
Initial Risk: 1% (factoring in RT Commissions)
Stop Loss: 3 Pips
Drawdown: 0.9 Pips
Trade Duration: 7 Hours (Trade hit TP2 @ 15:46 UK GMT)
____________________
So lets take a look at the trade Breakdown
Weekly Timeframe:
The Weekly going back to 2001 has since been in a bullish uptrend, creating Higher Highs & Higher Lows until 2014 after it printed a Lower Low and failed to purge liquidity and create a Higher High. Price continued to create Lower Highs and Lowers Lows, Building Liquidity on it's way down. In March 2016 we Broke Major structure to the downside and printing a new structurally significant Low, Taking Liquidity. to allow for a Push to the upside, lifting offers, seeking the Institutional level & footprint which was yet to be 'Mitigated' from May / June 2018.
Daily Chart:
Price as we can see on the Daily timeframe is extremely efficient within the market structure & sub-structure. Building & Creating Liquidity to be targeted / purged and swept !
1Hour:
On December 21st 2020 we gapped down with intent and momentum creating multiple Breaks of structure to the downside, then correctively over the next 6 days moved back up to not only fill gap liquidity but tap into the Order Block left, Seen clearly..... Which was the beginning of our short trade ......
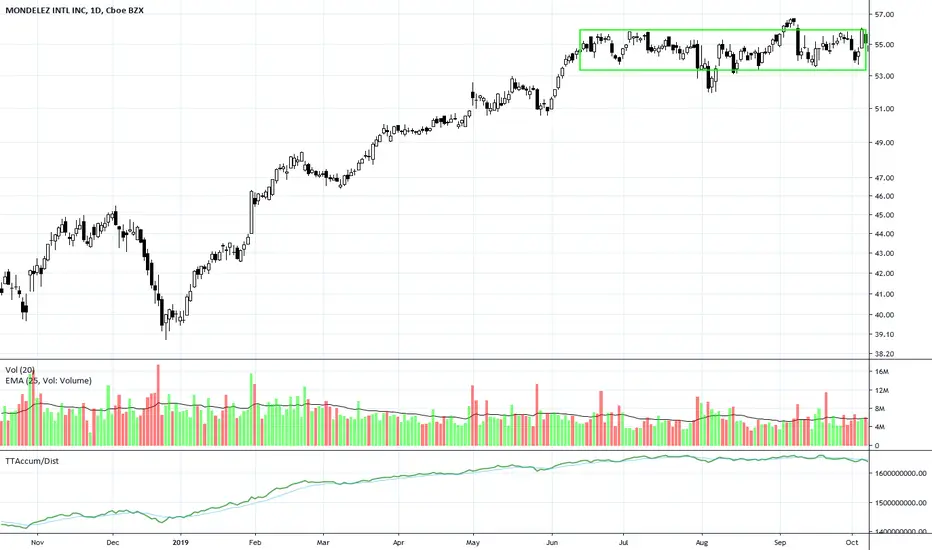
MDLZ Forms Long Platform PatternMDLZ has developed an unusually long Platform candlestick pattern at a new all-time high. The highs and lows are quite uniform, which is often the footprint of Buy Side Institutions using Dark Pools.
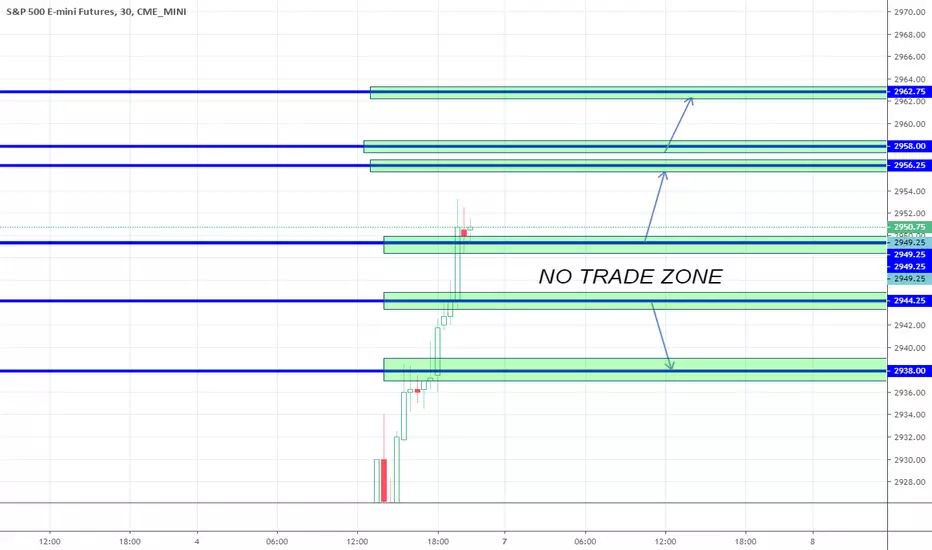
S&P500 - MONTHLY FORECASTHello Traders!
The very interesting situation in the S&P500 index (ES). Suppose, that the market can take a form of Horizontal Triangle (EWA/EWP HT 3-3-3-3-3) So, we will try to buy near 1-st Strong Buyer's Support and take long position at the price 1871.00 (863 843 lots). The price target - 2089.00, our hedging risk T/P - 2035.00, S/L - 1870.00 (Of course S/L 1870.00 it's the approximately price, the accurate enter to the market, will produce by the detailed EWA/EWP on 1 minute chart, using Market Profile, Volume, Footprint, Depth of Market&Order Flow analysis) If you want to see the video of our trading, be active! Subscribe and vote for us!
Sincerely yours, Powerful Traders.
