TESLA and FORD: Unlikely Collaboration Shakes Up the EV IndustryIn the world of business, collaborations between competitors are rare occurrences. However, an unexpected turn of events recently took place when Tesla, the prominent electric vehicle (EV) giant, and traditional automaker Ford surprised Wall Street by joining forces. This partnership entails Ford customers gaining access to Tesla's supercharger network for charging their vehicles.
The announcement came during a Twitter-spaces event where Ford CEO Jim Farley engaged in a conversation with Elon Musk to discuss the electric vehicle industry. This collaboration aims to provide satisfaction to Ford's customers while potentially benefiting Tesla's shareholders.
This development has the potential to create a lucrative revenue stream that could significantly enhance Tesla's financial resources. Here are the key details you need to know.
As electric vehicles bring about a technological shift, the establishment of charging infrastructure becomes crucial to support the growing number of EVs on the roads. Unlike refueling a car at a gas station, charging an electric vehicle requires compatibility between the vehicle's charging ports and the attachments at the charging station.
Tesla introduced its proprietary charging standard called the North American Charging Standard (NACS), which is used in all its vehicles and charging stations in the United States and Canada. However, many of Tesla's competitors have adopted a different design known as the Combined Charging System (CCS) and consider it the industry standard for electric vehicles. With Tesla having sold more vehicles than its competitors, who are still scaling up their production, the question arises: which design should be considered the true standard?
In an effort to enhance customer experience and boost its EV sales, Ford has strategically decided to leverage Tesla's well-established charging network. As part of the partnership, Ford will provide adapters that enable their current electric vehicles to connect with Tesla's NACS ports instead of the CCS standard. This collaboration holds significant potential for the EV industry as a whole, as increased adoption of the NACS design would further solidify Tesla's position as a market leader. More vehicles utilizing the NACS standard would result in higher charging traffic for Tesla.
This move presents an excellent opportunity for Tesla to generate profitable revenue by attracting non-Tesla drivers to its charging network. Since Tesla has already invested substantial capital in building and expanding its charging infrastructure, any additional payments received from non-Tesla vehicles would greatly contribute to its bottom line.
The exact pricing structure for Ford owners to use Tesla's network is yet to be determined, but there are some indicators. Tesla charges its customers based on kilowatt-hour usage, and non-Tesla users typically pay a premium compared to Tesla owners. Tesla also offers a monthly subscription option priced at $12.99, which reduces the kilowatt-hour rate to match that of Tesla owners. This could give us an estimate of what Ford users might expect to pay.
Currently, revenue from paid supercharging represents a small portion of Tesla's overall business, categorized under services and other in its financial reports. In the first quarter, this revenue segment amounted to $1.8 billion out of a total of $23 billion. Therefore, investors should not expect an immediate significant impact from partnerships like Ford's. However, as electric vehicles still account for just 1.5% of the global fleet, revenue from services like charging has the potential to grow into a substantial category in the coming years.
The partnership between Tesla and Ford can be seen as a strategic move in the ongoing competition within the EV industry. As the industry is still in its early stages, with battles over industry standards and market dominance taking place, it is crucial for investors to closely monitor Tesla's performance.
However, it may not be the most opportune time to purchase Tesla shares, considering their 66% increase since January. The company could start to feel the effects of an economic slowdown, leading analysts to revise their expectations for earnings growth. Additionally, Tesla's inventory has been accumulating each quarter, and price cuts have significantly impacted its operating profit margin, which declined by 779 basis points year over year in the first quarter. Furthermore, the current price-to-earnings (P/E) ratio of 58 might be considered too high.
Given Tesla's stock volatility, with a beta of 2, investors may find buying opportunities in the future. It is advisable to wait for such opportunities before making a decision to invest in Tesla shares.
While the partnership between Tesla and Ford is indeed a noteworthy development in the EV industry, it is important to consider the broader market conditions and evaluate Tesla's financial performance before making any investment decisions. Keeping a close eye on the company's earnings reports, market trends, and potential growth prospects will be crucial for investors looking to capitalize on the evolving landscape of the electric vehicle market.
As the industry continues to evolve and competition intensifies, collaborations like the one between Tesla and Ford demonstrate the willingness of companies to explore innovative solutions and drive the widespread adoption of electric vehicles. This partnership could pave the way for more collaborations and advancements in the industry, ultimately benefiting consumers and contributing to a sustainable future.
However, investors should exercise caution and conduct thorough research before making any investment decisions. The dynamic nature of the electric vehicle market and the potential impact of various factors, such as government policies, technological advancements, and market demand, can significantly influence the performance of companies like Tesla.
In conclusion, the Tesla-Ford partnership marks an unexpected collaboration between two major players in the electric vehicle industry. While the specific implications and financial impact of this alliance are yet to be fully realized, it highlights the evolving nature of the market and the potential for innovative partnerships to shape the future of electric mobility. Investors should closely monitor Tesla's performance and market trends to make informed investment decisions in this dynamic and rapidly growing industry.
Fordmotorcompany
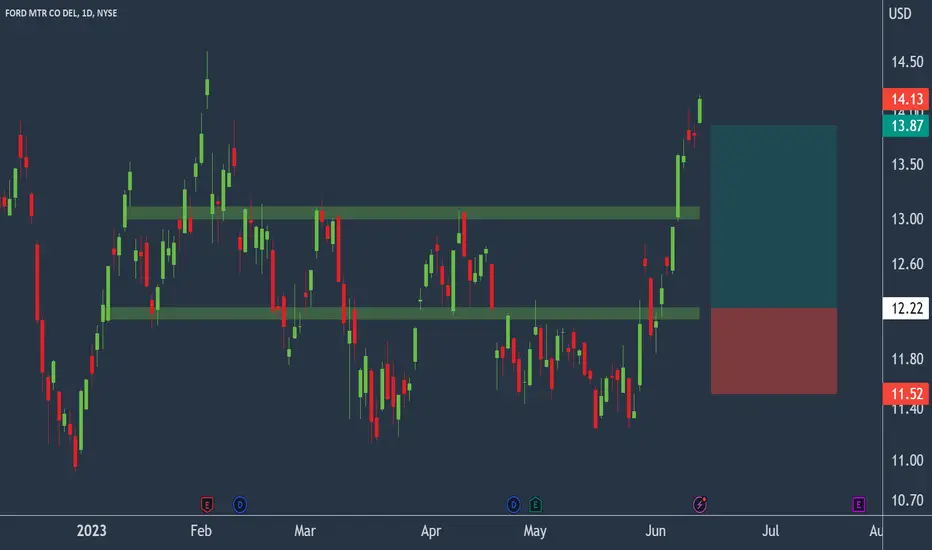
Ford to find support at previous support?Ford - 30d expiry - We look to Buy at 12.22 (stop at 11.52)
Previous support located at 12.20.
Expect trading to remain mixed and volatile.
A higher correction is expected.
We look to buy dips.
The medium term bias is neutral.
Our profit targets will be 13.87 and 14.17
Resistance: 14.17 / 14.60 / 15.00
Support: 13.60 / 13.30 / 13.00
Please be advised that the information presented on TradingView is provided to Vantage (‘Vantage Global Limited’, ‘we’) by a third-party provider (‘Signal Centre’). Please be reminded that you are solely responsible for the trading decisions on your account. There is a very high degree of risk involved in trading. Any information and/or content is intended entirely for research, educational and informational purposes only and does not constitute investment or consultation advice or investment strategy. The information is not tailored to the investment needs of any specific person and therefore does not involve a consideration of any of the investment objectives, financial situation or needs of any viewer that may receive it. Kindly also note that past performance is not a reliable indicator of future results. Actual results may differ materially from those anticipated in forward-looking or past performance statements. We assume no liability as to the accuracy or completeness of any of the information and/or content provided herein and the Company cannot be held responsible for any omission, mistake nor for any loss or damage including without limitation to any loss of profit which may arise from reliance on any information supplied by Signal Centre.
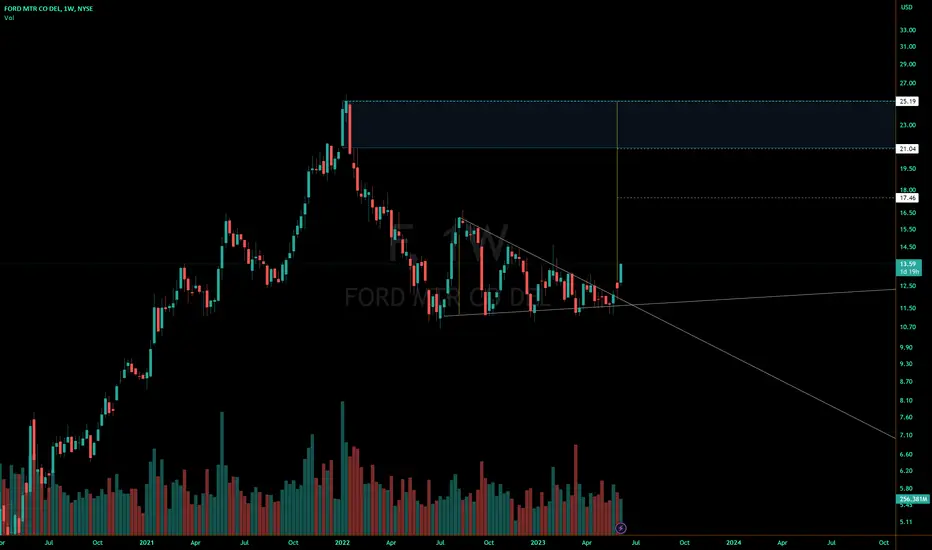
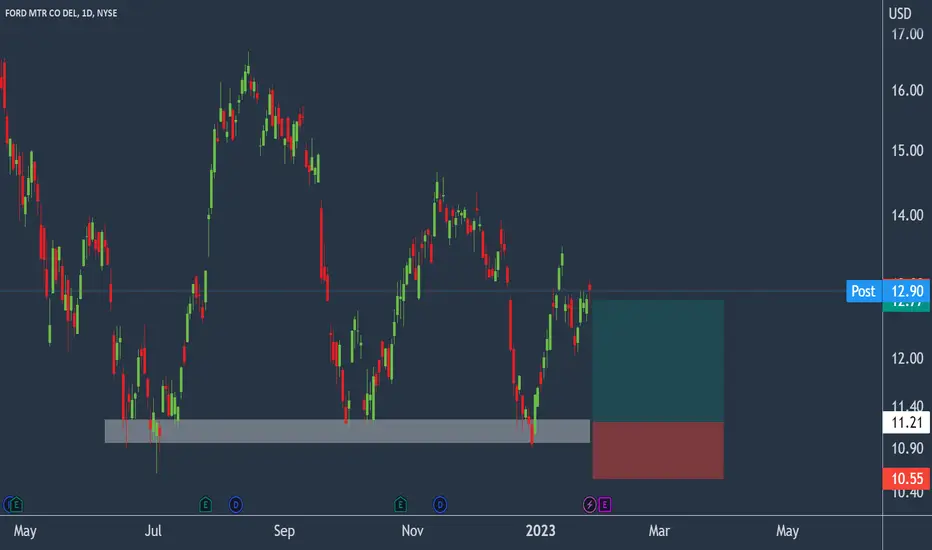
Ford Headed for a Double-TopFord recently exited a triangle at the top, and its 2x measured target lines up exactly with its previously weekly high.
It could move slightly lower than that high instead, stopping at the bottom of the blue box at its 1.5x measured target.
Long until it reaches its 1.5 or 2x measured move, then short.
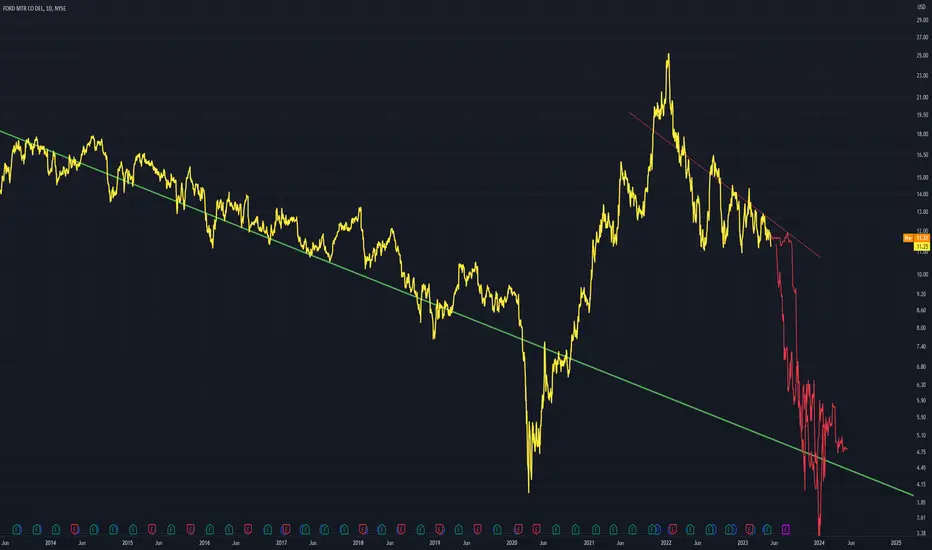
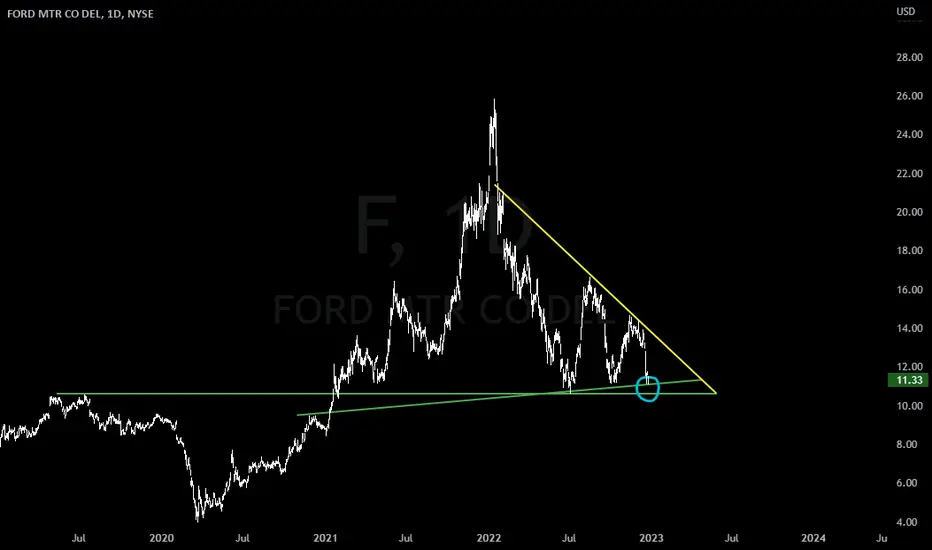
F - Drop To Above Trend Line Price is currently in a downtrend and looking to move further down.
I suggest that price hits this strong trend line that I have drawn, as it has done in the past.
Bars pattern shows my thoughts
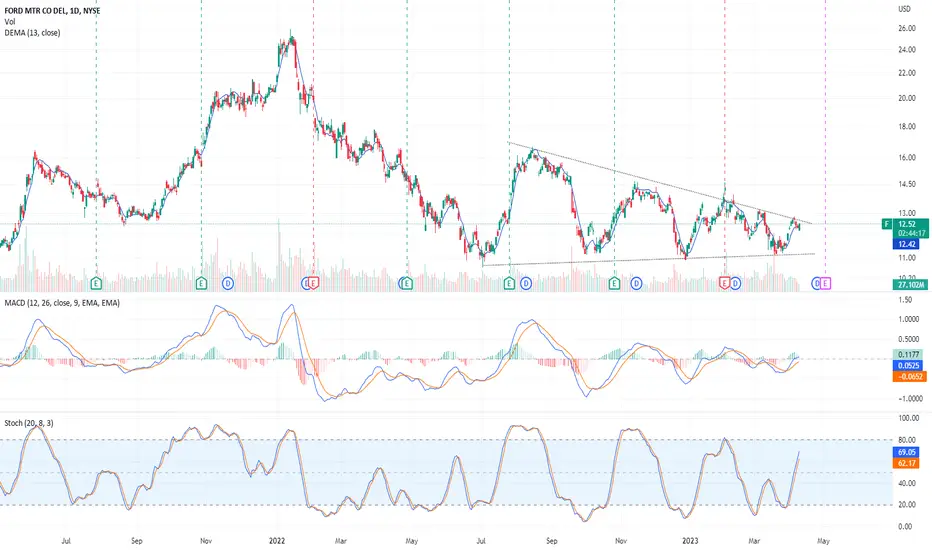
F Surprised on Earnings Ready for Rising PriceFORD ( F) significantly surprised on earnings no matter that a recession may be underway and
no matter its balance sheet is saddled with debt which is increasingly more expensive to
services. Pre-orders for the Lightning F -150 are strong. On the 2H chart, price has yet to
react to the earnings surprise. Volume has picked up but nothing dramatic. The zero-lag
MACD lines have crossed under the histogram and are now crossing over the zero line.
Price in a sign of strength rose out of its Fibonacci band channel and is just below the
anchored mean VWAP while at the uppermost portion of the high volume area of the volume
profile. I see this as a good place to take a long position targettting $ 12.80 to 13.00
with a stop loss at $ 11.80 below the POC line of the volume profile.

Ford dips below $11 continues to attract buyers.Ford - 30d expiry - We look to Buy at 11.15 (stop at 10.55)
Levels below 11 continue to attract buyers.
11 continues to hold back the bears.
We look to buy dips.
With signals for sentiment at oversold extremes, the dip could not be extended.
Early pessimism is likely to lead to losses although extended attempts lower are expected to fail.
Our profit targets will be 12.77 and 13.07
Resistance: 11.95 / 12.50 / 13.15
Support: 11.44 / 11.00 / 10.61
Please be advised that the information presented on TradingView is provided to Vantage (‘Vantage Global Limited’, ‘we’) by a third-party provider (‘Signal Centre’). Please be reminded that you are solely responsible for the trading decisions on your account. There is a very high degree of risk involved in trading. Any information and/or content is intended entirely for research, educational and informational purposes only and does not constitute investment or consultation advice or investment strategy. The information is not tailored to the investment needs of any specific person and therefore does not involve a consideration of any of the investment objectives, financial situation or needs of any viewer that may receive it. Kindly also note that past performance is not a reliable indicator of future results. Actual results may differ materially from those anticipated in forward-looking or past performance statements. We assume no liability as to the accuracy or completeness of any of the information and/or content provided herein and the Company cannot be held responsible for any omission, mistake nor for any loss or damage including without limitation to any loss of profit which may arise from reliance on any information supplied by Signal Centre.

FORD text book flag at bottomwe know how to play this, all we need is a bit of patience...
breaks the flag up and we go all in
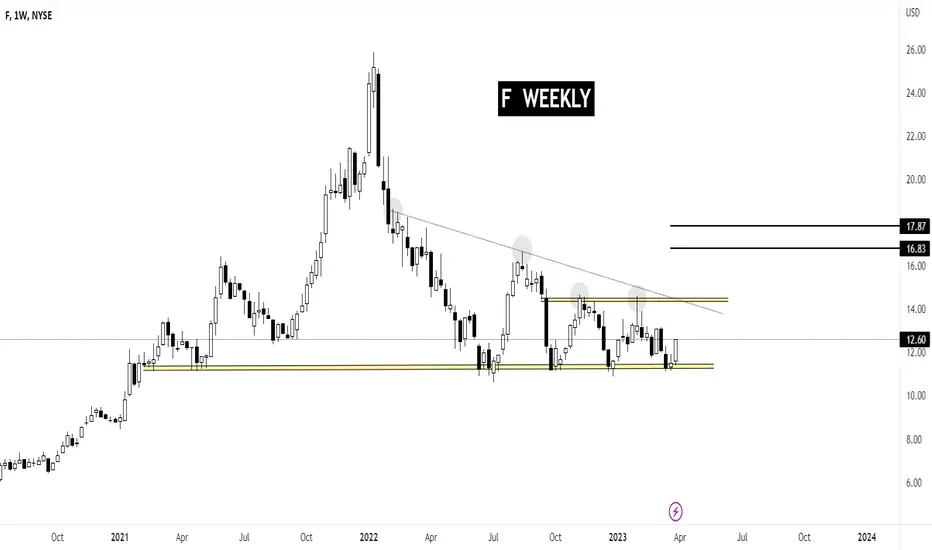
F - FORD MOTORSNYSE:F Price maintian its horizantal support since FEB21
TRADE PLAN 1) BUY: AROUND 11.50/10.88
SL: CLOSING BELOW 10.50
TP: 14.25/14.50 (23%)
TRADE PLAN 2)BUY: WHEN THE PRICE CLOSE ABOVE 14.50
SL: CLOSE BELOW 14
TP1:16.83 (16%)
TP2:17.87 (22%)
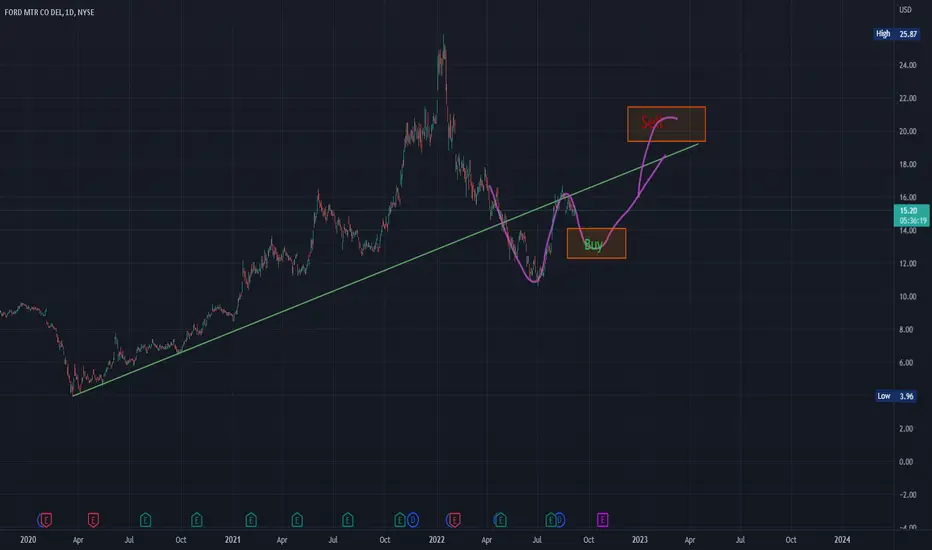
Ford to try for $14.50 breakout End of AprilI've been watching Ford since July of 21 where I made the call that it would climb to $20 by January of '22.
Looking at this chart again, and just being bullish on Ford anyway, it's set to run back up to $14.50 by the beginning of May, and may even try to spike higher.
With their advancements in EV and continually staying on top of the market, I believe that we'll see this stock climb once again.
I placed an order for a Buy to open 1 F 5/5/2023 13.00 C @ Market, Day
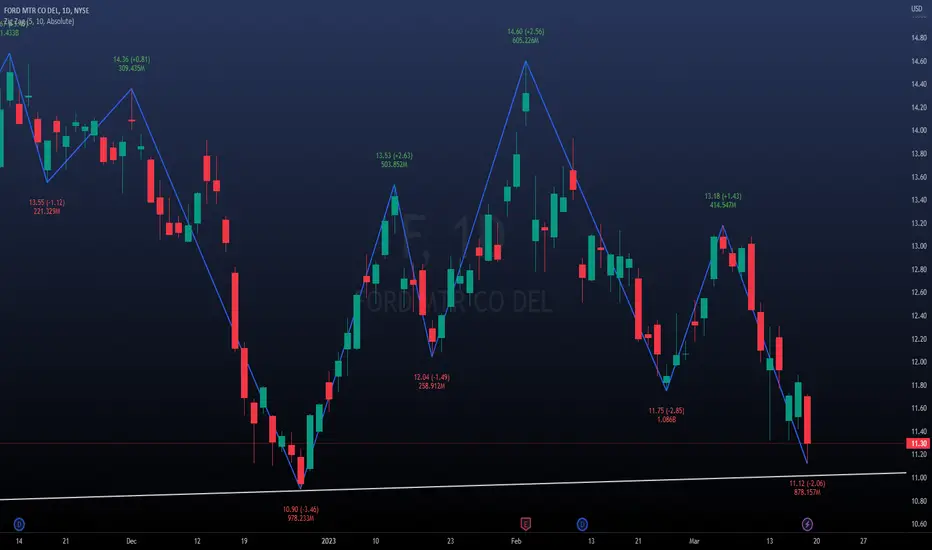
Will Ford selloff stall at swing lows?Ford - 30d expiry - We look to Buy at 11.21 (stop at 10.55)
Levels below 11 continue to attract buyers.
11 continues to hold back the bears.
We look to buy dips.
With signals for sentiment at oversold extremes, the dip could not be extended.
Early pessimism is likely to lead to losses although extended attempts lower are expected to fail.
Our profit targets will be 12.77 and 13.07
Resistance: 11.95 / 12.50 / 13.15
Support: 11.35 / 11.00 / 10.61
Please be advised that the information presented on TradingView is provided to Vantage (‘Vantage Global Limited’, ‘we’) by a third-party provider (‘Signal Centre’). Please be reminded that you are solely responsible for the trading decisions on your account. There is a very high degree of risk involved in trading. Any information and/or content is intended entirely for research, educational and informational purposes only and does not constitute investment or consultation advice or investment strategy. The information is not tailored to the investment needs of any specific person and therefore does not involve a consideration of any of the investment objectives, financial situation or needs of any viewer that may receive it. Kindly also note that past performance is not a reliable indicator of future results. Actual results may differ materially from those anticipated in forward-looking or past performance statements. We assume no liability as to the accuracy or completeness of any of the information and/or content provided herein and the Company cannot be held responsible for any omission, mistake nor for any loss or damage including without limitation to any loss of profit which may arise from reliance on any information supplied by Signal Centre.

Ford potential H&S setup?Ford could be about looks like a H&S setup could be in the making on F a break below the neckline would confirm
Fall FORD? Ford is currently sitting below a weaker support zone showing weak buying momentum back into the area of support which could possibly be indicating a retest of the support to continue its overall down trend.

F Ford Motor Options Ahead of EarningsFord follows Tesla’s example and cuts price on Mustang Mach-E from as little as $600 to as large as $6,000. Most notable are the cuts to the Premium eAWD Standard range model, which takes it to $53,999 from $57,676.
Looking at the F Ford Motor options chain ahead of earnings , I would buy the $13.5 strike price Calls with
2023-2-3 expiration date for about
$0.21 premium.
If the options turn out to be profitable Before the earnings release, I would sell at least 50%.
Looking forward to read your opinion about it.

Ford levels below 11 continue to attract.Ford - 30d expiry - We look to Buy at 11.21 (stop at 10.55)
Levels below 11 continue to attract buyers.
A lower correction is expected.
We look to buy dips.
We are trading at oversold extremes.
Early pessimism is likely to lead to losses although extended attempts lower are expected to fail.
Our profit targets will be 12.77 and 13.07
Resistance: 13.50 / 14.00 / 14.60
Support: 12.50 / 12.00 / 11.00
Please be advised that the information presented on TradingView is provided to Vantage (‘Vantage Global Limited’, ‘we’) by a third-party provider (‘Signal Centre’). Please be reminded that you are solely responsible for the trading decisions on your account. There is a very high degree of risk involved in trading. Any information and/or content is intended entirely for research, educational and informational purposes only and does not constitute investment or consultation advice or investment strategy. The information is not tailored to the investment needs of any specific person and therefore does not involve a consideration of any of the investment objectives, financial situation or needs of any viewer that may receive it. Kindly also note that past performance is not a reliable indicator of future results. Actual results may differ materially from those anticipated in forward-looking or past performance statements. We assume no liability as to the accuracy or completeness of any of the information and/or content provided herein and the Company cannot be held responsible for any omission, mistake nor for any loss or damage including without limitation to any loss of profit which may arise from reliance on any information supplied by Signal Centre.

Ford: Strong Possibility for a Bounce!Here we are looking at Ford on the daily TF.
As shown on the chart, we are analyzing two supports (which have confluence with one another) which both connect to our downwards sloping resistance (yellow).
It’s important to note that both support lines were previously resistance, but have both served as strong support since Fords breakout (to the upside) in January of 2021.
Currently, Ford finds itself testing support (blue circle). We expect for these two support lines to act as strong support, though we’re ready for a breakdown if it can’t hold.
We will continue to monitor price action, and will follow up on this post when there’s either a bounce or breakdown.
Do you think Ford will hold its supports?
Cheers!
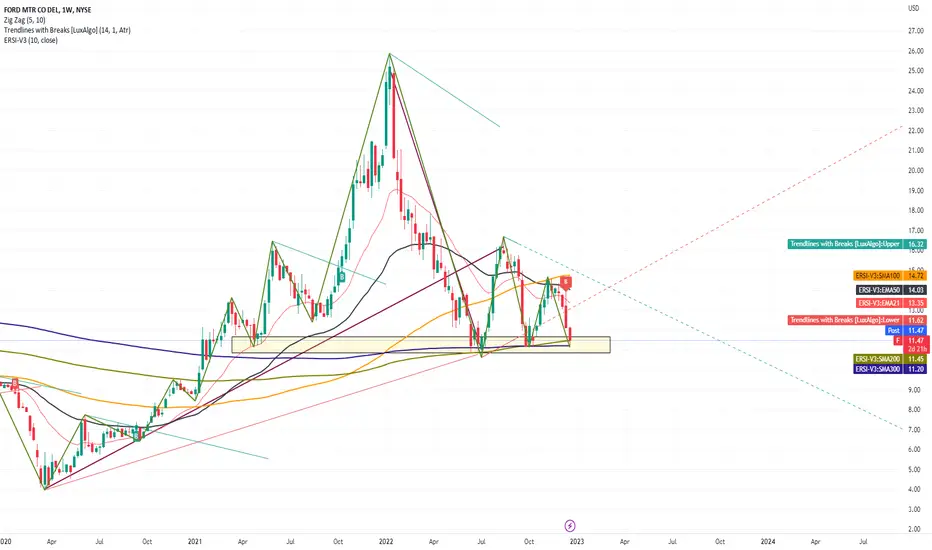
Ford is sitting on multiple supportFord is in critical situation sitting on both 50 EMA and 100 SMA in weekly time frame. There is clear support below this moving average lines
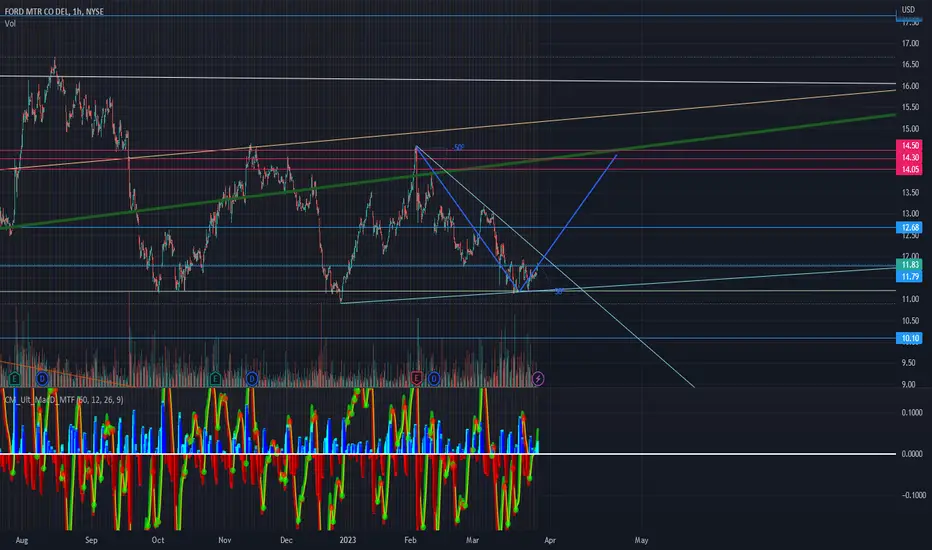
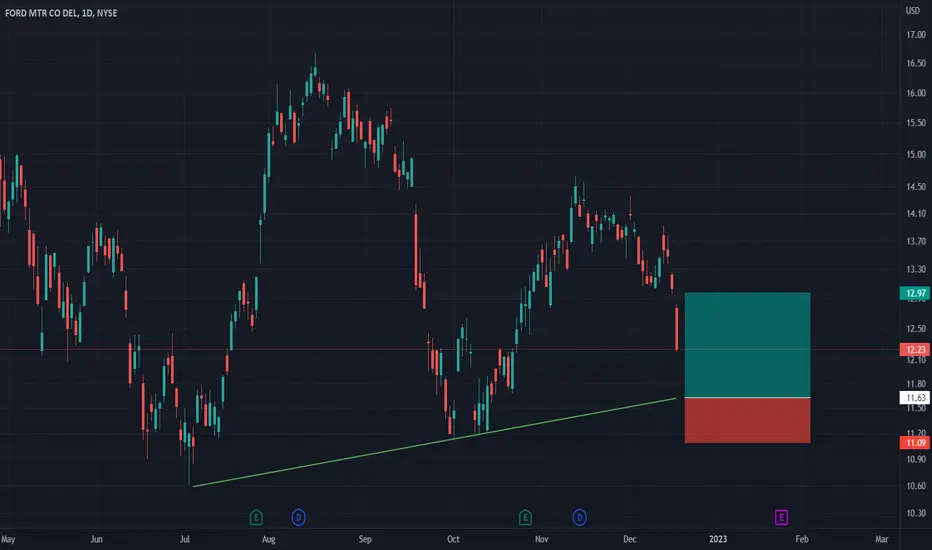
Ford to find support at trend line?Ford - 30d expiry - We look to Buy at 11.63 (stop at 11.09)
Short term momentum is bearish.
The trend of higher lows is located at 11.60.
We expect prices to stall close to our bespoke level (11.60).
Trading has been mixed and volatile.
The previous swing low is located at 11.13.
We look for a temporary move lower.
Our profit targets will be 12.97 and 13.27
Resistance: 12.50 / 13.00 / 13.50
Support: 12.00 / 11.70 / 11.20
Disclaimer – Saxo Bank Group.
Please be reminded – you alone are responsible for your trading – both gains and losses. There is a very high degree of risk involved in trading. The technical analysis , like any and all indicators, strategies, columns, articles and other features accessible on/though this site (including those from Signal Centre) are for informational purposes only and should not be construed as investment advice by you. Such technical analysis are believed to be obtained from sources believed to be reliable, but not warrant their respective completeness or accuracy, or warrant any results from the use of the information. Your use of the technical analysis , as would also your use of any and all mentioned indicators, strategies, columns, articles and all other features, is entirely at your own risk and it is your sole responsibility to evaluate the accuracy, completeness and usefulness (including suitability) of the information. You should assess the risk of any trade with your financial adviser and make your own independent decision(s) regarding any tradable products which may be the subject matter of the technical analysis or any of the said indicators, strategies, columns, articles and all other features.
Please also be reminded that if despite the above, any of the said technical analysis (or any of the said indicators, strategies, columns, articles and other features accessible on/through this site) is found to be advisory or a recommendation; and not merely informational in nature, the same is in any event provided with the intention of being for general circulation and availability only. As such it is not intended to and does not form part of any offer or recommendation directed at you specifically, or have any regard to the investment objectives, financial situation or needs of yourself or any other specific person. Before committing to a trade or investment therefore, please seek advice from a financial or other professional adviser regarding the suitability of the product for you and (where available) read the relevant product offer/description documents, including the risk disclosures. If you do not wish to seek such financial advice, please still exercise your mind and consider carefully whether the product is suitable for you because you alone remain responsible for your trading – both gains and losses.
$F $GM and the rest. $SPYI was thinking on my previous idea of a correction for the market and I went to the "cars" charts. The same here for this companies. a correction with the chance of a melt down for this sector. $SPY $F $GM
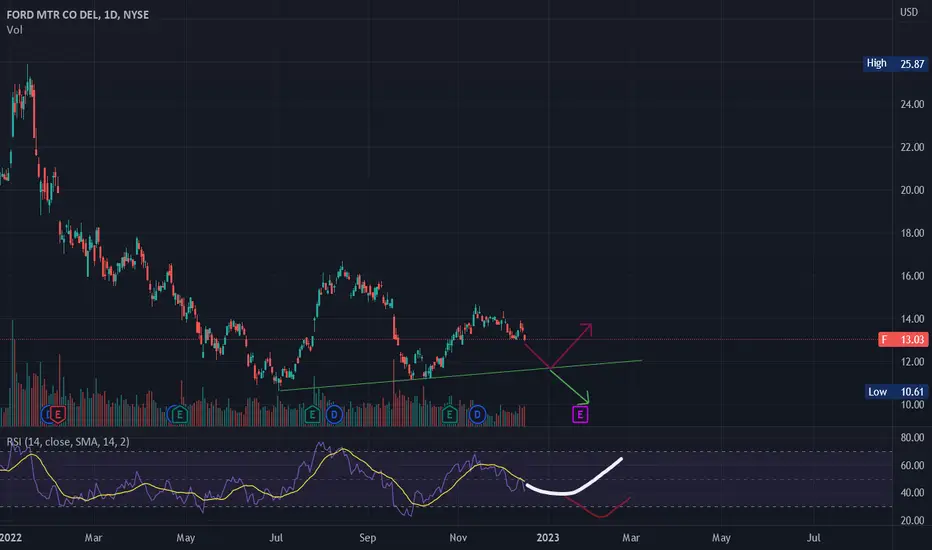
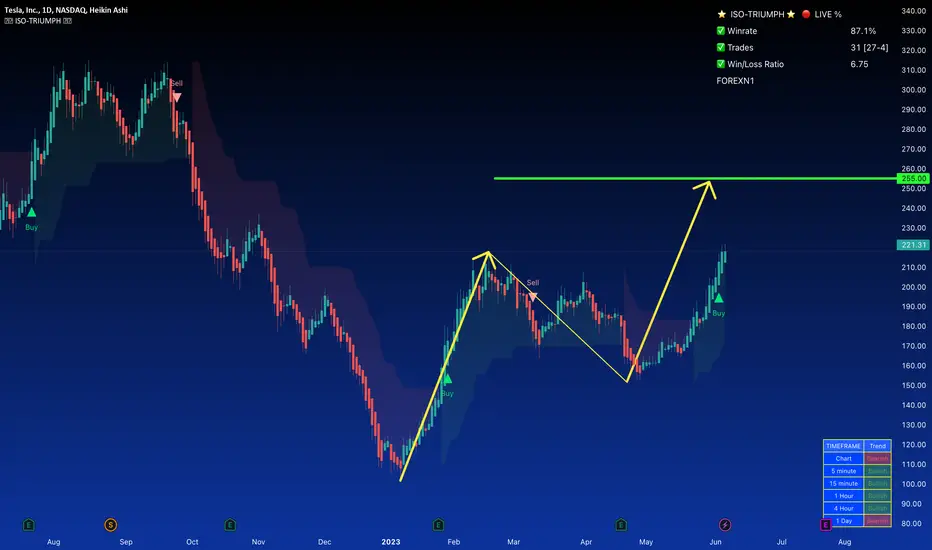
FordAccording to my analysis, For a long time frame trend has been bullish, But I think we are approaching the end of the bullish trend. For a short time frame
It is apparent in the picture. So my opinion is that first, the price should be correct, and there is a buying position, then the price goes up after the price reaches the specified selling zone should recheck the chart.
To notify the analysis, follow me and contact me if you have any comments or questions.
Observe the money management and the stop loss.
F longFord Motors Company Long position
I think Ford's stock may still gain value.
My trade levels
Entry: $14.30
Take profit: $15.80
Stop loss: $13.63
Risk/reward: 2.24

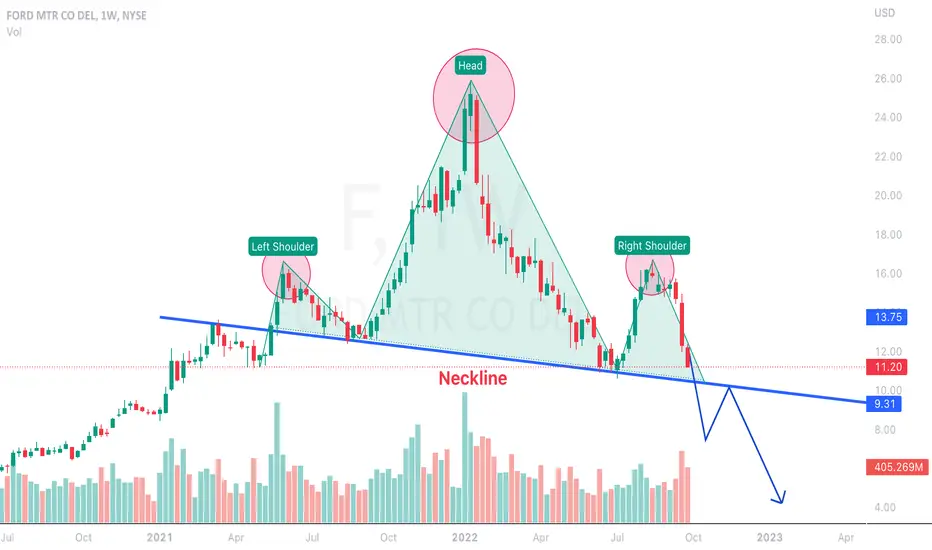
Ford about to drive off a cliff?Much like many other stocks on the broader stock market we see some large bearish patterns just looming over the heads of investors. There is no certainty most of these will play out, we all know th FED and pivot any moment and that will cause a large squeeze in the market. However, in the meantime we see what looks to be a large Head & Shoulders on Ford that is sitting on the edge. If the patterns plays out we could see prices as low as $5 in the longer term or below $9 in the short term. Will be monitoring this one closely.

F MASSIVE BEARISH HEAD AND SHOULDERS (SELL) $$$A head and shoulders pattern is a bearish reversal pattern that indicates that the uptrend has reached its top and that the reversal has begun. As you can see from the weekly chart, this head and shoulders pattern suggests a very negative price action in the following weeks until F finds firm support and bounces off to bullish territory