U.S. Dollar Index (DXY) – Pro Analysis | 1H Chart |1. Strong Bullish Momentum
DXY broke out sharply above the 99.41 resistance, showing clear strength from bulls with minimal pullbacks during the rally.
2. Short-Term Rejection at Supply
Price was rejected from the 99.978 zone — a key supply area. This indicates the presence of active sellers near the psychological 100 level.
3. Retesting Breakout Structure
Currently hovering just above 99.669, the DXY is retesting the previous breakout level. This could act as short-term support if bullish momentum resumes.
4. Next Key Zones
Resistance: 99.978 → 100.534
Support: 99.411 → 98.92
Break below 99.411 may invalidate the breakout.
5. Outlook
Bias remains bullish above 99.41. However, failure to reclaim 99.978 soon may signal temporary exhaustion or consolidation before next leg up.
Forerx

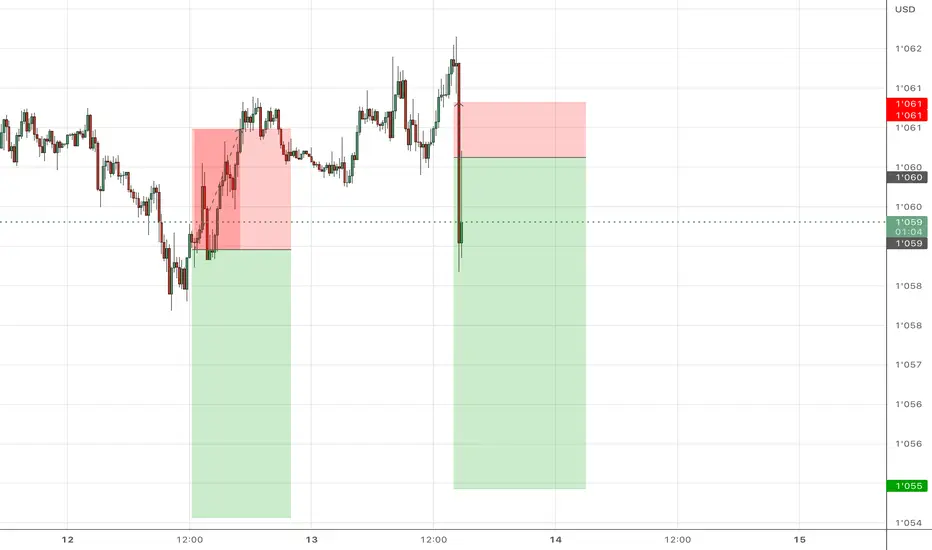
EURUSD BUYThe US Dollar (USD) gapped lower at the weekly opening amid optimism fueling demand for high-yielding assets, following news that the United States (US) and the European Union (EU) reached a trade deal.
The US and the EU agreed a 15% tariff on most European goods entering the US, much higher than the average 4.8% exporters face these days. No rates will apply to EU exports in important sectors, including aircraft parts, some chemicals, semiconductor equipment and some agricultural products.
The EU response to the headline was uneven. European Central Bank (ECB) policymaker Peter Kazimir said on Monday that the trade deal reduces uncertainty, but it is unclear for now how it impacts inflation. However, the French prime minister, François Bayrou, said the EU has capitulated to Donald Trump’s threats, adding it is a “dark day” for the EU. The trade focus now shifts to the US-China as officials from both countries resume talks in Stockholm.
The EUR/USD pair peaked at 1.1771 during Asian trading hours, but changed course early in Europe, with the USD surging across the FX board, resulting in the pair shedding over 100 pips.
The macroeconomic calendar had nothing relevant to offer at the beginning of the week, but will be flooded with first-tier releases, including US employment-related data ahead of the Nonfarm Payrolls report on Friday, the preliminary estimates of the Q2 Gross Domestic Product (GDP) for the US and the EU, and inflation updates. On top of that, the Federal Reserve (Fed) will announce its decision on monetary policy on Wednesday.
RESISTANCE 1.16050
RESISTANCE 1.16243
RESISTANCE 1.16451
SUPPORT 1.15856
SUPPORT 1.15711

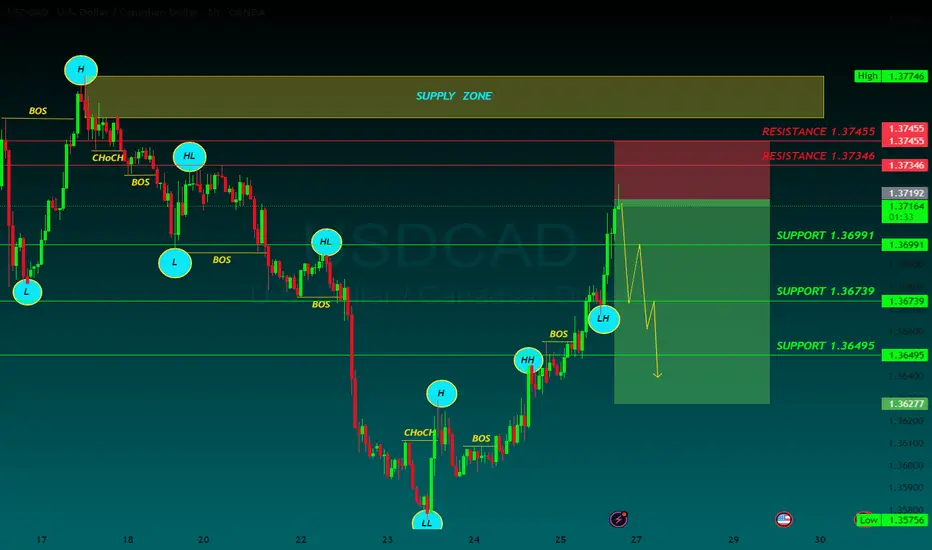
USDCAD SELLUSD/CAD rallies to 1.3680 as the market focuses on a hawkish Fed
The US Dollar extends its recovery for the second consecutive day, supported by strong US data. Upbeat US business activity and Jobless Claims support the Fed's "wait and see" rhetoric. In Canada, the weak Retail Sales data keep hopes for a BoC rate cut alive.
The year will be politically marked by Trump’s return to the White House. A Republican government is seen as positive for financial markets, but Trump’s pledge to cut taxes and impose tariffs on foreign goods and services may introduce uncertainty to both the political and economic landscape.
Canada’s political crisis peaked in late 2024 with a no-confidence vote against Prime Minister Justin Trudeau, leading to snap elections and a weakened Liberal minority government. Policy uncertainty and economic challenges dominate 2025’s outlook, raising concerns over market stability and investor confidence.
The BoC is set to continue easing interest rates through 2025, at least at a faster pace than the Fed is expected to, which could apply pressure on CAD’s already-rising rate differential.
SUPPORT 1.36991
SUPPORT 1.36739
SUPPORT 1.36495
RESISTANCE 1.37346
RESISTANCE 1.37455
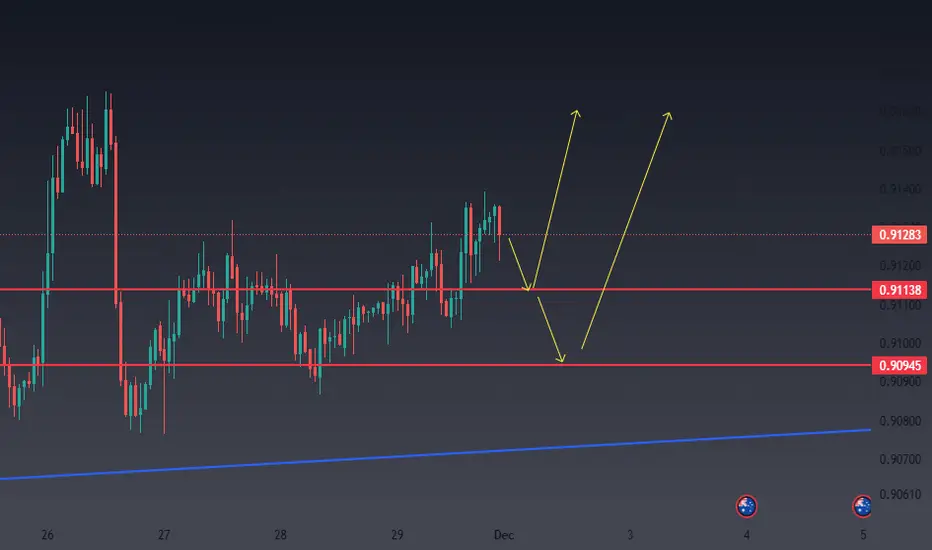
aud/cadThe chart trend on the daily timeframe is bullish. Considering the weekly candlestick pattern, which forms a doji, there is a clear struggle between buyers and sellers. However, since the overall trend is upward, a buy position can be initiated on the 1-hour timeframe around the 0.91138 level, with proper stop-loss management.
This analysis is brought to you by the FXonbit Traders Team
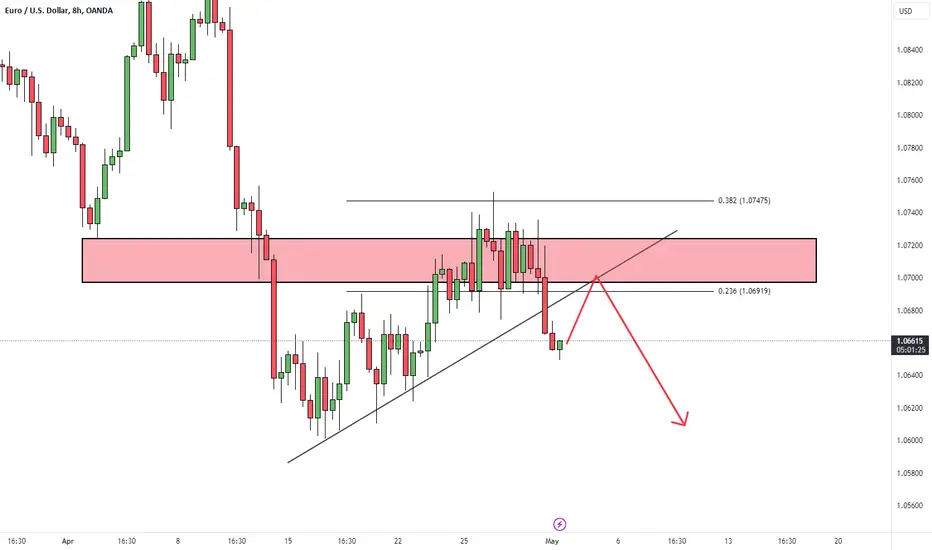
EURUSDHello traders ,what do you think about EURUSD? This currency pair has broken its trend line and is below the resistance zone. It is expected to fall at least to the specified level after the pullback to the broken zone
If this post was useful to you, do not forget to like and comment.❤️
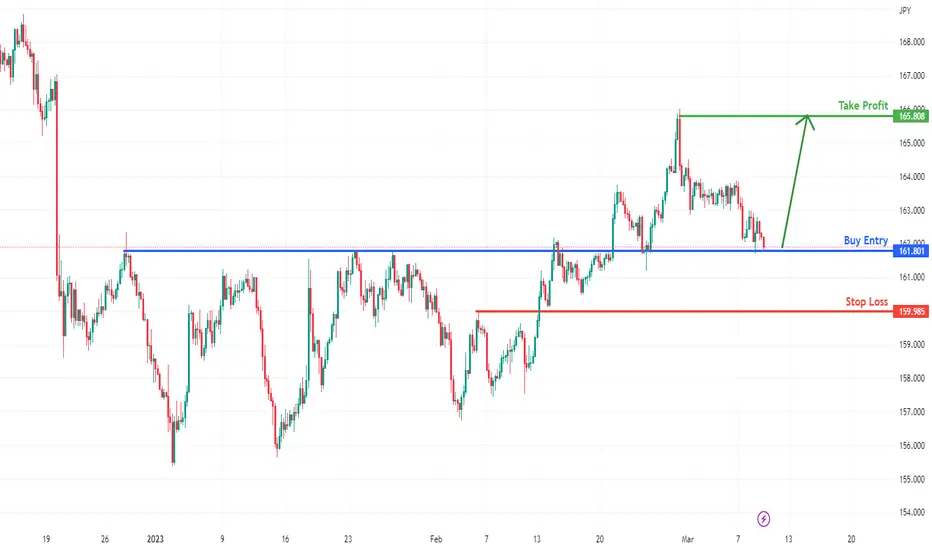
GBPJPYNew week new start.
So here is my outlook on GJ, Cannot be more simplified.
Looking forward to get a 4+ Reward.
Trade safe
Cheers
Europeanbulls
GBPJPY H4 | 9th Match Looking at the H4 chart, the price is currently at our buy entry of 161.80, which overlaps with the support level. If the price were to reverse from this level, it could potentially push up to our take profit of 165.80, which is our recent swing high. Our stop loss will be 159.98.
Any opinions, news, research, analyses, prices, other information, or links to third-party sites contained on this website are provided on an "as-is" basis, as general market commentary, and do not constitute investment advice. The market commentary has not been prepared in accordance with legal requirements designed to promote the independence of investment research, and it is therefore not subject to any prohibition on dealing ahead of dissemination. Although this commentary is not produced by an independent source, FXCM takes all sufficient steps to eliminate or prevent any conflicts of interest arising out of the production and dissemination of this communication. The employees of FXCM commit to acting in the clients' best interests and represent their views without misleading, deceiving, or otherwise impairing the clients' ability to make informed investment decisions. For more information about the FXCM's internal organizational and administrative arrangements for the prevention of conflicts, please refer to the Firms' Managing Conflicts Policy. Please ensure that you read and understand our Full Disclaimer and Liability provision concerning the foregoing Information, which can be accessed on the website.
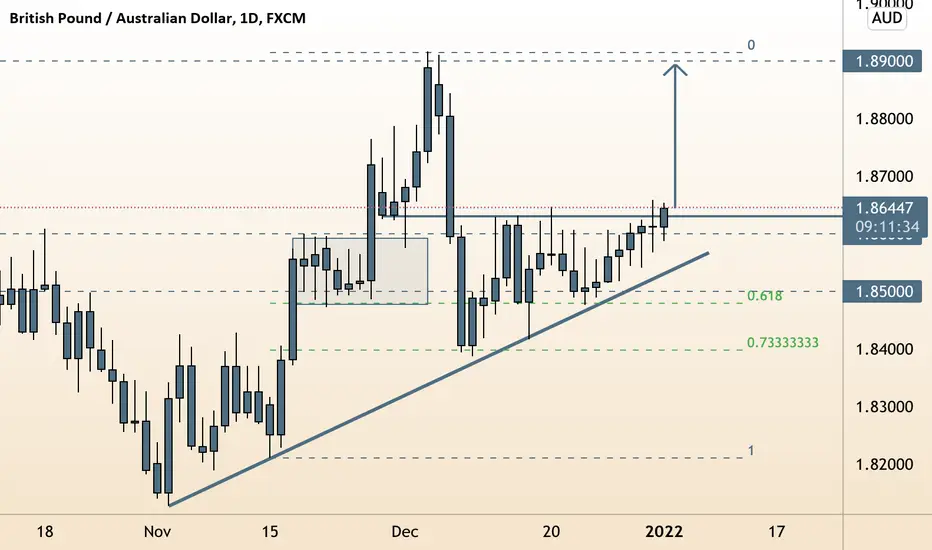
GBPAUD | Mini-Technical Trend BreakSpotted an opportunity here for those looking to take on both the risk politically between these two pairs and also pay the spread. Upside weekly target shown with arrow.
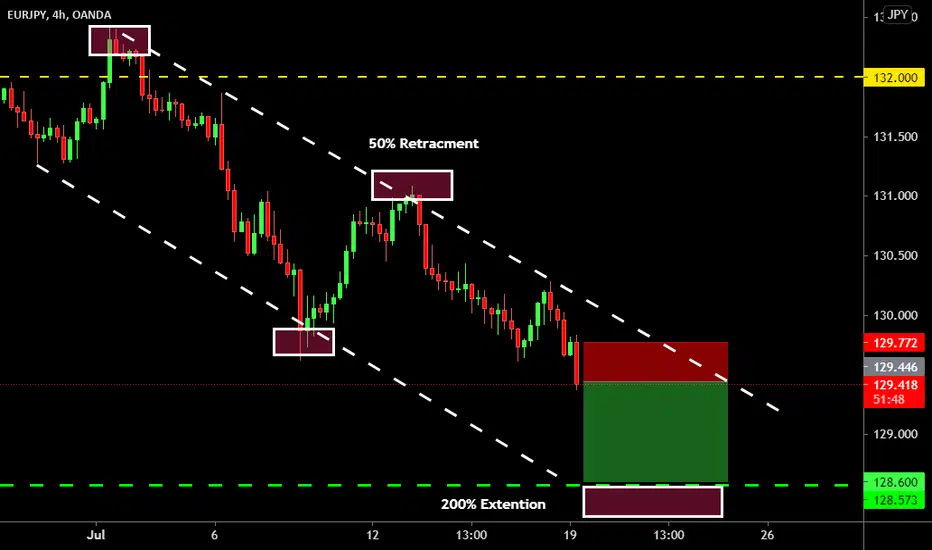
EUR/JPY analisys and price outlookHello friends ... we have eurjpy in a bearish price channel
And most likely our first target is the bottom of the price channel!
Key Levels:
132.00
131.50
131.00
129.82
129.50
129.00
128.50

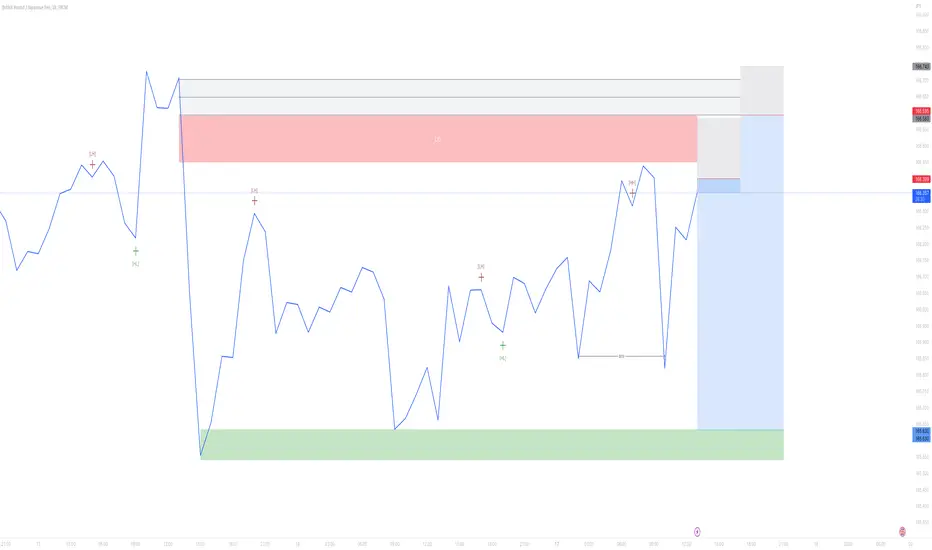
GBPJPY Trade Idea (3rd Feruray 2020)Currency Pair: GBPJPY
Timeframe: H1
Date/Time of Signal: 3rd February 2020 / 1600hrs (SGT)
Review:
The Pound recently declined amid fears of hard Brexit (renew fears of no-deal Brexit) while the safe-haven currency such as US Dollar and Yen demand continues due to the Coronavirus.
For the month of January, GBPJPY have been ranging between 141.00 and 1.44.00.
Following the trend, trade signaled to sell GBPJPY (Entry: 142.65) with 3 Take Profit (TP) Targets (TP1: 142.45, TP2: 142.25, TP3: 142.05) and Stop Loss (SL) at 142.95.
