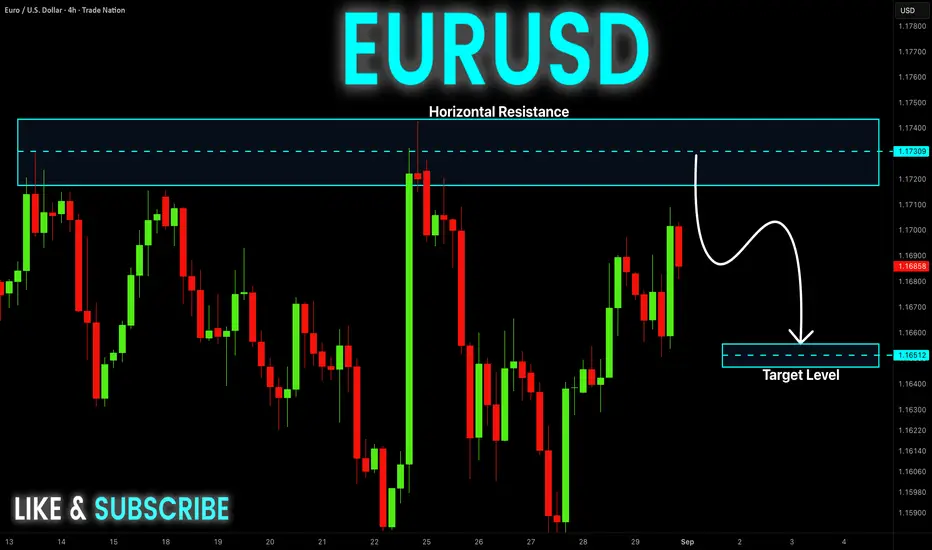
EUR-USD Bearish Bias! Sell!
Hello,Traders!
EUR-USD keeps growing
But a horizontal resistance
Level of 1.1740 is nearby
So after the retest of the
Level we will be expecting
A local bearish correction
On Monday!
Sell!
Comment and subscribe to help us grow!
Check out other forecasts below too!
Disclosure: I am part of Trade Nation's Influencer program and receive a monthly fee for using their TradingView charts in my analysis.
Forex-trading
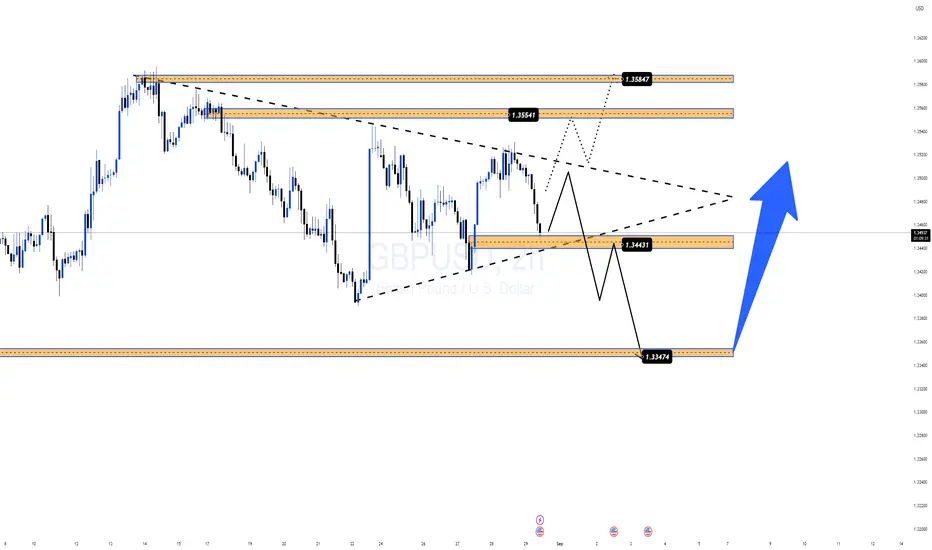
GBPUSD – PCE Data Could Set the Breakout🔹 Market Context
Traders are waiting for the US PCE Price Index today.
Forecasts suggest the data will likely be unchanged from the previous month, which could give the USD slight strength in the short term.
GBPUSD is now trading inside a symmetrical triangle, and PCE may act as the catalyst for the breakout.
🔹 Technical Outlook (H2 Chart)
Support zone: 1.3430 – 1.3450 (demand + trendline confluence).
Next key support: 1.3340 – 1.3350.
Resistance zones: 1.3550 – 1.3580 and 1.3660.
Scenarios to Watch:
1️⃣ Bullish Setup
If price holds above 1.3430 – 1.3450 and breaks the triangle resistance →
Targets: 1.3550 – 1.3580, then 1.3660 if momentum continues.
2️⃣ Bearish Setup
If PCE data boosts USD and GBPUSD breaks below 1.3430,
Downside targets: 1.3340, with extension toward 1.3300.
🔹 Trading Plan (reference only)
Buy Zone: 1.3430 – 1.3450
SL: 1.3400
TP: 1.3550 – 1.3580 → 1.3660
Sell Zone: break below 1.3430
SL: 1.3480
TP: 1.3340 → 1.3300
✅ Summary: GBPUSD is at a make-or-break level. The 1.3430 pivot zone is the key to watch ahead of PCE. A bounce from here favors bulls toward 1.3550+, while a breakdown could trigger a deeper move into 1.3340.
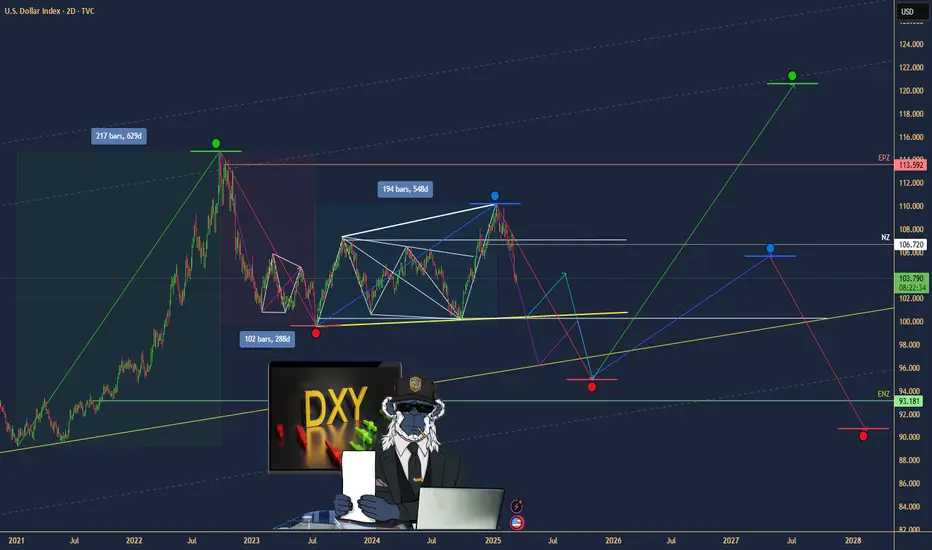
$DXY: Dollar Strength or Dollar Dip?(1/9)
Good afternoon, everyone! 🌞 DXY: Dollar Strength or Dollar Dip?
With the DXY at 103.732, is the dollar flexing its muscles or ready to stumble? Let’s break it down! 🔍
(2/9) – PRICE PERFORMANCE 📊
• Current Price: 103.732 as of Mar 14, 2025 💰
• Recent Move: Near recent levels, down from 110.18 peak (web data) 📏
• Sector Trend: Forex markets volatile, with trade and policy shifts 🌟
It’s a wild ride—dollar’s dancing on the edge! ⚙️
(3/9) – MARKET POSITION 📈
• Role: Measures USD vs. euro, yen, pound, and more 🏆
• Influence: Drives forex and commodity prices globally ⏰
• Trend: Balancing U.S. policy and global demand, per data 🎯
King of currencies, but not without challengers! 🚀
(4/9) – KEY DEVELOPMENTS 🔑
• Trade Tensions: U.S.-China tariff talks ongoing, per data 🌍
• Rate Cut Bets: Markets eyeing Fed moves, per posts on X 📋
• Market Reaction: Holding steady at 103.732 amid mixed signals 💡
Navigating a storm of global pressures! 🛳️
(5/9) – RISKS IN FOCUS ⚡
• Rate Cuts: Could weaken dollar if Fed acts, per X sentiment 🔍
• Trade Wars: Tariffs disrupting supply chains, per data 📉
• Global Growth: Slowdowns hitting demand for USD ❄️
It’s a tightrope—risks aplenty! 🛑
(6/9) – SWOT: STRENGTHS 💪
• Reserve Status: USD’s global dominance holds firm 🥇
• U.S. Economy: Still a powerhouse, supporting dollar value 📊
• Safe Haven: Attracts flows in uncertain times, per trends 🔧
Got muscle to flex when it counts! 🏦
(7/9) – SWOT: WEAKNESSES & OPPORTUNITIES ⚖️
• Weaknesses: Vulnerable to rate cuts, trade spats 📉
• Opportunities: Strong U.S. data could lift it higher, per outlook 📈
Can it hold the line or break out? 🤔
(8/9) – POLL TIME! 📢
DXY at 103.732—your take? 🗳️
• Bullish: 105+ soon, dollar rallies 🐂
• Neutral: Steady, risks balance out ⚖️
• Bearish: 100 looms, dollar dips 🐻
Chime in below! 👇
(9/9) – FINAL TAKEAWAY 🎯
The DXY’s 103.732 shows it’s steady but tested 📈. Trade wars and Fed moves could swing it either way—dips are our DCA gold 💰. Buy low, ride high—time’s the key! Gem or bust?
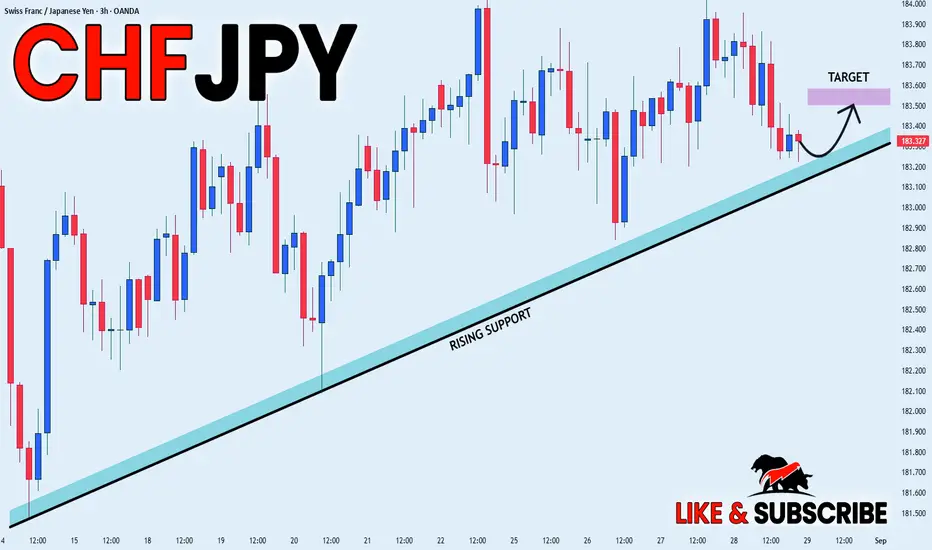
CHF_JPY RISING SUPPORT AHEAD|LONG|
✅CHF_JPY is trading along the rising support
And as the pair will soon retest it
I am expecting the price to go up
To retest the supply levels above at 183.520
LONG🚀
✅Like and subscribe to never miss a new idea!✅
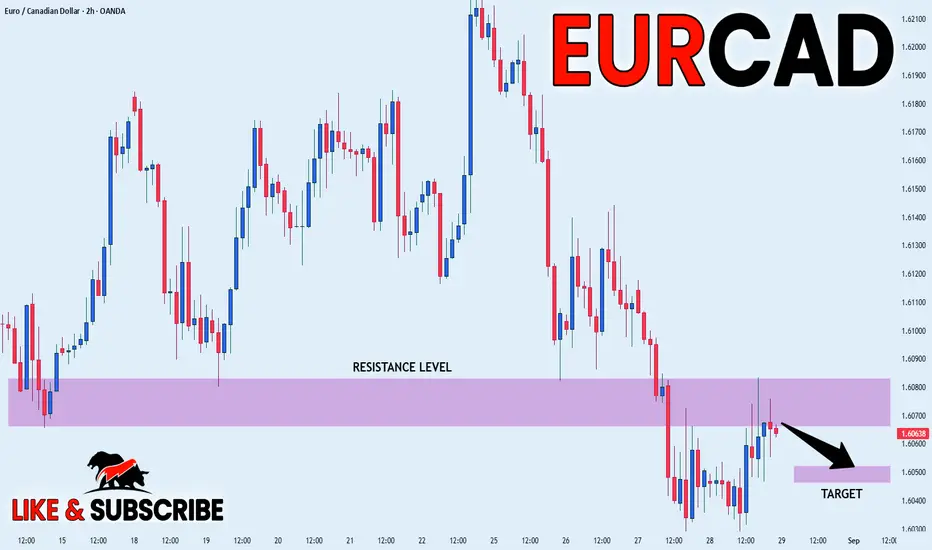
EUR_CAD LOCAL SHORT|
✅EUR_CAD went up sharply
But a strong resistance level was hit at 1.6080
Thus I am expecting a pullback
And a move down towards the target of 1.6040
SHORT🔥
✅Like and subscribe to never miss a new idea!✅
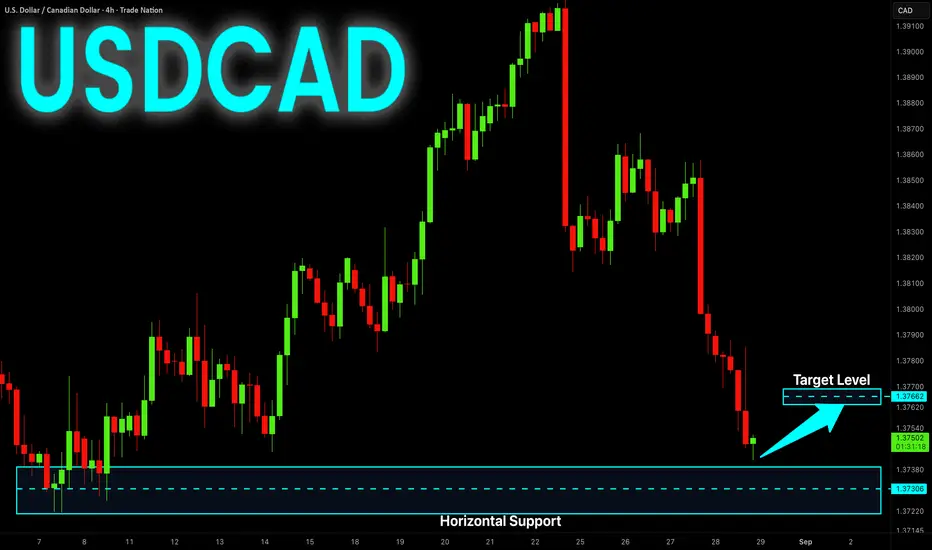
USD-CAD Support Ahead! Buy!
Hello,Traders!
USD-CAD keeps falling down
In a strong local downtrend
And the pair is locally oversold
So after the pair hits the
Horizontal support of 1.3730
A local bullish correction
Is to be expected
Buy!
Comment and subscribe to help us grow!
Check out other forecasts below too!
Disclosure: I am part of Trade Nation's Influencer program and receive a monthly fee for using their TradingView charts in my analysis.
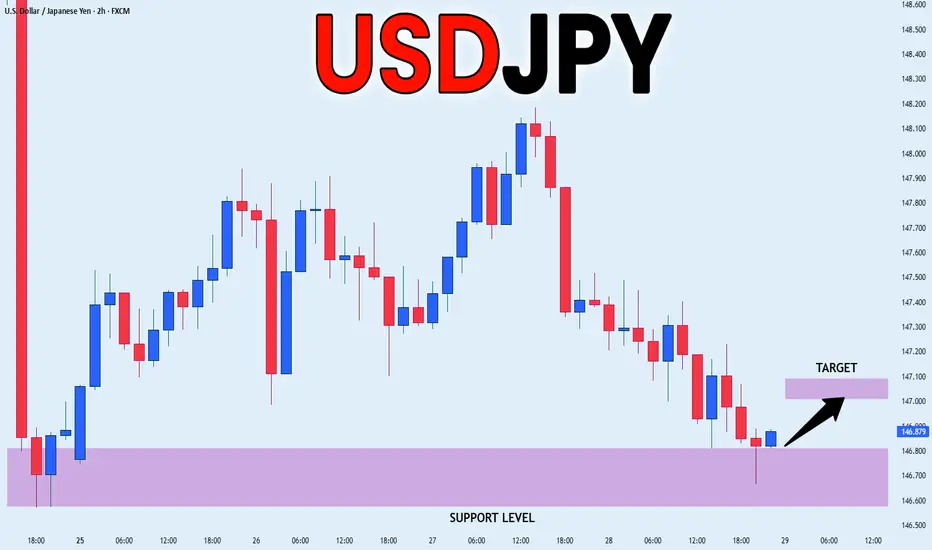
USD_JPY LONG FROM SUPPORT|
✅USD_JPY retested the strong support level of 146.600
After trading in a local downtrend from some time
Which makes a bullish rebound a likely scenario
With the target being a local resistance above at 147.000
LONG🚀
✅Like and subscribe to never miss a new idea!✅
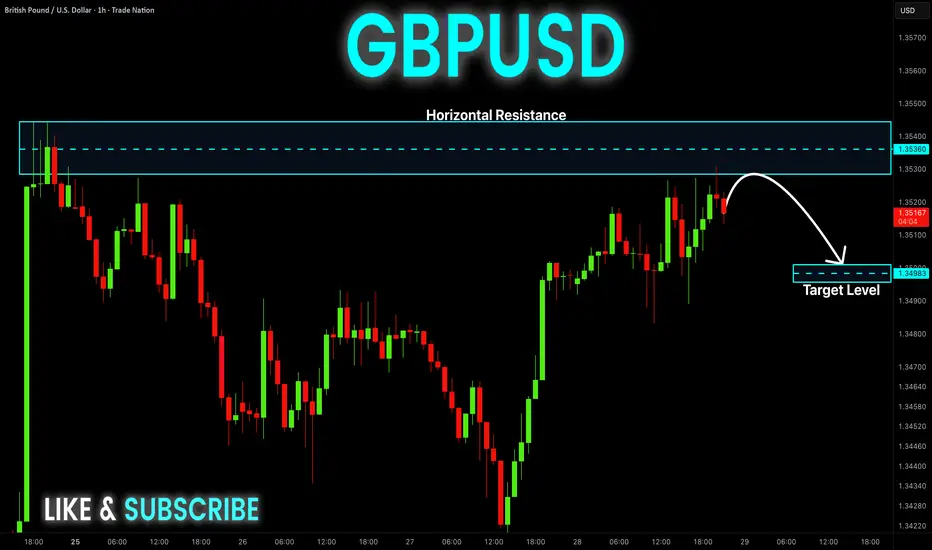
GBP-USD Local Short! Sell!
Hello,Traders!
GBP-USD went up and made
A retest of the horizontal
Resistance of 1.3544 from
Where we will be expecting
A local bearish pullback
And a move down
Sell!
Comment and subscribe to help us grow!
Check out other forecasts below too!
Disclosure: I am part of Trade Nation's Influencer program and receive a monthly fee for using their TradingView charts in my analysis.
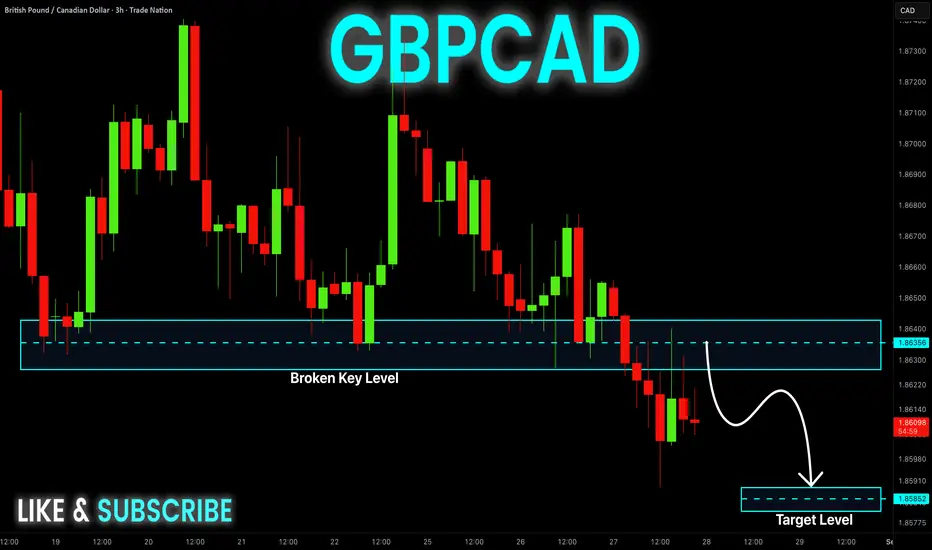
GBP-CAD Bearish Breakout! Sell!
Hello,Traders!
GBP-CAD made a bearish
Breakout of the key horizontal
Level of 1.8640 and the
Breakout is confirmed so
We are bearish biased and
We will be expecting a
Further bearish move down
Sell!
Comment and subscribe to help us grow!
Check out other forecasts below too!
Disclosure: I am part of Trade Nation's Influencer program and receive a monthly fee for using their TradingView charts in my analysis.
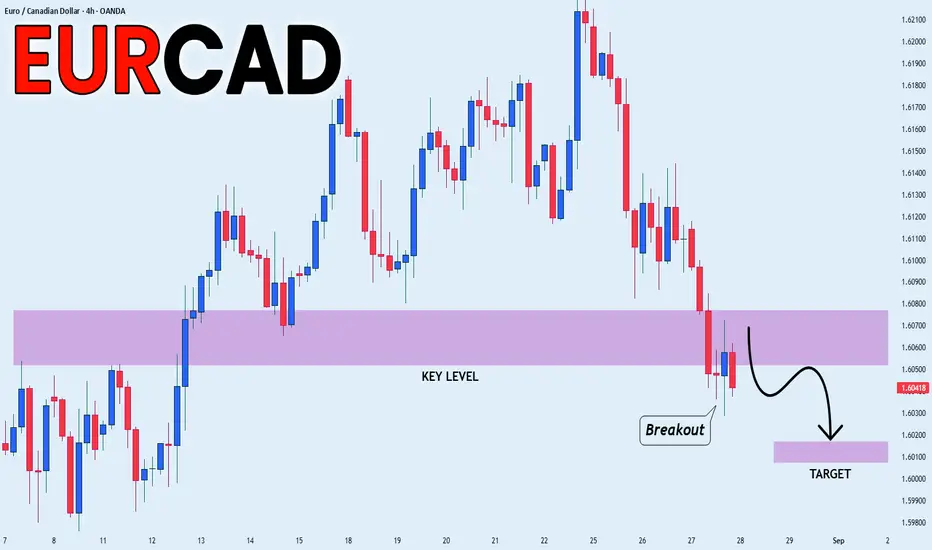
EUR_CAD BEARISH BREAKOUT|SHORT|
✅EUR_CAD broke the
Key structure level of 1.6070
While trading in an local downtrend
Which makes me bearish
And as the retest of the level is complete
Bearish continuation will follow
SHORT🔥
✅Like and subscribe to never miss a new idea!✅
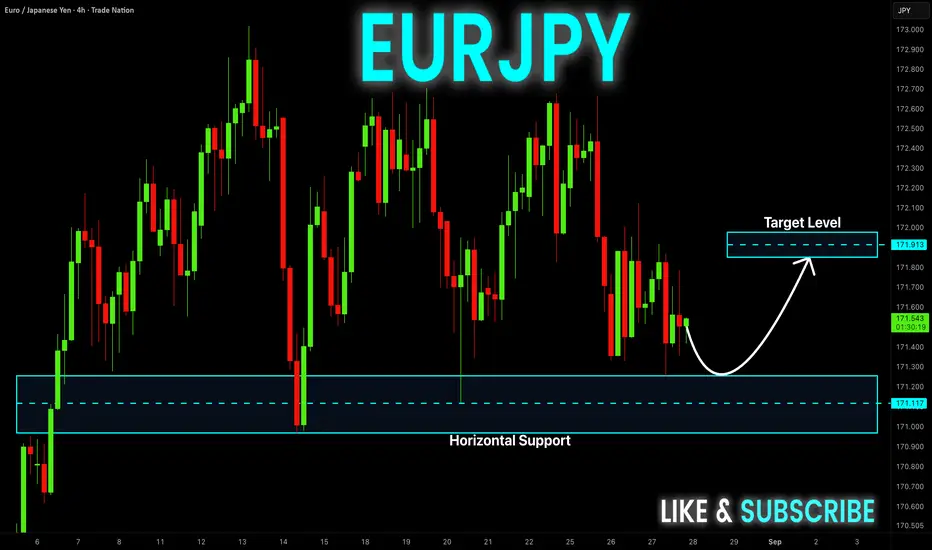
EUR-JPY Rebound Ahead! Buy!
Hello,Traders!
EUR-JPY will soon make
A retest of the horizontal
Support of 171.117 and
After that a local bullish
Rebound is to be expected
Buy!
Comment and subscribe to help us grow!
Check out other forecasts below too!
Disclosure: I am part of Trade Nation's Influencer program and receive a monthly fee for using their TradingView charts in my analysis.
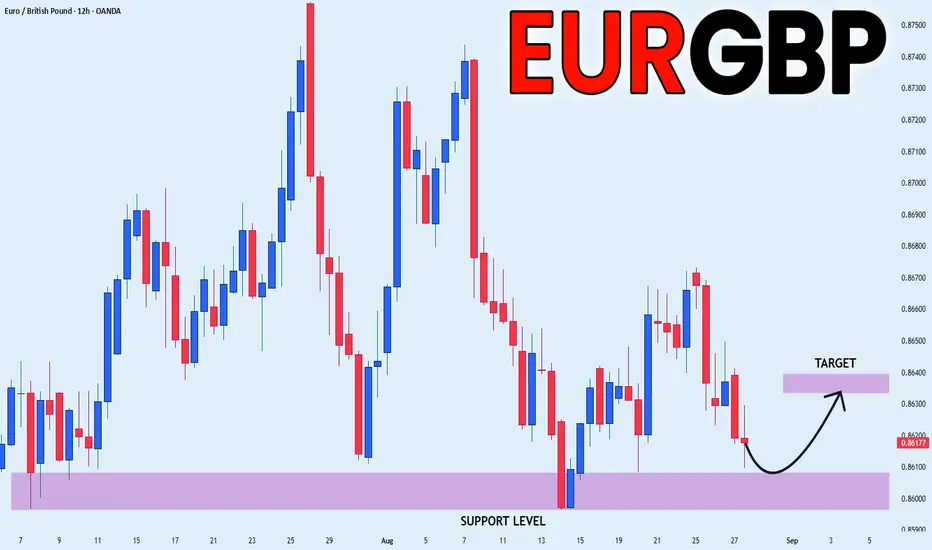
EUR_GBP REBOUND AHEAD|LONG|
✅EUR_GBP fell again and
Will soon retest the support around 0.8600
But it is a strong key level
So I think that there is a high chance
We will see a bullish rebound and a move up
LONG🚀
✅Like and subscribe to never miss a new idea!✅
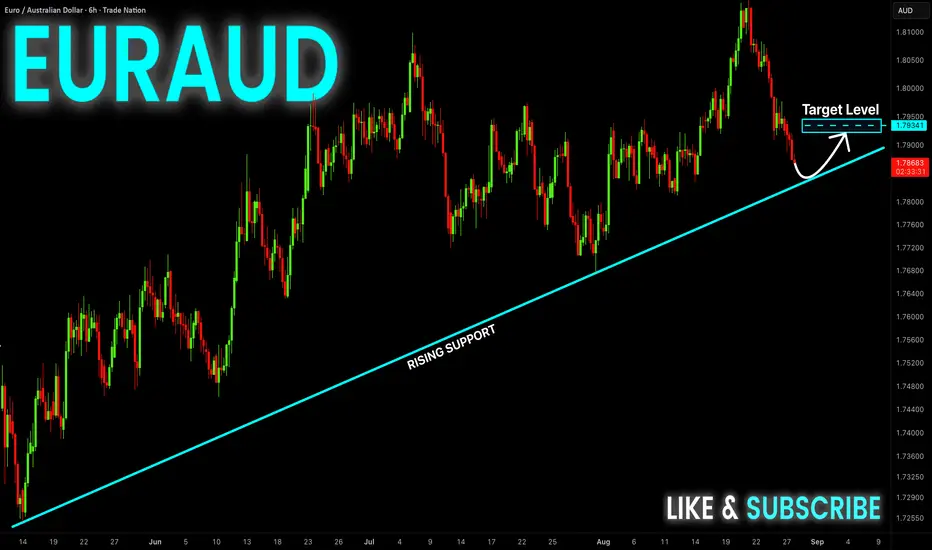
EUR-AUD Long From Rising Support! Buy!
Hello,Traders!
EUR-AUD is trading along
The rising support and the
Pair is about to retest the
Support line from where
We will be expecting a
Rebound and a local move up
Buy!
Comment and subscribe to help us grow!
Check out other forecasts below too!
Disclosure: I am part of Trade Nation's Influencer program and receive a monthly fee for using their TradingView charts in my analysis.
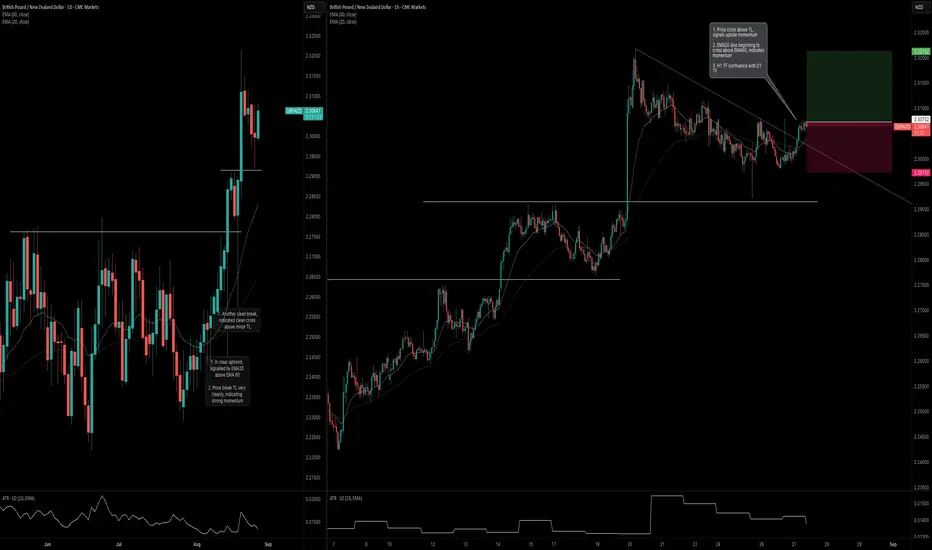
GBPNZD: Trend ContinuationAugust has been a slow month, which I'm hoping volatility with pick up in September. While most pairs have been ranging, GBPNZD has a relatively cleaner trend.
Daily Timeframe:
Over on the daily timeframe, price crossed above a key level that it held below for several months. After crossing up, it found another minor resistance level, which it made another clean break above.
Given the clean breakouts above the resistance levels, this is an indication that the market is pretty one sided. We're not seeing fakeouts or any other indications that sellers still want control.
Hourly Timeframe:
The intraday timeframe is used to optimized my proposed entry. There are two key details here.
The EMA20 is crossing above EMA 60, which is an indication confluence where the intraday trend is aligned with the daily trend.
The pink trendline helps indicate the end of the counter-trend movement. When price crosses above this trendline, it also indicates that I can expect further upside (or that it's very likely).
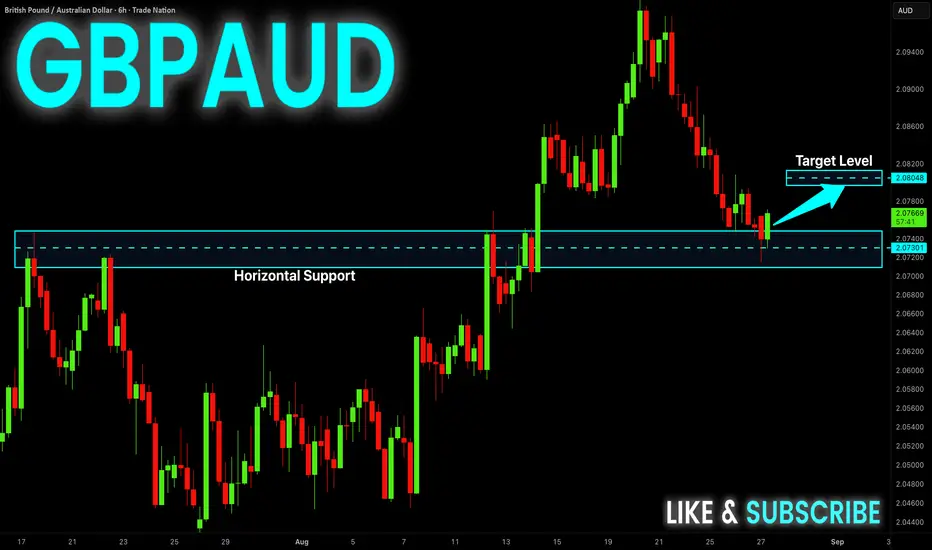
GBP-AUD Long From Support! Buy!
Hello,Traders!
GBP-AUD made a retest
Of the horizontal support
Level of 2.0740 and we
Are already seeing a local
Bullish rebound so we will
Be expecting a further
Bullish move up
Buy!
Comment and subscribe to help us grow!
Check out other forecasts below too!
Disclosure: I am part of Trade Nation's Influencer program and receive a monthly fee for using their TradingView charts in my analysis.
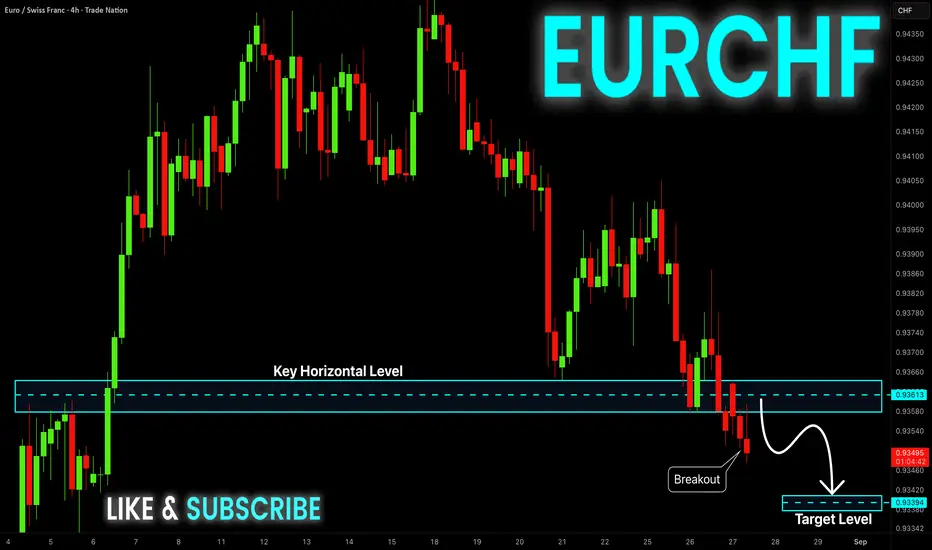
EUR-CHF Bearish Breakout! Buy!
Hello,Traders!
EUR-CHF made a bearish
Breakout of the key horizontal
Level of 0.9361 so we are
Bearish biased and we
Will be expecting a
Further bearish move down
Sell!
Comment and subscribe to help us grow!
Check out other forecasts below too!
Disclosure: I am part of Trade Nation's Influencer program and receive a monthly fee for using their TradingView charts in my analysis.
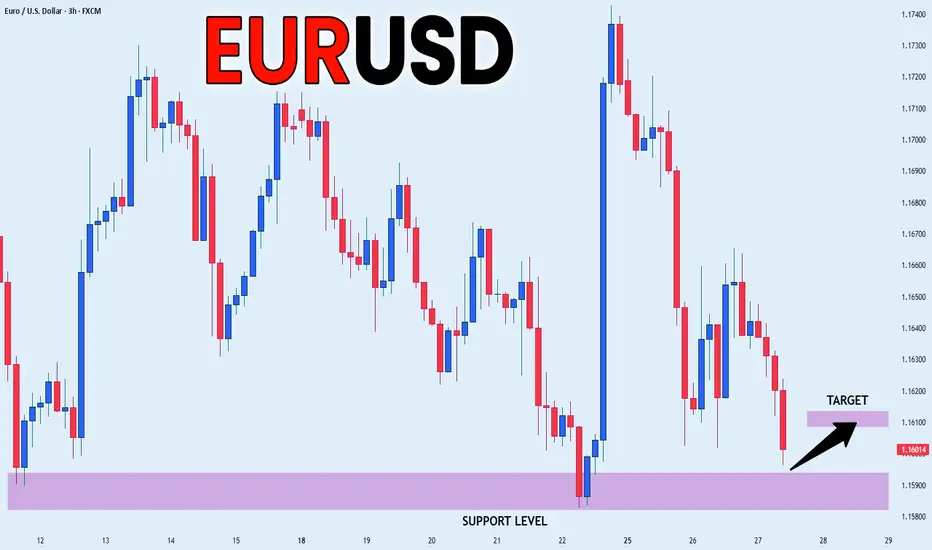
EUR_USD LOCAL LONG|
✅EUR_USD has been falling recently
And the pair seems locally oversold
So as the pair is approaching
A horizontal support of 1.1582
Price growth is to be expected
LONG🚀
✅Like and subscribe to never miss a new idea!✅
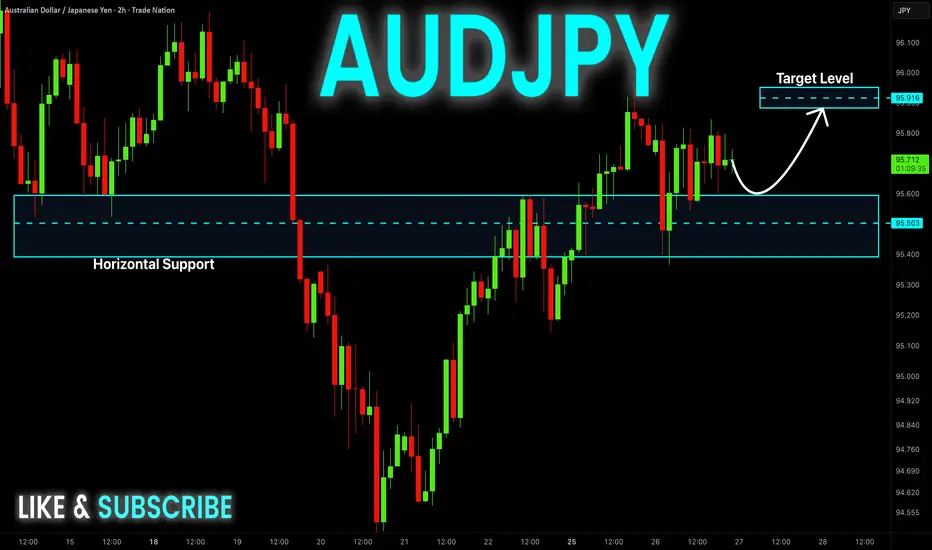
AUD-JPY Will Grow! Buy!
Hello,Traders!
AUD-JPY is trading in a
Local uptrend and the pair
Is already making a bullish
Rebound from the horizontal
Support of 95.503 so we are
Locally bullish biased
And we will be expecting a
Further bullish move up
Buy!
Comment and subscribe to help us grow!
Check out other forecasts below too!
Disclosure: I am part of Trade Nation's Influencer program and receive a monthly fee for using their TradingView charts in my analysis.
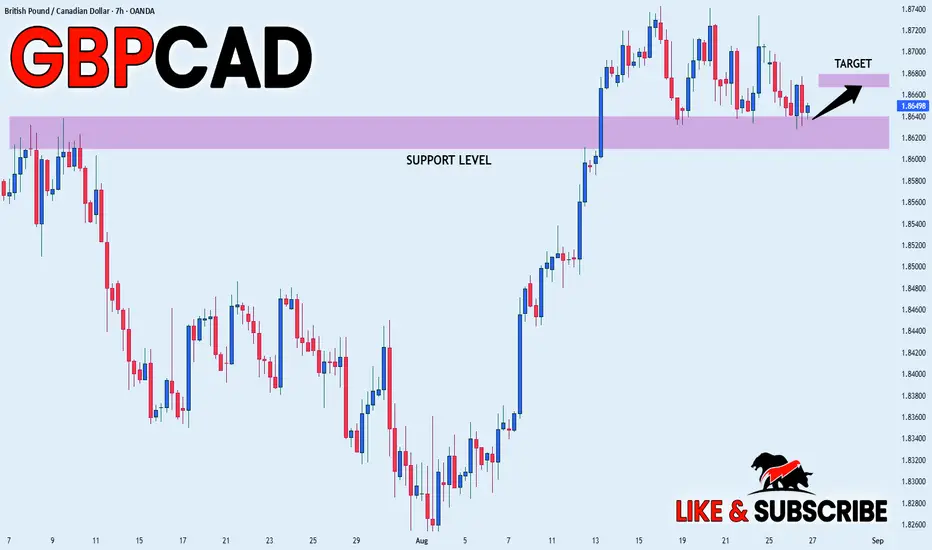
GBP_CAD RISKY LONG|
✅GBP_CAD went down to retest
A horizontal support of 1.8629
Which makes me locally bullish biased
And I think that a move up
From the level is to be expected
Towards the target above at 1.8667
LONG🚀
✅Like and subscribe to never miss a new idea!✅
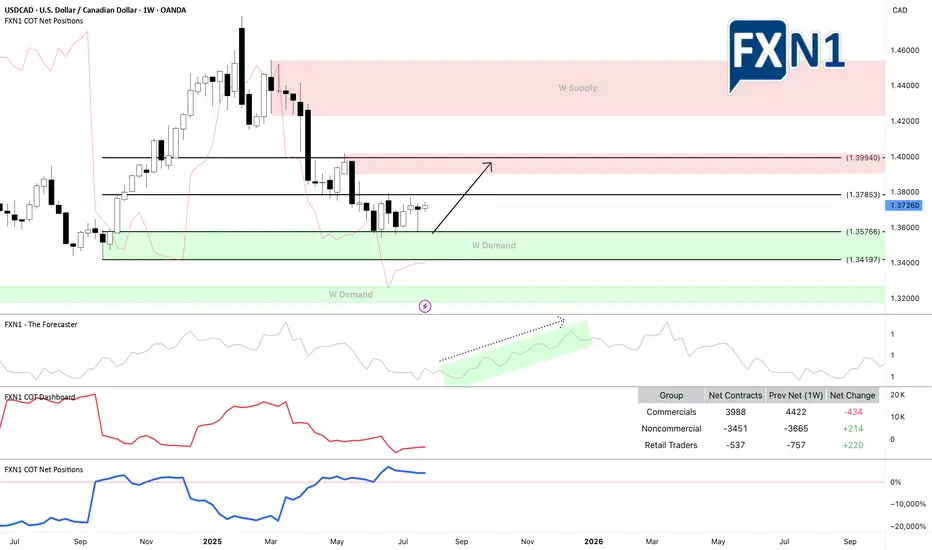
USD/CAD - 6C1! : Trade update FundamentalThe US dollar index (DXY) gained strength against major currencies on Monday following a landmark trade agreement between the United States and the European Union. During the meeting in Scotland on Sunday, President Donald Trump and European Commission President Ursula von der Leyen announced a new trade framework, which includes a 15% import tariff on EU goods—half of the 30% rate Trump had initially threatened to impose starting August 1.
The DXY opened higher at the start of the week, and it’s clear that most currencies are likely to see a decline in response. This trend also extends to pairs like the 6C1! (USDCAD), where the USD has been increasing its long positions. Last week, non-commercial traders added to their holdings, while commercial traders remain at their highest levels since 2021. Based on this setup, we are maintaining a bullish outlook and expect the continuation of our long position strategy.
Previous Idea :
✅ Please share your thoughts about USD/CAD in the comments section below and HIT LIKE if you appreciate my analysis. Don't forget to FOLLOW ME; you will help us a lot with this small contribution.
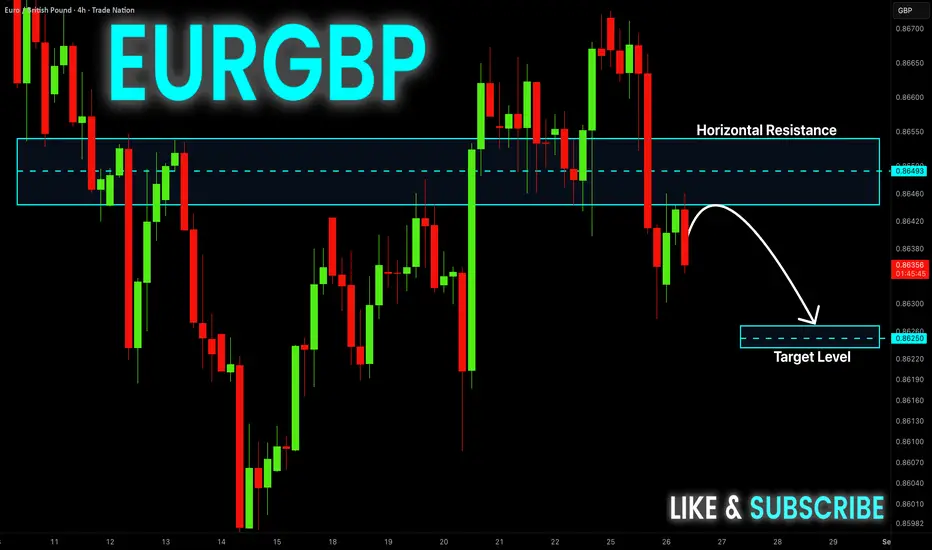
EUR-GBP Local Short! Sell!
Hello,Traders!
EUR-GBP made a retest
Of the horizontal resistance
Of 0.8651 from where
We are already seeing a
Local pullback and we will
Be expecting a further
Bearish move down
Sell!
Comment and subscribe to help us grow!
Check out other forecasts below too!
Disclosure: I am part of Trade Nation's Influencer program and receive a monthly fee for using their TradingView charts in my analysis.
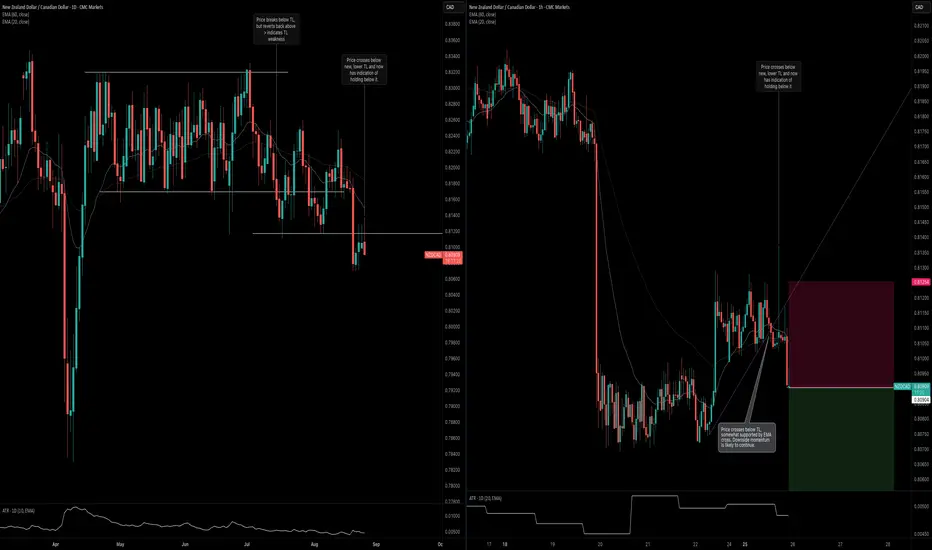
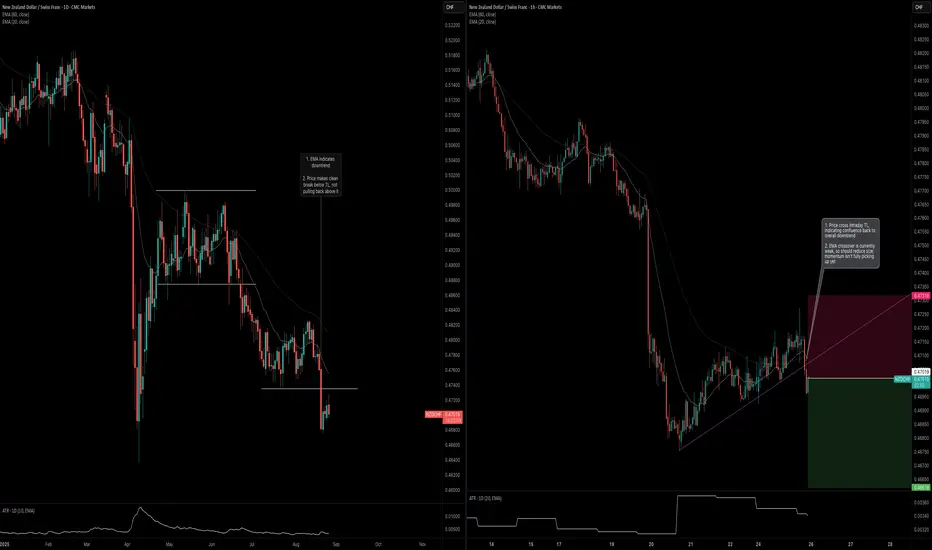
NZDCHF: Downtrend MomentumSimilar to NZDCAD, there's a very similar signal on NZDCHF.
Daily Timeframe:
Unlike with NZDCAD, price broke through support very cleanly. It is currently holding below with no indication of a fakeout.
Likewise, EMA20 remains firmly below EMA60, which is the other indication that this is a downtrend.
Hourly Timeframe:
I use an ascending intraday trendline to indicate when the counter-trend movement is coming to an end. As price breaks below the intraday trendline, that's a good indication of confluence in the overall trend direction.
The EMA crossover is not great, which is a little bit of a concern to me. Will need to reduce risk and potential scale into a position depending on how this trade goes.
NZDCAD: Price Holding Below SupportNZDCAD has been in a messy daily range. The daily levels do not hold cleanly. However, I do think there's an opportunity here regardless.
The first trendline break indicates weakness. The second trendline break is cleaner as price is able to hold below this level on the daily timeframe.
Looking at the intraday timeframe, I plotted a trendline to look for confluence. Price crosses below this trendline and is somewhat supported by an exponential moving average crossover.
There is an opportunity to scale into this trade provided that it starts trending cleanly.