AUDNZD Technical + Fundamental Align for DownsideToday I want to analyze a short position on the AUDNZD ( OANDA:AUDNZD ) pair, first, let's look at it from a fundamental analysis perspective .
Fundamental View on AUDNZD
Key reasons to short AUDNZD:
Australian weakness:
Recent data show weakening consumer sentiment and declining building approvals. The RBA seems hesitant to hike further, putting pressure on the Aussie.
New Zealand resilience:
The RBNZ maintains a relatively hawkish stance. Inflation is still a concern, and the central bank is committed to keeping rates high, supporting NZD strength.
Monetary policy divergence:
The divergence between RBA’s dovish stance and RBNZ’s hawkish approach supports further downside in AUDNZD.
----------------------
Now let's take a look at AUDNZD from a technical analysis perspective on the 4-hour timeframe .
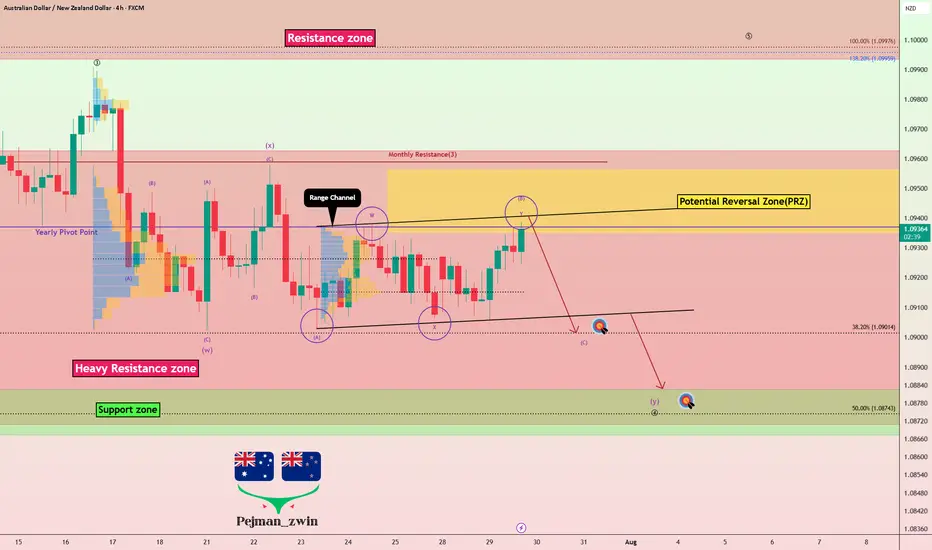
AUDNZD is currently trading in a Heavy Resistance zone(1.0963 NZD-1.0870 NZD) near the upper line of the Range Channel , Potential Reversal Zone(PRZ) and Yearly Pivot Point .
In terms of Elliott Wave theory , AUDNZD appears to be completing microwave B of microwave Y of the main wave 4 .
I expect AUDNZD to drop to at least 1.0904 NZD(First Target) based on the above explanation .
Second Target: 1.0886 NZD
Note: Stop Loss(SL): 1.0963 NZD
Please respect each other's ideas and express them politely if you agree or disagree.
Australian Dollar/New Zealand Dollar Analyze (AUDNZD), 4-hour time frame.
Be sure to follow the updated ideas.
Do not forget to put a Stop loss for your positions (For every position you want to open).
Please follow your strategy and updates; this is just my Idea, and I will gladly see your ideas in this post.
Please do not forget the ✅' like '✅ button 🙏😊 & Share it with your friends; thanks, and Trade safe.
Forex
EURUSD Set To Grow! BUY!
My dear followers,
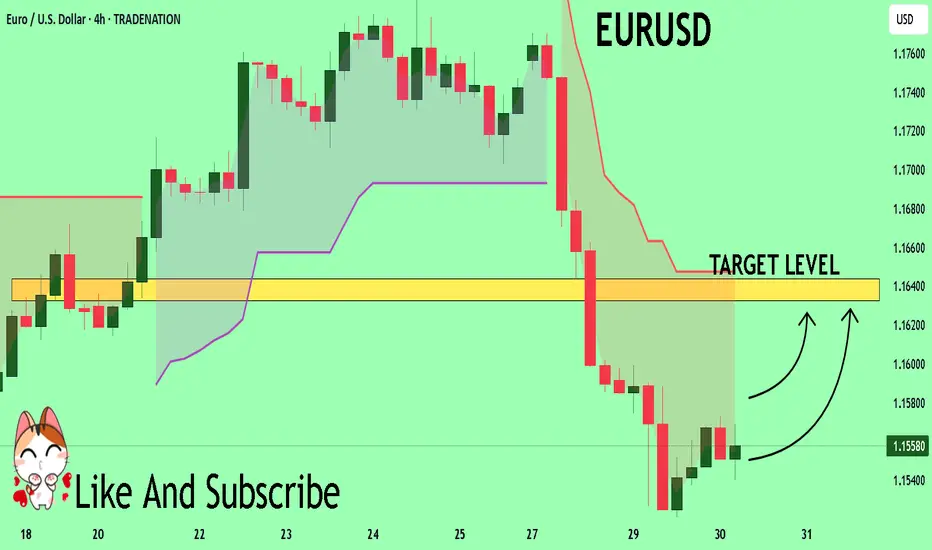
This is my opinion on the EURUSD next move:
The asset is approaching an important pivot point 1.1557
Bias - Bullish
Technical Indicators: Supper Trend generates a clear long signal while Pivot Point HL is currently determining the overall Bullish trend of the market.
Goal - 1.1632
About Used Indicators:
For more efficient signals, super-trend is used in combination with other indicators like Pivot Points.
Disclosure: I am part of Trade Nation's Influencer program and receive a monthly fee for using their TradingView charts in my analysis.
———————————
WISH YOU ALL LUCK
BTC - Bulls vs Bears: who will win?Market Context
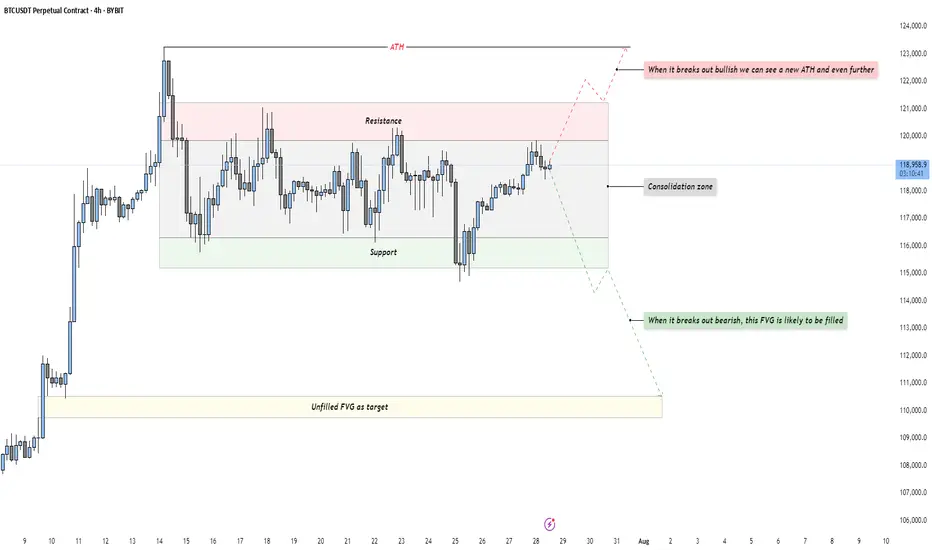
Bitcoin is trading in a tight consolidation just below its all-time high after a strong impulsive rally. This phase represents a balance of power between buyers and sellers, with neither side able to take control yet. Such a pause in momentum at this key level often builds pressure for a breakout move as liquidity pools accumulate above and below the range.
Consolidation Phase
The current range is clearly defined by a resistance area at the top and a support area at the bottom. Price has been oscillating within these boundaries without any sustained breakout attempts. This range-bound behavior is an essential part of the market cycle, as it allows larger players to build or distribute positions. The longer price stays in this box, the more significant the breakout that follows tends to be.
Bullish Breakout Scenario
If price breaks out decisively above resistance, it would indicate buyers have absorbed all the supply at these levels. Such a breakout opens the path to a new all-time high and could potentially extend far beyond as trapped shorts are forced to cover. For traders, a retest of the breakout level on lower timeframes could provide a low-risk entry point for continuation to the upside.
Bearish Breakout Scenario
On the flip side, if support fails, the market will likely gravitate toward the unfilled Fair Value Gap left behind during the previous rally. This inefficiency becomes a natural draw for price, offering a logical downside target for a corrective move. A clean break below the range followed by a retest from underneath could present shorting opportunities for those aiming to capture that move into the FVG.
Final Words
Patience and precision are key when dealing with setups like this. Let the market come to your level — and react with intent.
If you found this breakdown helpful, a like is much appreciated! Let me know in the comments what you think or if you’re watching the same zones.
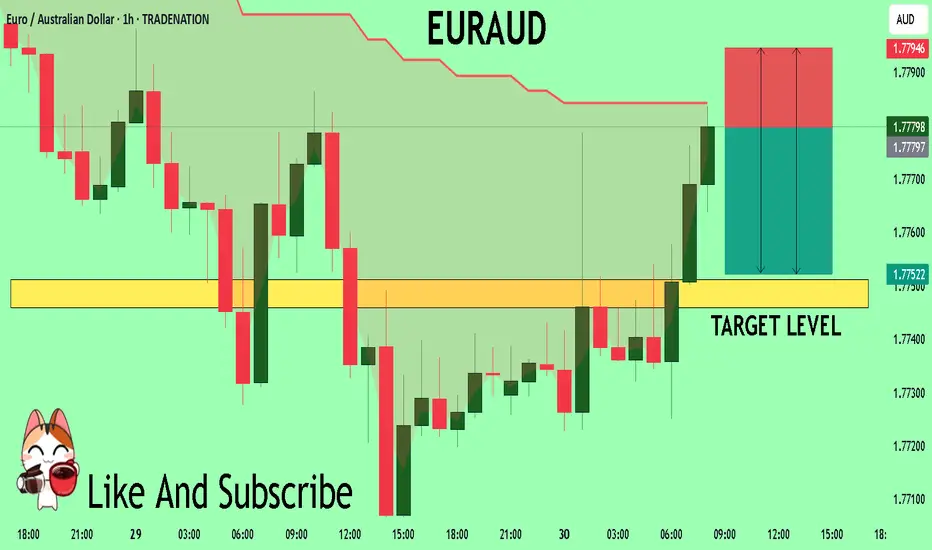
EURAUD Under Pressure! SELL!
My dear followers,
I analysed this chart on EURAUD and concluded the following:
The market is trading on 1.7780 pivot level.
Bias - Bearish
Technical Indicators: Both Super Trend & Pivot HL indicate a highly probable Bearish continuation.
Target - 1.7751
Safe Stop Loss - 1.7794
About Used Indicators:
A super-trend indicator is plotted on either above or below the closing price to signal a buy or sell. The indicator changes color, based on whether or not you should be buying. If the super-trend indicator moves below the closing price, the indicator turns green, and it signals an entry point or points to buy.
Disclosure: I am part of Trade Nation's Influencer program and receive a monthly fee for using their TradingView charts in my analysis.
———————————
WISH YOU ALL LUCK
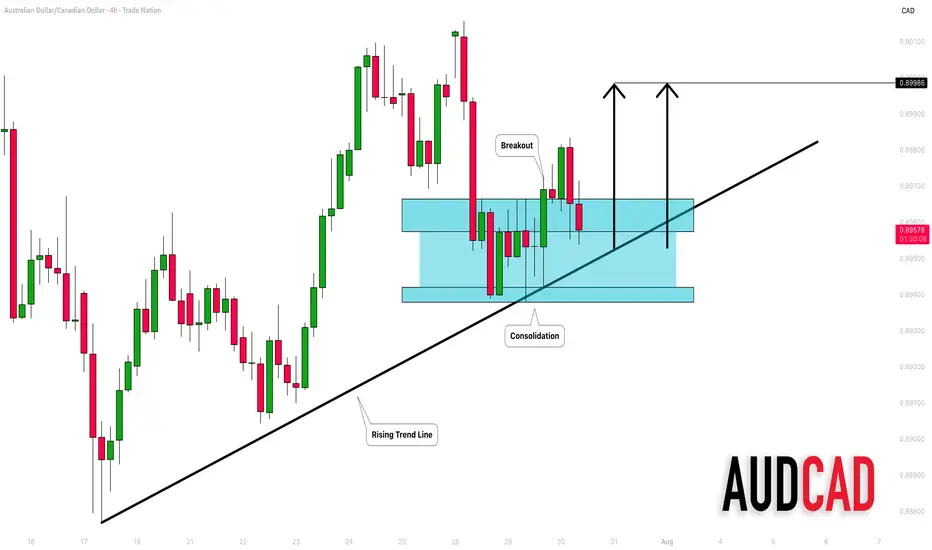
AUDCAD: Bullish Move From Trend Line 🇦🇺🇨🇦
AUDCAD may bounce from a solid rising trend line on a 4H.
The price started to consolidate on that after its test.
A breakout of a minor horizontal resistance is a strong bullish confirmation.
Goal - 0.8999
❤️Please, support my work with like, thank you!❤️
I am part of Trade Nation's Influencer program and receive a monthly fee for using their TradingView charts in my analysis.
#AN022: Geopolitical Tensions and Forex Pressure
Hello, I'm Forex Trader Andrea Russo, and today I want to talk to you about this week's latest geopolitical tensions.
1. The Russian ruble in crisis, weakening against the USD and CNY
The ruble fell 1.5% against the dollar and 0.8% against the yuan, following a US ultimatum to Moscow for an immediate truce in Ukraine.
FX Impact: The ruble remains vulnerable, fueling demand for safe-haven currencies such as the USD, EUR, and CHF. Crosses against the RUB show potential technical short reversals.
2. Oil Rises: First Impacts on Energy Costs
Brent prices rose 3.5% to $72.50 a barrel following the announcement of possible US sanctions on buyers of Russian oil.
FX Impact: Oil-related currencies such as the CAD and NOK benefit; USD risks weakness if importing countries experience inflationary pressures.
3. Euro falls monthly for the first time, dollar strengthens
The euro is in the red on a monthly basis for the first time in 2025, while the dollar benefits from cautious Fed rate expectations and the EU-US trade deal perceived as biased toward Washington.
Forex Impact: EUR/USD is under structural pressure. Euro-commodity correlates (EUR/CAD, EUR/AUD) are showing signs of weakness.
4. IMF warns of US tariffs and rising global inflation
In its latest report, the IMF emphasized that US tariffs are slowing global growth and fueling persistent inflationary pressures.
FX Impact: Increased uncertainty favors the USD and CHF. Emerging economies and commodity-linked economies (MXN, ZAR, BRL) could weaken further.
5. India Strengthens: Growing Exports and Solid Reserves
India recorded a 7.2% increase in merchandise exports and maintains stable foreign exchange reserves, demonstrating macroeconomic resilience and the resilience of the rupee.
Forex Impact: The INR could strengthen or consolidate at robust levels, while USD/INR pairs signal potential support.
6. Global Digital Projects and Fragmentation of Payment Systems
The adoption of alternative systems to SWIFT such as mBridge or Project Agorá reflects a push toward global financial independence.
Forex Impact: The euro and dollar remain dominant, but the RMB is gaining ground in Asia-Pacific countries. RMB crosses (USD/CNH, EUR/CNH) require attention, especially from a long-term perspective.

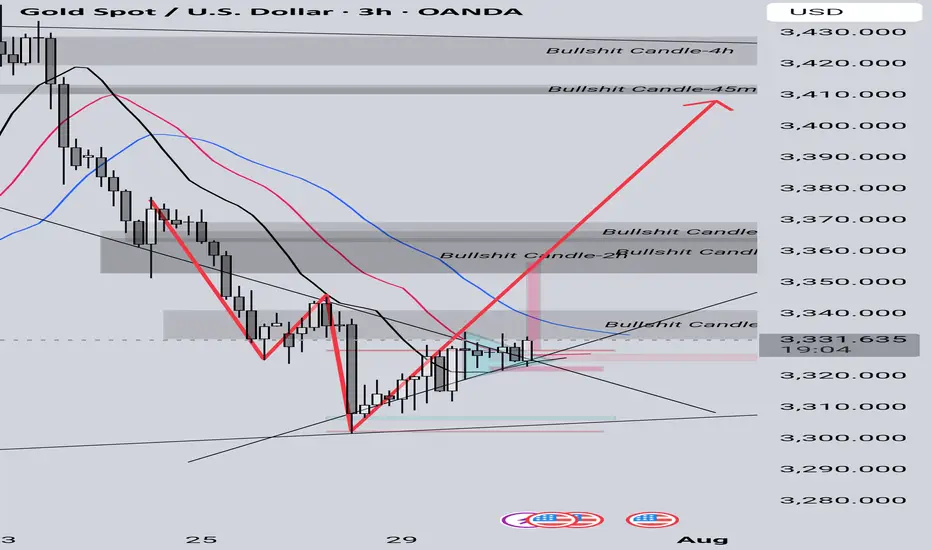
Gold Price Analysis July 30Gold (XAUUSD) Consolidating in a Triangle Pattern – Preparing for a Big Breakout
Currently, gold is moving within a triangle consolidation pattern, reflecting the market’s indecision as investors await a series of important economic data from the US this week. This hesitation suggests that a breakout from the triangle pattern could trigger a strong FOMO effect, creating a significant price movement in either direction.
The current price action is similar to a “bull flag” or “pennant” pattern, where a breakout could lead to a clearer and more decisive trend. If the support zone in the pattern fails to hold, the possibility of a sell-off is high.
Trading scenario:
🔻 Activate SELL order:
When price breaks the triangle bottom around 3324
Downside target: 3285, further is the strong support zone at 3250
🔺 Activate BUY order:
When price breaks and holds above the resistance zone 3333
Or: when there is a bearish rejection signal and candle confirmation at the area 3385

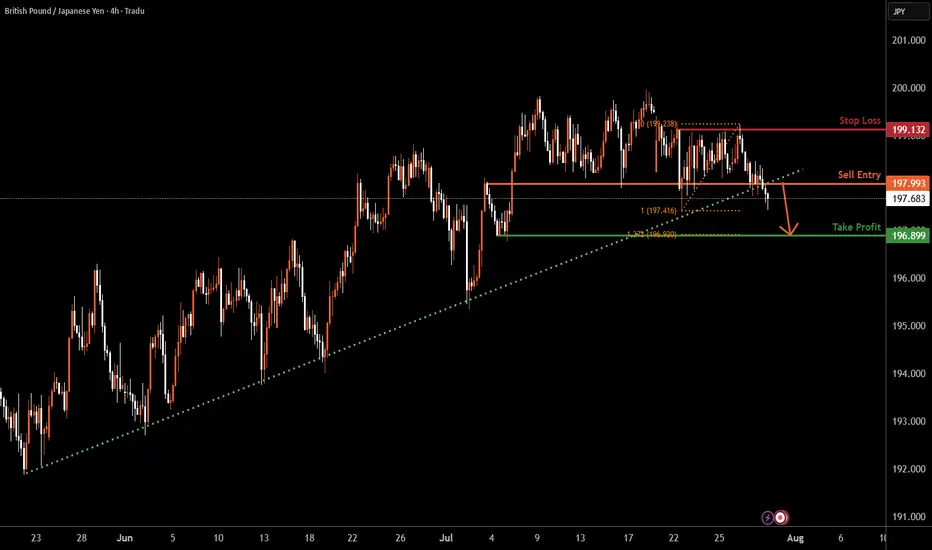
GBPJPY H4 | Bearish dropGBP/JPY has broken below the support level, which is an overlap support. A potential pullback to the sell entry, followed by a reversal, could lead to a further price drop.
Sell entry is at 197.99, which is an overlap resistance.
Stop loss is at 199.13, which is a pullback resistance.
Take profit is at 196.89, which is a swing low support that lines up with the 127.2% Fibonacci extension.
High Risk Investment Warning
Trading Forex/CFDs on margin carries a high level of risk and may not be suitable for all investors. Leverage can work against you.
Stratos Markets Limited (tradu.com ):
CFDs are complex instruments and come with a high risk of losing money rapidly due to leverage. 65% of retail investor accounts lose money when trading CFDs with this provider. You should consider whether you understand how CFDs work and whether you can afford to take the high risk of losing your money.
Stratos Europe Ltd (tradu.com ):
CFDs are complex instruments and come with a high risk of losing money rapidly due to leverage. 66% of retail investor accounts lose money when trading CFDs with this provider. You should consider whether you understand how CFDs work and whether you can afford to take the high risk of losing your money.
Stratos Global LLC (tradu.com ):
Losses can exceed deposits.
Please be advised that the information presented on TradingView is provided to Tradu (‘Company’, ‘we’) by a third-party provider (‘TFA Global Pte Ltd’). Please be reminded that you are solely responsible for the trading decisions on your account. There is a very high degree of risk involved in trading. Any information and/or content is intended entirely for research, educational and informational purposes only and does not constitute investment or consultation advice or investment strategy. The information is not tailored to the investment needs of any specific person and therefore does not involve a consideration of any of the investment objectives, financial situation or needs of any viewer that may receive it. Kindly also note that past performance is not a reliable indicator of future results. Actual results may differ materially from those anticipated in forward-looking or past performance statements. We assume no liability as to the accuracy or completeness of any of the information and/or content provided herein and the Company cannot be held responsible for any omission, mistake nor for any loss or damage including without limitation to any loss of profit which may arise from reliance on any information supplied by TFA Global Pte Ltd.
The speaker(s) is neither an employee, agent nor representative of Tradu and is therefore acting independently. The opinions given are their own, constitute general market commentary, and do not constitute the opinion or advice of Tradu or any form of personal or investment advice. Tradu neither endorses nor guarantees offerings of third-party speakers, nor is Tradu responsible for the content, veracity or opinions of third-party speakers, presenters or participants.
NZDUSD H4 | Bearish dropKiwi (NZD/USD) is rising towards the sell entry, which is a pullback resistance and could reverse from this level and drop lower.
Sell entry is at 0.5978, which is a pullback resistance.
Stop loss is at 0.6002, which is a pullback resistance that lines up with the 50% Fibonacci retracement.
Take profit is at 0.5942, which is a multi-swing low support.
High Risk Investment Warning
Trading Forex/CFDs on margin carries a high level of risk and may not be suitable for all investors. Leverage can work against you.
Stratos Markets Limited (tradu.com ):
CFDs are complex instruments and come with a high risk of losing money rapidly due to leverage. 65% of retail investor accounts lose money when trading CFDs with this provider. You should consider whether you understand how CFDs work and whether you can afford to take the high risk of losing your money.
Stratos Europe Ltd (tradu.com ):
CFDs are complex instruments and come with a high risk of losing money rapidly due to leverage. 66% of retail investor accounts lose money when trading CFDs with this provider. You should consider whether you understand how CFDs work and whether you can afford to take the high risk of losing your money.
Stratos Global LLC (tradu.com ):
Losses can exceed deposits.
Please be advised that the information presented on TradingView is provided to Tradu (‘Company’, ‘we’) by a third-party provider (‘TFA Global Pte Ltd’). Please be reminded that you are solely responsible for the trading decisions on your account. There is a very high degree of risk involved in trading. Any information and/or content is intended entirely for research, educational and informational purposes only and does not constitute investment or consultation advice or investment strategy. The information is not tailored to the investment needs of any specific person and therefore does not involve a consideration of any of the investment objectives, financial situation or needs of any viewer that may receive it. Kindly also note that past performance is not a reliable indicator of future results. Actual results may differ materially from those anticipated in forward-looking or past performance statements. We assume no liability as to the accuracy or completeness of any of the information and/or content provided herein and the Company cannot be held responsible for any omission, mistake nor for any loss or damage including without limitation to any loss of profit which may arise from reliance on any information supplied by TFA Global Pte Ltd.
The speaker(s) is neither an employee, agent nor representative of Tradu and is therefore acting independently. The opinions given are their own, constitute general market commentary, and do not constitute the opinion or advice of Tradu or any form of personal or investment advice. Tradu neither endorses nor guarantees offerings of third-party speakers, nor is Tradu responsible for the content, veracity or opinions of third-party speakers, presenters or participants.

AUDUSD H4| Bearish reversal off 38.2% Fibonacci resistanceAussie (AUD/USD) is rising towards the sell entry, which is a pullback resistance that lines up with the 38.2% Fibonacci retracement and could reverse to the take profit.
Buy entry is at 0.6541, which is a pullback resistance that lines up with the 38.2% Fibonacci retracement.
Stop loss is at 0.6580, which is a pullback resistance that aligns with the 61.8% Fibonacci retracement.
Take profit is at 0.6467, which is a swing low support.
High Risk Investment Warning
Trading Forex/CFDs on margin carries a high level of risk and may not be suitable for all investors. Leverage can work against you.
Stratos Markets Limited (tradu.com ):
CFDs are complex instruments and come with a high risk of losing money rapidly due to leverage. 65% of retail investor accounts lose money when trading CFDs with this provider. You should consider whether you understand how CFDs work and whether you can afford to take the high risk of losing your money.
Stratos Europe Ltd (tradu.com ):
CFDs are complex instruments and come with a high risk of losing money rapidly due to leverage. 66% of retail investor accounts lose money when trading CFDs with this provider. You should consider whether you understand how CFDs work and whether you can afford to take the high risk of losing your money.
Stratos Global LLC (tradu.com ):
Losses can exceed deposits.
Please be advised that the information presented on TradingView is provided to Tradu (‘Company’, ‘we’) by a third-party provider (‘TFA Global Pte Ltd’). Please be reminded that you are solely responsible for the trading decisions on your account. There is a very high degree of risk involved in trading. Any information and/or content is intended entirely for research, educational and informational purposes only and does not constitute investment or consultation advice or investment strategy. The information is not tailored to the investment needs of any specific person and therefore does not involve a consideration of any of the investment objectives, financial situation or needs of any viewer that may receive it. Kindly also note that past performance is not a reliable indicator of future results. Actual results may differ materially from those anticipated in forward-looking or past performance statements. We assume no liability as to the accuracy or completeness of any of the information and/or content provided herein and the Company cannot be held responsible for any omission, mistake nor for any loss or damage including without limitation to any loss of profit which may arise from reliance on any information supplied by TFA Global Pte Ltd.
The speaker(s) is neither an employee, agent nor representative of Tradu and is therefore acting independently. The opinions given are their own, constitute general market commentary, and do not constitute the opinion or advice of Tradu or any form of personal or investment advice. Tradu neither endorses nor guarantees offerings of third-party speakers, nor is Tradu responsible for the content, veracity or opinions of third-party speakers, presenters or participants.

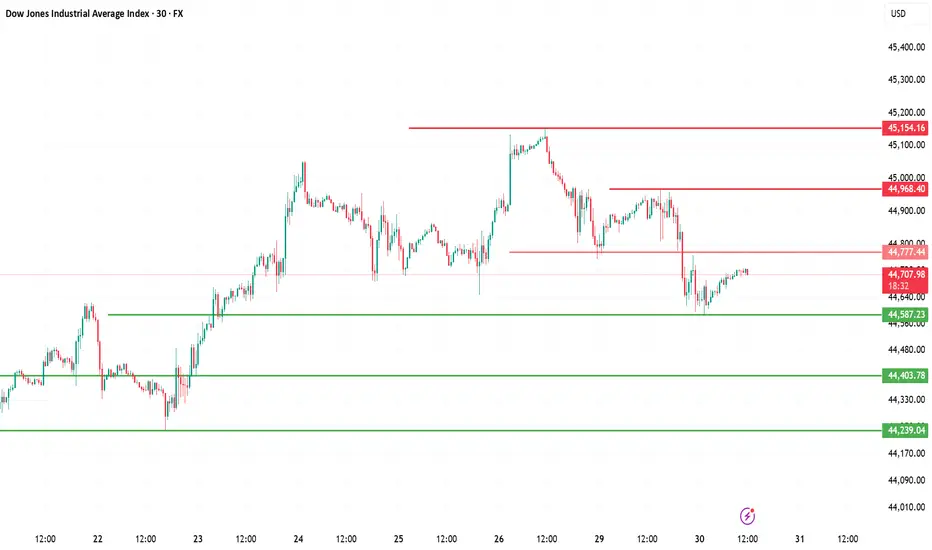
Dow Jones Index (DJI) – July 30, 2025 | 30-Min Chart Analysis
1. Current Market Structure
DJI is consolidating just below the intraday resistance at 44,777. Price is attempting to recover after a sharp drop from the 45,154 high.
2. Supply Zone Rejection
Price faced strong rejection near 45,154 and again at 44,968 — confirming this area as an active seller zone.
3. Support Zone Defense
Buyers stepped in at 44,587 and 44,403, creating a short-term demand base. These levels have provided stability for now.
4. Trend Outlook
The lower high formation and recent sharp sell-off hint at bearish pressure. Price is currently in a retracement — unless 44,968 breaks cleanly, sellers remain in control.
5. Key Levels to Watch
Resistance 44,777 → 44,968 → 45,154
Support 44,587 → 44,403 → 44,239
🔁 Bias: Short-term bearish unless price breaks above 44,968 and holds.
USDJPY | H4 Bullish bounce offBased on the H4 chart analysis, the price is falling towards the buy entry, which is an overlap support that aligns with the 61.8% Fibonacci retracement and could bounce from this level and rise higher.
Buy entry is at 147.08, which is an overlap support that lines up with the 61.8% Fibonacci retracement.
Stop loss is at 145.82, which is a multi-swing low support.
Take profit is at 148.72, which is pullback resistance.
High Risk Investment Warning
Trading Forex/CFDs on margin carries a high level of risk and may not be suitable for all investors. Leverage can work against you.
Stratos Markets Limited (tradu.com ):
CFDs are complex instruments and come with a high risk of losing money rapidly due to leverage. 65% of retail investor accounts lose money when trading CFDs with this provider. You should consider whether you understand how CFDs work and whether you can afford to take the high risk of losing your money.
Stratos Europe Ltd (tradu.com):
CFDs are complex instruments and come with a high risk of losing money rapidly due to leverage. 66% of retail investor accounts lose money when trading CFDs with this provider. You should consider whether you understand how CFDs work and whether you can afford to take the high risk of losing your money.
Stratos Global LLC (tradu.com ):
Losses can exceed deposits.
Please be advised that the information presented on TradingView is provided to Tradu (‘Company’, ‘we’) by a third-party provider (‘TFA Global Pte Ltd’). Please be reminded that you are solely responsible for the trading decisions on your account. There is a very high degree of risk involved in trading. Any information and/or content is intended entirely for research, educational and informational purposes only and does not constitute investment or consultation advice or investment strategy. The information is not tailored to the investment needs of any specific person and therefore does not involve a consideration of any of the investment objectives, financial situation or needs of any viewer that may receive it. Kindly also note that past performance is not a reliable indicator of future results. Actual results may differ materially from those anticipated in forward-looking or past performance statements. We assume no liability as to the accuracy or completeness of any of the information and/or content provided herein and the Company cannot be held responsible for any omission, mistake nor for any loss or damage including without limitation to any loss of profit which may arise from reliance on any information supplied by TFA Global Pte Ltd.
The speaker(s) is neither an employee, agent nor representative of Tradu and is therefore acting independently. The opinions given are their own, constitute general market commentary, and do not constitute the opinion or advice of Tradu or any form of personal or investment advice. Tradu neither endorses nor guarantees offerings of third-party speakers, nor is Tradu responsible for the content, veracity or opinions of third-party speakers, presenters or participants.

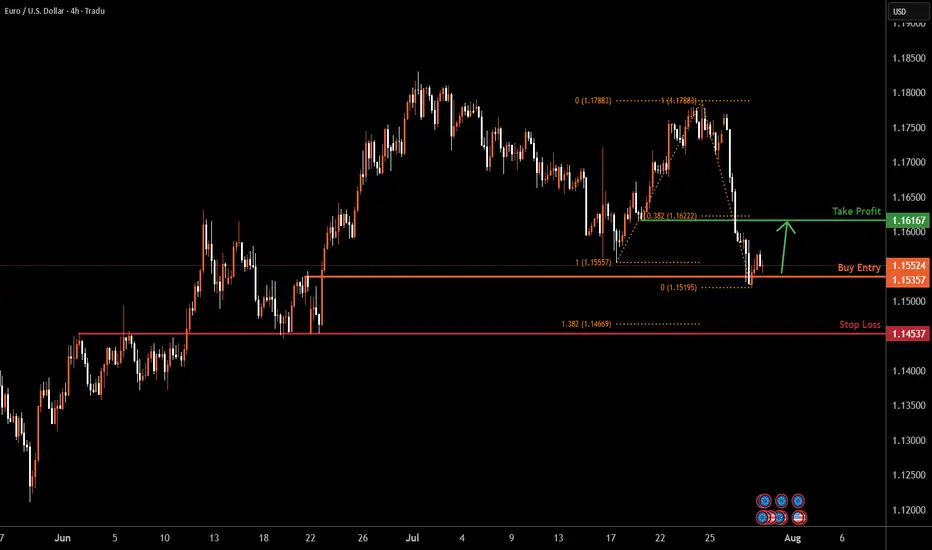
EURUSD | H4 Bullish bounce offBased on the H4 chart analysis, the price is reacting off the support level, which is a pullback support, and could rise higher.
Buy entry is at 1.1535, which is a pullback support.
Stop loss is at 1.1453, which is an overlap support that is underneath the 138.2% Fibonacci extension.
Take profit is at 1.1616, which is a pullback resistance that aligns with the 38.2% Fibonacci retracement.
High Risk Investment Warning
Trading Forex/CFDs on margin carries a high level of risk and may not be suitable for all investors. Leverage can work against you.
Stratos Markets Limited (tradu.com ):
CFDs are complex instruments and come with a high risk of losing money rapidly due to leverage. 65% of retail investor accounts lose money when trading CFDs with this provider. You should consider whether you understand how CFDs work and whether you can afford to take the high risk of losing your money.
Stratos Europe Ltd (tradu.com ):
CFDs are complex instruments and come with a high risk of losing money rapidly due to leverage. 66% of retail investor accounts lose money when trading CFDs with this provider. You should consider whether you understand how CFDs work and whether you can afford to take the high risk of losing your money.
Stratos Global LLC (tradu.com ):
Losses can exceed deposits.
Please be advised that the information presented on TradingView is provided to Tradu (‘Company’, ‘we’) by a third-party provider (‘TFA Global Pte Ltd’). Please be reminded that you are solely responsible for the trading decisions on your account. There is a very high degree of risk involved in trading. Any information and/or content is intended entirely for research, educational and informational purposes only and does not constitute investment or consultation advice or investment strategy. The information is not tailored to the investment needs of any specific person and therefore does not involve a consideration of any of the investment objectives, financial situation or needs of any viewer that may receive it. Kindly also note that past performance is not a reliable indicator of future results. Actual results may differ materially from those anticipated in forward-looking or past performance statements. We assume no liability as to the accuracy or completeness of any of the information and/or content provided herein and the Company cannot be held responsible for any omission, mistake nor for any loss or damage including without limitation to any loss of profit which may arise from reliance on any information supplied by TFA Global Pte Ltd.
The speaker(s) is neither an employee, agent nor representative of Tradu and is therefore acting independently. The opinions given are their own, constitute general market commentary, and do not constitute the opinion or advice of Tradu or any form of personal or investment advice. Tradu neither endorses nor guarantees offerings of third-party speakers, nor is Tradu responsible for the content, veracity or opinions of third-party speakers, presenters or participants.
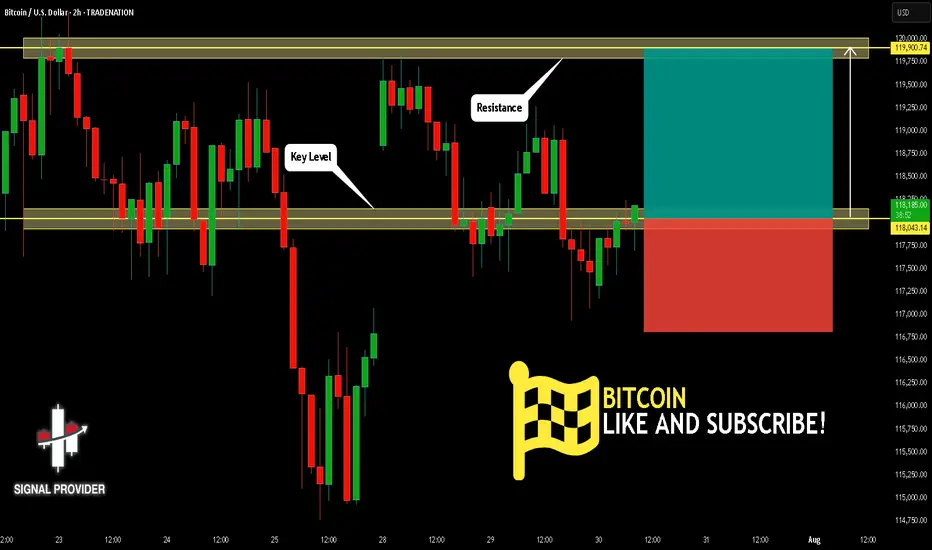
BITCOIN Will Move Higher! Long!
Take a look at our analysis for BITCOIN.
Time Frame: 2h
Current Trend: Bullish
Sentiment: Oversold (based on 7-period RSI)
Forecast: Bullish
The price is testing a key support 118,043.14.
Current market trend & oversold RSI makes me think that buyers will push the price. I will anticipate a bullish movement at least to 119,900.74 level.
P.S
The term oversold refers to a condition where an asset has traded lower in price and has the potential for a price bounce.
Overbought refers to market scenarios where the instrument is traded considerably higher than its fair value. Overvaluation is caused by market sentiments when there is positive news.
Disclosure: I am part of Trade Nation's Influencer program and receive a monthly fee for using their TradingView charts in my analysis.
Like and subscribe and comment my ideas if you enjoy them!
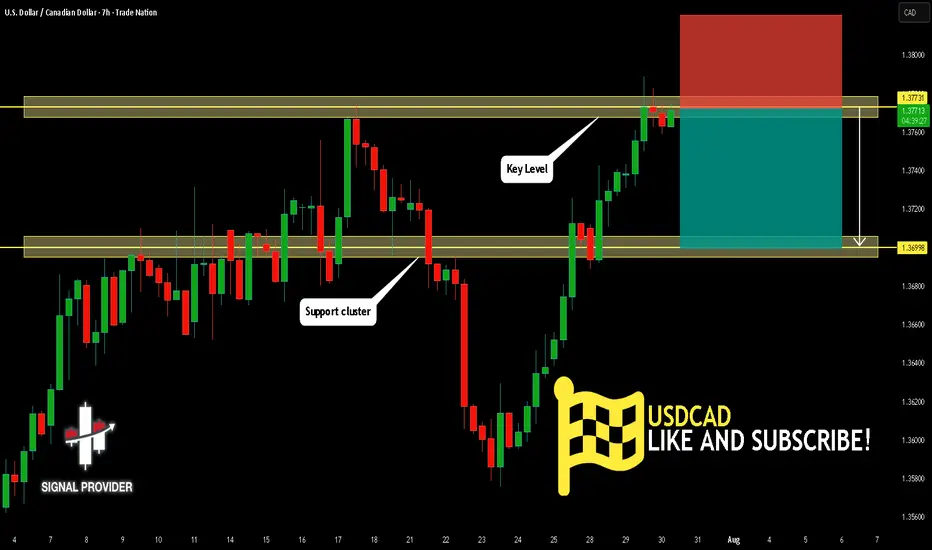
USDCAD Is Bearish! Sell!
Please, check our technical outlook for USDCAD.
Time Frame: 7h
Current Trend: Bearish
Sentiment: Overbought (based on 7-period RSI)
Forecast: Bearish
The market is trading around a solid horizontal structure 1.377.
The above observations make me that the market will inevitably achieve 1.369 level.
P.S
We determine oversold/overbought condition with RSI indicator.
When it drops below 30 - the market is considered to be oversold.
When it bounces above 70 - the market is considered to be overbought.
Disclosure: I am part of Trade Nation's Influencer program and receive a monthly fee for using their TradingView charts in my analysis.
Like and subscribe and comment my ideas if you enjoy them!
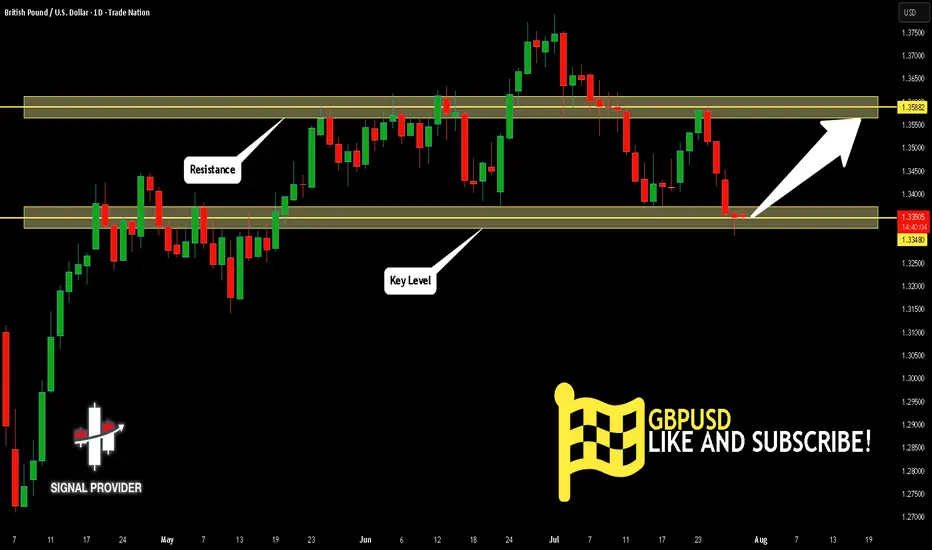
GBPUSD Is Very Bullish! Buy!
Here is our detailed technical review for GBPUSD.
Time Frame: 1D
Current Trend: Bullish
Sentiment: Oversold (based on 7-period RSI)
Forecast: Bullish
The market is testing a major horizontal structure 1.334.
Taking into consideration the structure & trend analysis, I believe that the market will reach 1.358 level soon.
P.S
Overbought describes a period of time where there has been a significant and consistent upward move in price over a period of time without much pullback.
Disclosure: I am part of Trade Nation's Influencer program and receive a monthly fee for using their TradingView charts in my analysis.
Like and subscribe and comment my ideas if you enjoy them!
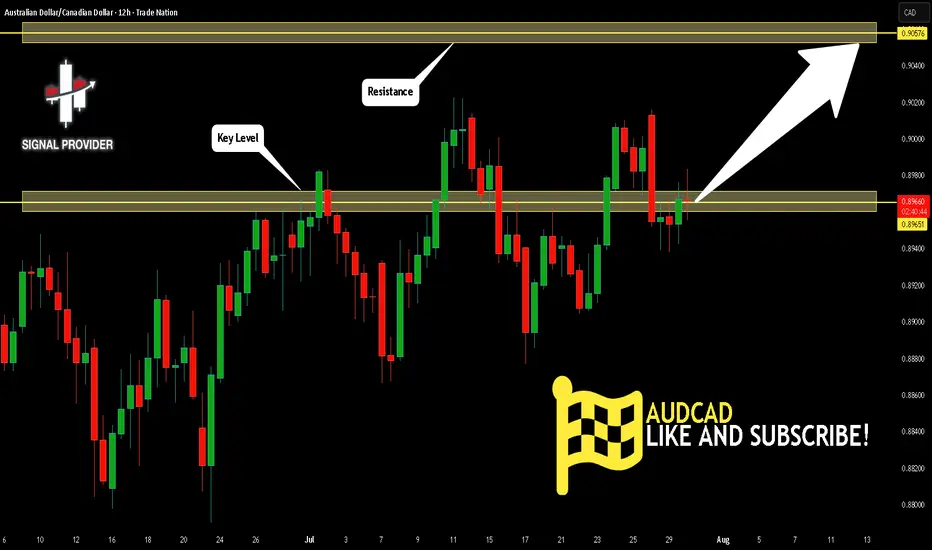
AUDCAD Is Going Up! Long!
Take a look at our analysis for AUDCAD.
Time Frame: 12h
Current Trend: Bullish
Sentiment: Oversold (based on 7-period RSI)
Forecast: Bullish
The market is approaching a key horizontal level 0.896.
Considering the today's price action, probabilities will be high to see a movement to 0.905.
P.S
Please, note that an oversold/overbought condition can last for a long time, and therefore being oversold/overbought doesn't mean a price rally will come soon, or at all.
Disclosure: I am part of Trade Nation's Influencer program and receive a monthly fee for using their TradingView charts in my analysis.
Like and subscribe and comment my ideas if you enjoy them!
GBPUSD H4 | Bearish continuationThe Cable (GBP/USD) is rising toward a pullback resistance level and may reverse from this point, potentially dropping lower.
Buy entry is at 1.3391, located at a pullback resistance.
Stop loss is at 1.3460, also a pullback resistance, positioned slightly above the 50% Fibonacci retracement.
Take profit is at 1.3318, which is a pullback support level.
High Risk Investment Warning
Trading Forex/CFDs on margin carries a high level of risk and may not be suitable for all investors. Leverage can work against you.
Stratos Markets Limited (tradu.com ):
CFDs are complex instruments and come with a high risk of losing money rapidly due to leverage. 65% of retail investor accounts lose money when trading CFDs with this provider. You should consider whether you understand how CFDs work and whether you can afford to take the high risk of losing your money.
Stratos Europe Ltd (tradu.com ):
CFDs are complex instruments and come with a high risk of losing money rapidly due to leverage. 66% of retail investor accounts lose money when trading CFDs with this provider. You should consider whether you understand how CFDs work and whether you can afford to take the high risk of losing your money.
Stratos Global LLC (tradu.com ):
Losses can exceed deposits.
Please be advised that the information presented on TradingView is provided to Tradu (‘Company’, ‘we’) by a third-party provider (‘TFA Global Pte Ltd’). Please be reminded that you are solely responsible for the trading decisions on your account. There is a very high degree of risk involved in trading. Any information and/or content is intended entirely for research, educational and informational purposes only and does not constitute investment or consultation advice or investment strategy. The information is not tailored to the investment needs of any specific person and therefore does not involve a consideration of any of the investment objectives, financial situation or needs of any viewer that may receive it. Kindly also note that past performance is not a reliable indicator of future results. Actual results may differ materially from those anticipated in forward-looking or past performance statements. We assume no liability as to the accuracy or completeness of any of the information and/or content provided herein and the Company cannot be held responsible for any omission, mistake nor for any loss or damage including without limitation to any loss of profit which may arise from reliance on any information supplied by TFA Global Pte Ltd.
The speaker(s) is neither an employee, agent nor representative of Tradu and is therefore acting independently. The opinions given are their own, constitute general market commentary, and do not constitute the opinion or advice of Tradu or any form of personal or investment advice. Tradu neither endorses nor guarantees offerings of third-party speakers, nor is Tradu responsible for the content, veracity or opinions of third-party speakers, presenters or participants.

GBPUSD SELLAfter seeing the previous daily candle close bearish and the 4hr had a retrace back into the moving averages we could expect price to see further sell off into support

EURJPY ANALYSISAfter seeing the daily still pushing to the downside and breaking below key support of 171.250 we could be looking out for a retest and continuation to the down side target of 170.000

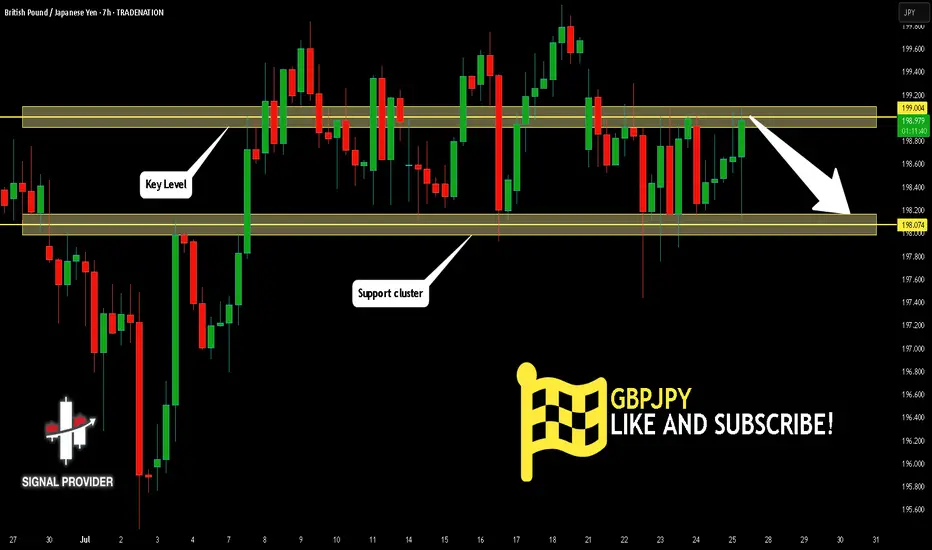
GBPJPY Is Very Bearish! Sell!
Please, check our technical outlook for GBPJPY.
Time Frame: 7h
Current Trend: Bearish
Sentiment: Overbought (based on 7-period RSI)
Forecast: Bearish
The market is trading around a solid horizontal structure 199.004.
The above observations make me that the market will inevitably achieve 198.074 level.
P.S
Please, note that an oversold/overbought condition can last for a long time, and therefore being oversold/overbought doesn't mean a price rally will come soon, or at all.
Disclosure: I am part of Trade Nation's Influencer program and receive a monthly fee for using their TradingView charts in my analysis.
Like and subscribe and comment my ideas if you enjoy them!
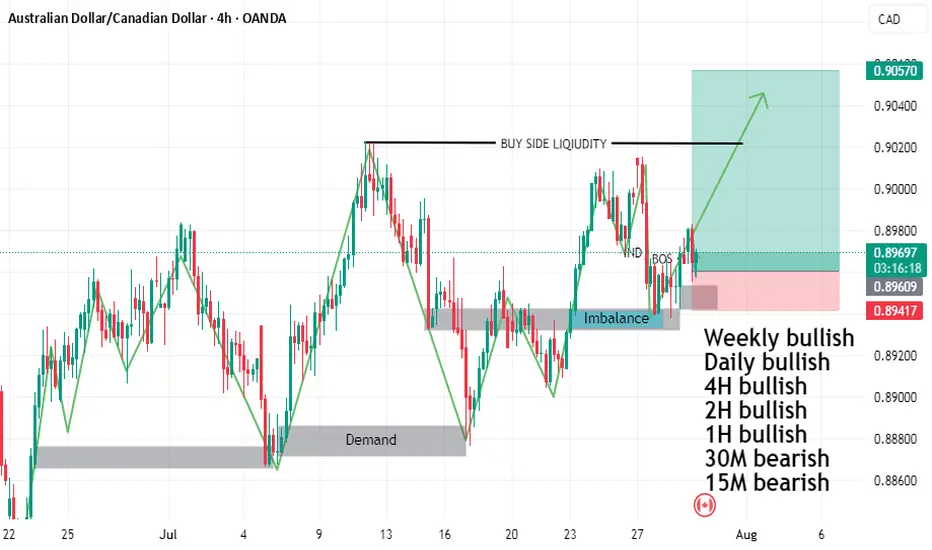
AUDCAD BUY SETUPTHE PRICE FORMED HEAD AND SHOULDER
and do rejection from mitigation order block and imbalance
and we have liquidity on time frame daily buy side liquidity
and time frame weekly double top
so I will buy with you
DON'T forget to follow me so that get more refresh analysis