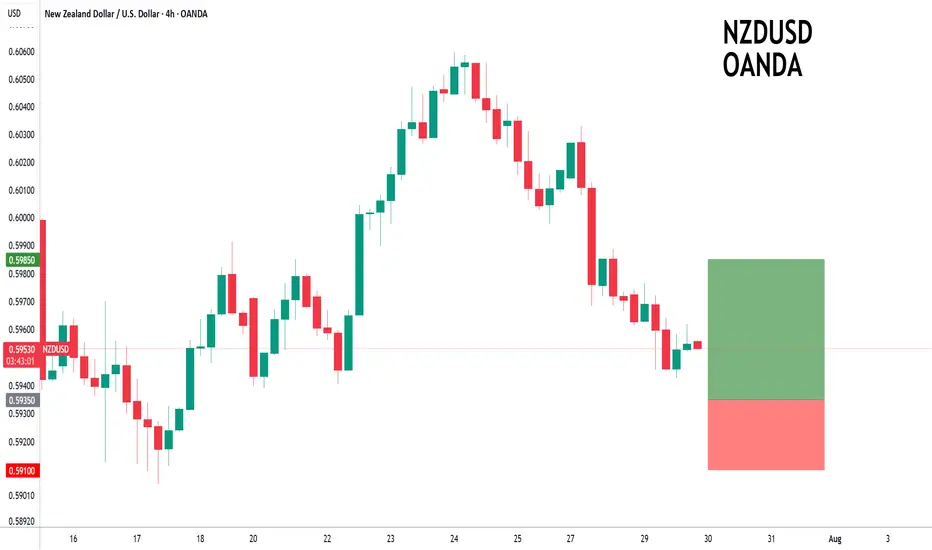
NZDUSD to form a higher low?NZDUSD - 24h expiry
Pivot support is at 0.5935.
We expect a reversal in this move.
Risk/Reward would be poor to call a buy from current levels.
A move through 0.5975 will confirm the bullish momentum.
The measured move target is 0.6000.
We look to Buy at 0.5935 (stop at 0.5910)
Our profit targets will be 0.5985 and 0.6000
Resistance: 0.5975 / 0.5985 / 0.6000
Support: 0.5935 / 0.5925 / 0.5910
Risk Disclaimer
The trade ideas beyond this page are for informational purposes only and do not constitute investment advice or a solicitation to trade. This information is provided by Signal Centre, a third-party unaffiliated with OANDA, and is intended for general circulation only. OANDA does not guarantee the accuracy of this information and assumes no responsibilities for the information provided by the third party. The information does not take into account the specific investment objectives, financial situation, or particular needs of any particular person. You should take into account your specific investment objectives, financial situation, and particular needs before making a commitment to trade, including seeking, under a separate engagement, as you deem fit.
You accept that you assume all risks in independently viewing the contents and selecting a chosen strategy.
Where the research is distributed in Singapore to a person who is not an Accredited Investor, Expert Investor or an Institutional Investor, Oanda Asia Pacific Pte Ltd (“OAP“) accepts legal responsibility for the contents of the report to such persons only to the extent required by law. Singapore customers should contact OAP at 6579 8289 for matters arising from, or in connection with, the information/research distributed.
Forex
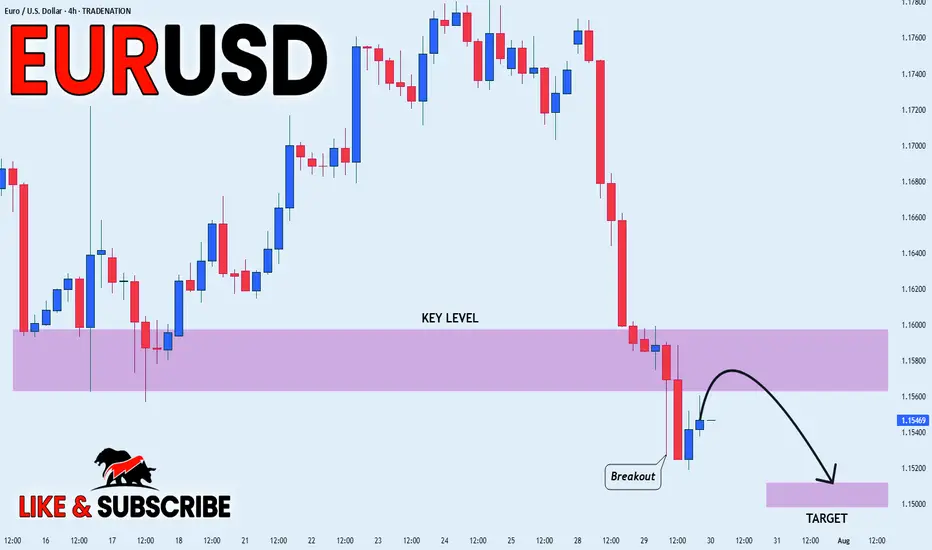
EUR_USD BEARISH BREAKOUT|SHORT|
✅EUR_USD broke the key
Structure level of 1.1580
While trading in an local downtrend
Which makes me bearish
And I think that after the retest of
The broken level is complete
A bearish continuation will follow
SHORT🔥
✅Like and subscribe to never miss a new idea!✅
Disclosure: I am part of Trade Nation's Influencer program and receive a monthly fee for using their TradingView charts in my analysis.
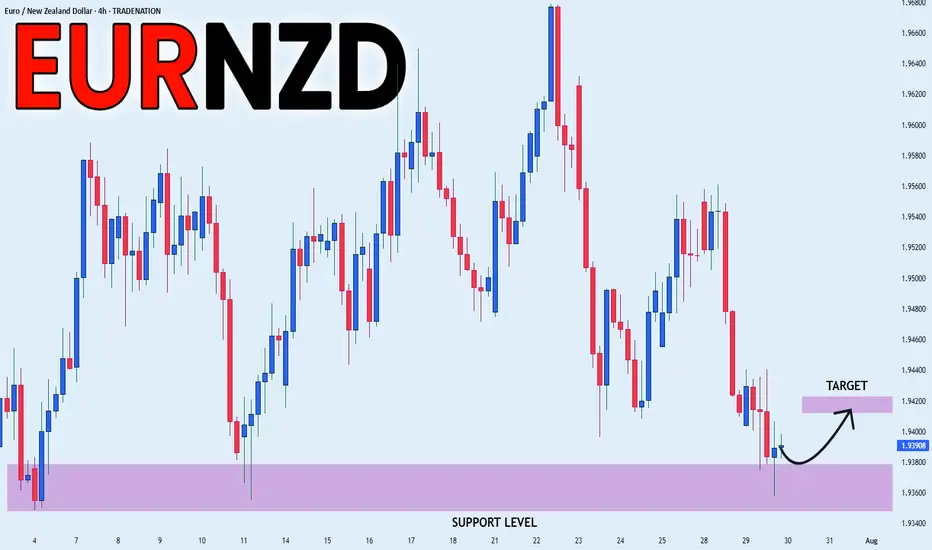
EUR_NZD REBOUND AHEAD|LONG|
✅EUR_NZD fell again to retest the support of 1.9380
But it is a strong key level
So I think that there is a high chance
That we will see a bullish rebound and a move up
LONG🚀
✅Like and subscribe to never miss a new idea!✅
Disclosure: I am part of Trade Nation's Influencer program and receive a monthly fee for using their TradingView charts in my analysis.
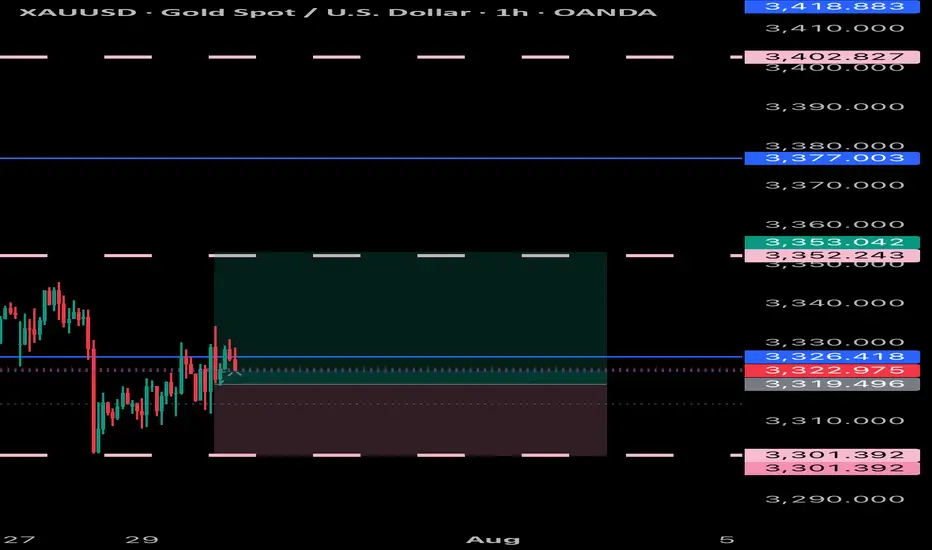
GOLD XAUUSD Gold moving as expected respecting our price and entries, will look for swinging opportunities ,and SL adjustments to BE
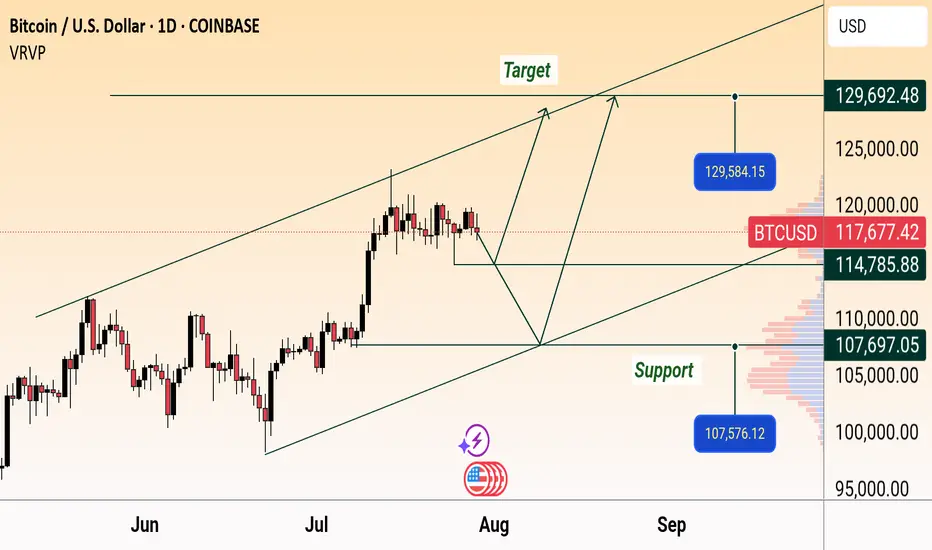
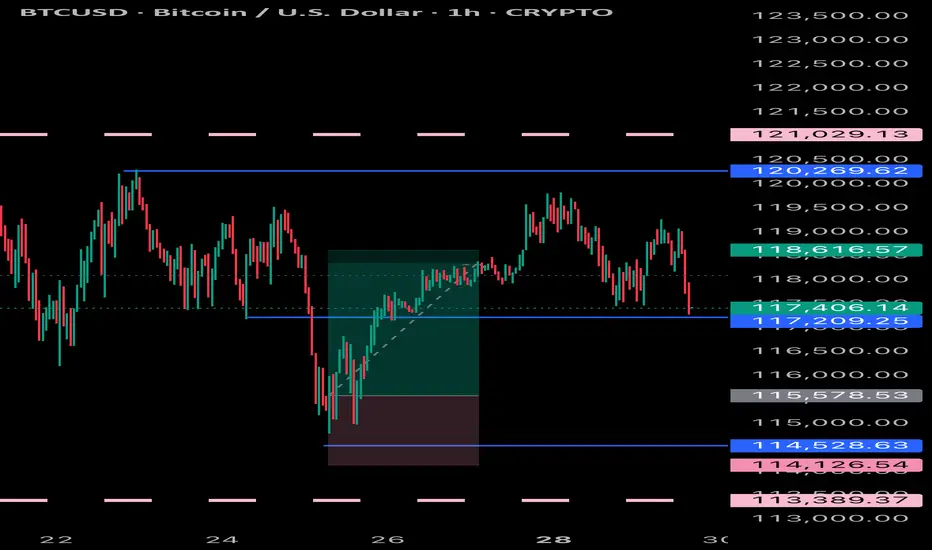
BTC/USD Daily Outlook: Support & Target Levels IdentifiedBitcoin (BTC/USD) Daily Chart Analysis:
Price is currently at $117,758.70, showing a slight decline. Key support levels are marked at $114,785.88 and $107,576.12, while targets are projected near $129,584.15 and $129,692.48. Chart suggests a possible upward channel, with both bullish and bearish scenarios mapped.
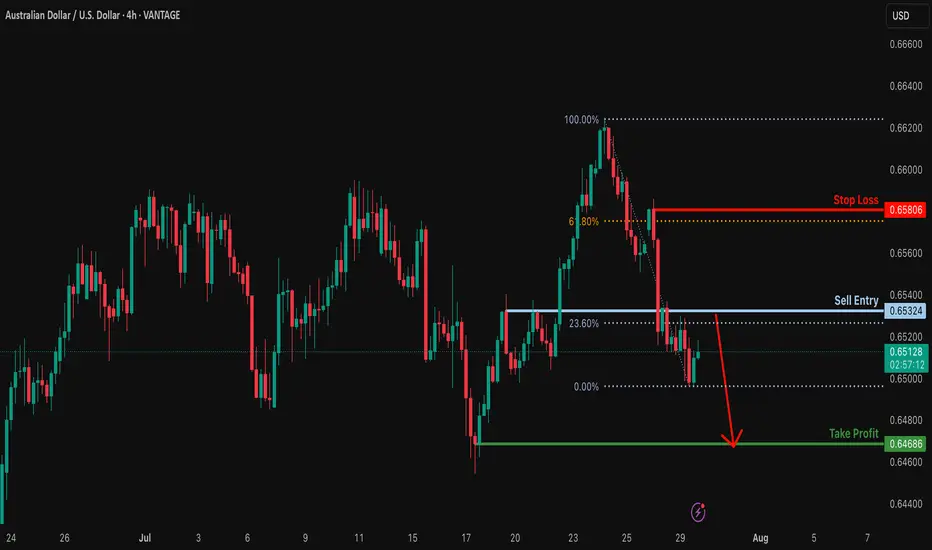
Potential bearish drop?The Aussie (AUD/USD) is rising toward the resistance level, which is a pullback resistance that is slightly above the 23.6% Fibonacci retracement and could reverse from this level to our take profit.
Entry: 0.6532
Why we like it:
There is a pullback resistance that is slightly above the 23.6% Fibonacci retracement.
Stop loss: 0.6580
Why we like it:
There is a pullback resistance that is slightly above the 61.8% Fibonacci retracement.
Take profit: 0.6467
Why we like it:
There is a swing low support.
Enjoying your TradingView experience? Review us!
TradingView (tradingview.sweetlogin.com)
Please be advised that the information presented on TradingView is provided to Vantage (‘Vantage Global Limited’, ‘we’) by a third-party provider (‘Everest Fortune Group’). Please be reminded that you are solely responsible for the trading decisions on your account. There is a very high degree of risk involved in trading. Any information and/or content is intended entirely for research, educational and informational purposes only and does not constitute investment or consultation advice or investment strategy. The information is not tailored to the investment needs of any specific person and therefore does not involve a consideration of any of the investment objectives, financial situation or needs of any viewer that may receive it. Kindly also note that past performance is not a reliable indicator of future results. Actual results may differ materially from those anticipated in forward-looking or past performance statements. We assume no liability as to the accuracy or completeness of any of the information and/or content provided herein and the Company cannot be held responsible for any omission, mistake nor for any loss or damage including without limitation to any loss of profit which may arise from reliance on any information supplied by Everest Fortune Group.
Bearish reversal off multi swing high resistance?USD/CAD is reacting off the resistance level, which is a multi-swing high resistance and could drop from this level to our take profit.
Entry: 1.3782
Why we like it:
There is a multi-swing high resistance.
Stop loss: 1.3855
Why we like it:
There is a swing high resistance that lines up with the 138.2% Fibonacci extension.
Take profit: 1.3702
Why we like it:
There is a pullback support that aligns with the 48.2% Fibonacci retracement.
Enjoying your TradingView experience? Review us!
TradingView (tradingview.sweetlogin.com)
Please be advised that the information presented on TradingView is provided to Vantage (‘Vantage Global Limited’, ‘we’) by a third-party provider (‘Everest Fortune Group’). Please be reminded that you are solely responsible for the trading decisions on your account. There is a very high degree of risk involved in trading. Any information and/or content is intended entirely for research, educational and informational purposes only and does not constitute investment or consultation advice or investment strategy. The information is not tailored to the investment needs of any specific person and therefore does not involve a consideration of any of the investment objectives, financial situation or needs of any viewer that may receive it. Kindly also note that past performance is not a reliable indicator of future results. Actual results may differ materially from those anticipated in forward-looking or past performance statements. We assume no liability as to the accuracy or completeness of any of the information and/or content provided herein and the Company cannot be held responsible for any omission, mistake nor for any loss or damage including without limitation to any loss of profit which may arise from reliance on any information supplied by Everest Fortune Group.

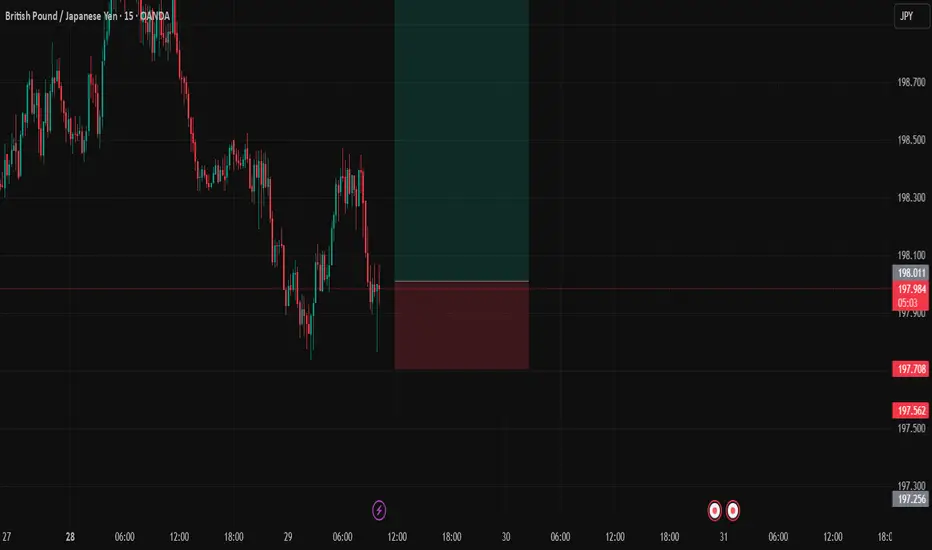
GBPJPYDate:
July 29,2025
Session:
London and New York Session
Pair:
GBPJPY
Bias:
Long
Yesterdays liquid untouched still lies. Expecting price to fill that area either by end of NY session or Asia.
Entry: 198.018
Stop Loss: 197.704
Target: 199.068
RR: 3.5
Bearish reversal for the Cable?The price is rising towards the resistance level, which is a pullback resistance that aligns with the 23.6% Fibonacci retracement and could potentially reverse from this level to our take-profit.
Entry: 1.3387
Why we like it:
There is a pullback resistance that lines up with the 23.6% Fibonacci retracement.
Stop loss: 1.3476
Why we like it:
There is a pullback resistance that aligns with the 61.8% Fibonacci retracement.
Take profit: 1.3247
Why we like it:
There is a multi-swing low support that aligns with the 78.6% Fibonacci projection.
Enjoying your TradingView experience? Review us!
TradingView (tradingview.sweetlogin.com)
Please be advised that the information presented on TradingView is provided to Vantage (‘Vantage Global Limited’, ‘we’) by a third-party provider (‘Everest Fortune Group’). Please be reminded that you are solely responsible for the trading decisions on your account. There is a very high degree of risk involved in trading. Any information and/or content is intended entirely for research, educational and informational purposes only and does not constitute investment or consultation advice or investment strategy. The information is not tailored to the investment needs of any specific person and therefore does not involve a consideration of any of the investment objectives, financial situation or needs of any viewer that may receive it. Kindly also note that past performance is not a reliable indicator of future results. Actual results may differ materially from those anticipated in forward-looking or past performance statements. We assume no liability as to the accuracy or completeness of any of the information and/or content provided herein and the Company cannot be held responsible for any omission, mistake nor for any loss or damage including without limitation to any loss of profit which may arise from reliance on any information supplied by Everest Fortune Group.

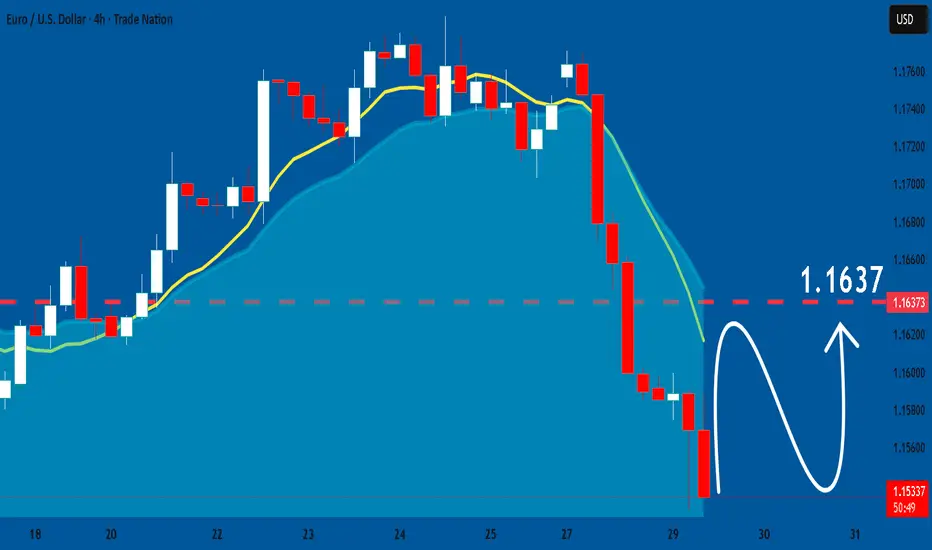
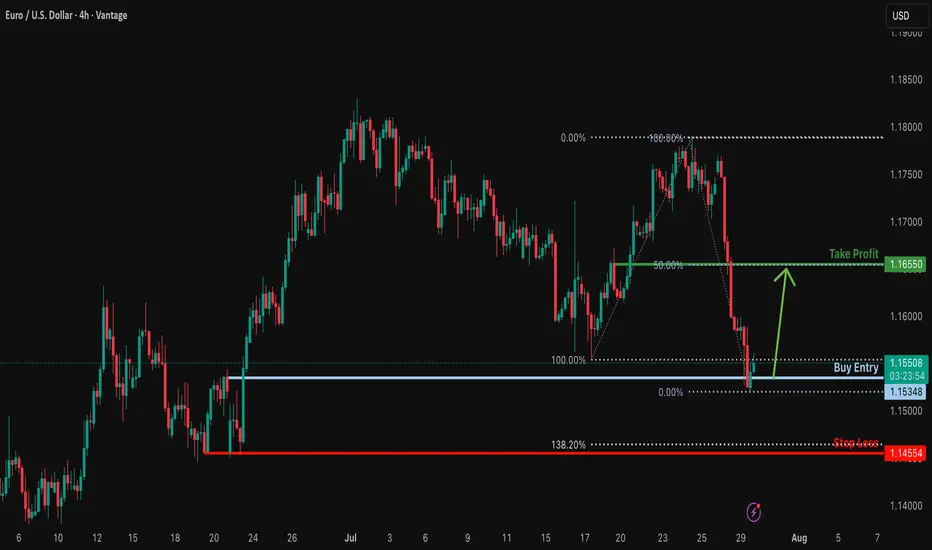
Bullish reversal?EUR/USD has bounced off the support level, which serves as a pullback support and could rise from this level to our take-profit target.
Entry: 1.1534
Why we like it:
There is a pullback support.
Stop loss: 1.1455
Why we like it:
There is a multi-swing low support.
Take profit: 1.1655
Why we like it:
There is a pullback resistance that aligns with the 50% Fibonacci retracement.
Enjoying your TradingView experience? Review us!
TradingView (tradingview.sweetlogin.com)
Please be advised that the information presented on TradingView is provided to Vantage (‘Vantage Global Limited’, ‘we’) by a third-party provider (‘Everest Fortune Group’). Please be reminded that you are solely responsible for the trading decisions on your account. There is a very high degree of risk involved in trading. Any information and/or content is intended entirely for research, educational and informational purposes only and does not constitute investment or consultation advice or investment strategy. The information is not tailored to the investment needs of any specific person and therefore does not involve a consideration of any of the investment objectives, financial situation or needs of any viewer that may receive it. Kindly also note that past performance is not a reliable indicator of future results. Actual results may differ materially from those anticipated in forward-looking or past performance statements. We assume no liability as to the accuracy or completeness of any of the information and/or content provided herein and the Company cannot be held responsible for any omission, mistake nor for any loss or damage including without limitation to any loss of profit which may arise from reliance on any information supplied by Everest Fortune Group.
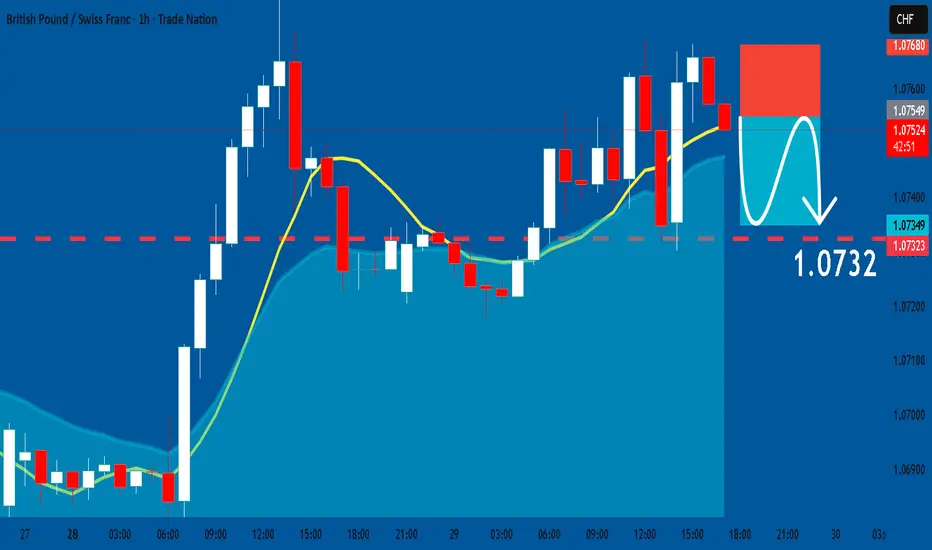
GBPCHF: Short Signal with Entry/SL/TP
GBPCHF
- Classic bearish setup
- Our team expects bearish continuation
SUGGESTED TRADE:
Swing Trade
Short GBPCHF
Entry Point - 1.0754
Stop Loss - 1.0768
Take Profit - 1.0732
Our Risk - 1%
Start protection of your profits from lower levels
Disclosure: I am part of Trade Nation's Influencer program and receive a monthly fee for using their TradingView charts in my analysis.
❤️ Please, support our work with like & comment! ❤️
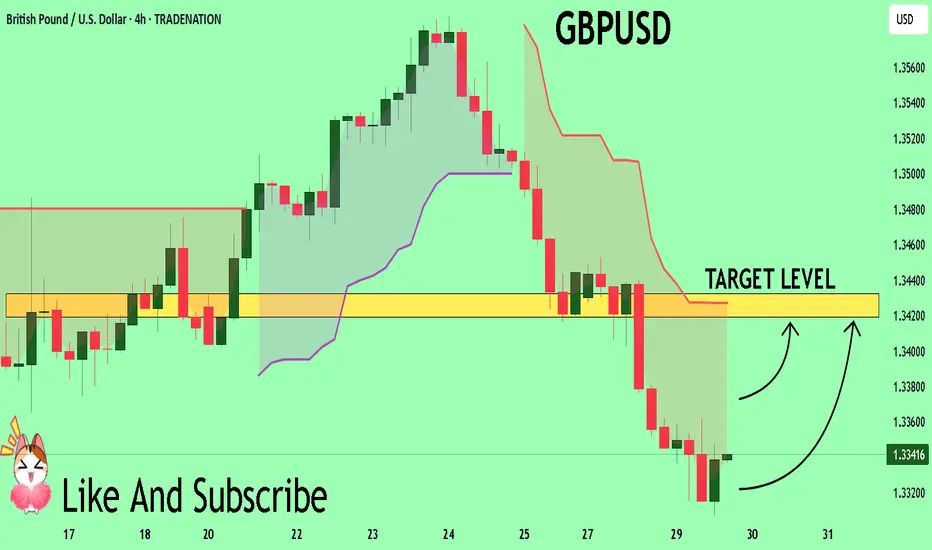
GBPUSD Will Explode! BUY!
My dear friends,
Please, find my technical outlook for GBPUSD below:
The instrument tests an important psychological level 1.3339
Bias - Bullish
Technical Indicators: Supper Trend gives a precise Bullish signal, while Pivot Point HL predicts price changes and potential reversals in the market.
Target - 1.3419
About Used Indicators:
Super-trend indicator is more useful in trending markets where there are clear uptrends and downtrends in price.
Disclosure: I am part of Trade Nation's Influencer program and receive a monthly fee for using their TradingView charts in my analysis.
———————————
WISH YOU ALL LUCK
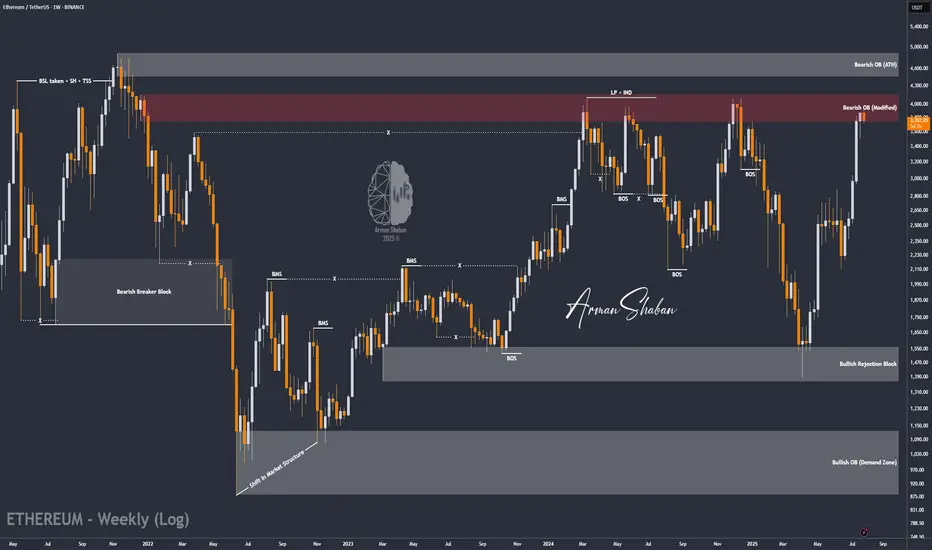
ETH/USDT | at a Crossroads – Hold Above $3440 or Sharp Fall!By analyzing the Ethereum chart on the weekly timeframe, we can see that after reaching $3940 and touching the key supply zone, ETH entered a slight correction and is currently trading around $3756. The key question now is whether it can hold above $3440 by the end of the week and push past $4000. If it does, we can expect another bullish leg toward $4100 and $4470. However, if the $3440 support fails, a sharp decline may follow — so this level is critical.
Please support me with your likes and comments to motivate me to share more analysis with you and share your opinion about the possible trend of this chart with me !
Best Regards , Arman Shaban
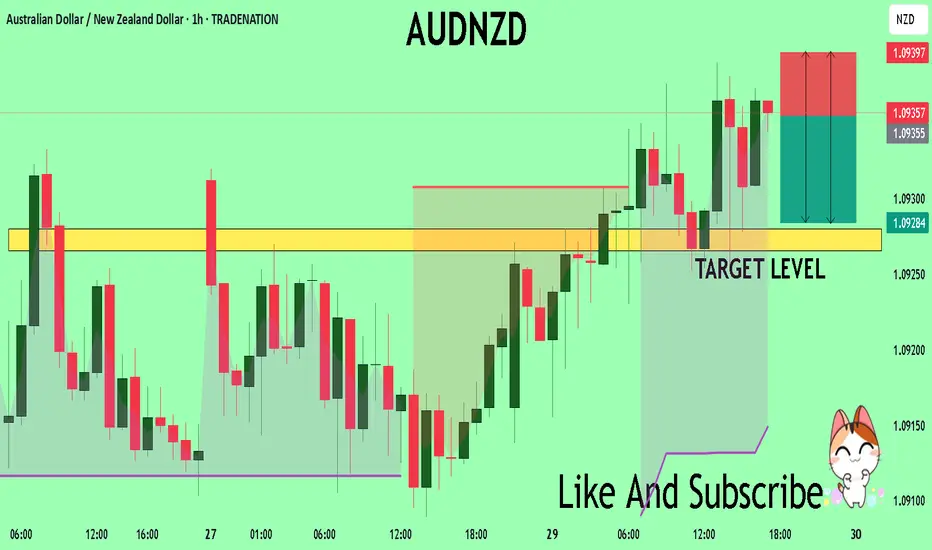
AUDNZD Technical Analysis! SELL!
My dear friends,
AUDNZD looks like it will make a good move, and here are the details:
The market is trading on 1.0935 pivot level.
Bias - Bearish
Technical Indicators: Supper Trend generates a clear short signal while Pivot Point HL is currently determining the overall Bearish trend of the market.
Goal - 1.0928
Recommended Stop Loss - 1.0939
About Used Indicators:
Pivot points are a great way to identify areas of support and resistance, but they work best when combined with other kinds of technical analysis
Disclosure: I am part of Trade Nation's Influencer program and receive a monthly fee for using their TradingView charts in my analysis.
———————————
WISH YOU ALL LUCK
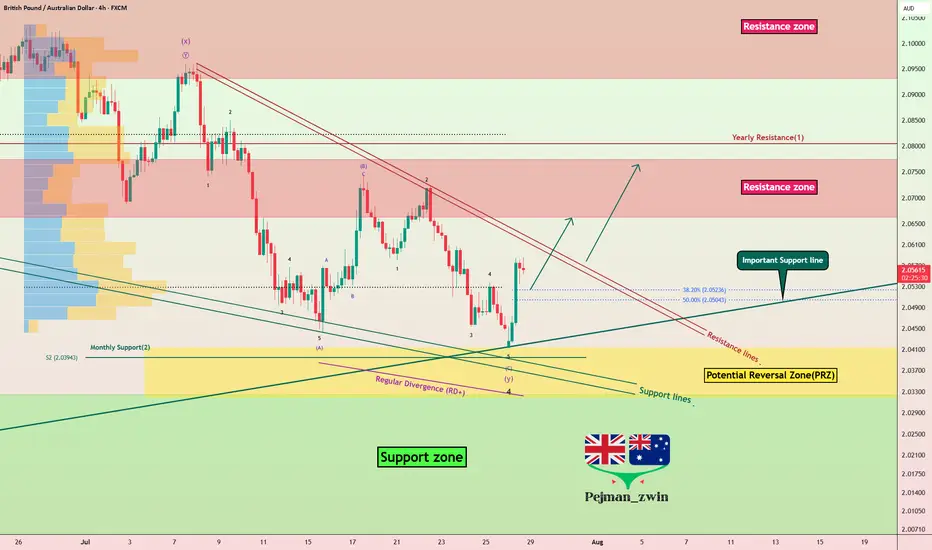
GBPAUD Reverses from Key Zone – Long Setup in Play!Today I want to share with you a Long position on GBPAUD ( OANDA:GBPAUD ).
GBPAUD started to rise well from the Important Support line , Support zone(2.032 AUD-1.987 AUD) , and Potential Reversal Zone(PRZ) and managed to close the 4-hour candle above 2.053 AUD (important) .
In terms of Elliott wave theory , GBPAUD seems to have completed the main wave 4 . The main wave 4 structure was a Double Three Correction(WXY) .
Also, along the way, we can see a Bullish Marubozu candle , which could indicate a continuation of the uptrend .
I expect GBPAUD to break the Resistance lines soon and attack the Resistance zone(2.078 AUD-2.066 AUD) .
First Target: 2.065 AUD
Second Target: 2.076 AUD
Note: Stop Loss(SL): 2.040 =Worst SL
Please respect each other's ideas and express them politely if you agree or disagree.
British Pound/ Australian Dollar Analyze (GBPAUD), 4-hour time frame.
Be sure to follow the updated ideas.
Do not forget to put a Stop loss for your positions (For every position you want to open).
Please follow your strategy and updates; this is just my Idea, and I will gladly see your ideas in this post.
Please do not forget the ✅' like '✅ button 🙏😊 & Share it with your friends; thanks, and Trade safe.
USDCHF Signals Wave 3 With Double Bottom!OANDA:USDCHF has not only formed a Double Bottom Pattern but also may be generating a potential Elliot Impulse Wave!
Bulls are giving the April & June Lows of .8038 - .8088, another go for a second time today after surpassing the first attempted High created July 17th to break above the level.
So far Price today has broken above July 17th Highs and if Bulls are able to hold this level, this would Confirm:
1) A Breakout of the Double Bottom
2) Wave 3 continuing the Impulse Wave in the Elliot Wave Theory!
The Higher Low @ .79106 created on July 25th, broke the downtrend structure as a 78.6% retracement of the Lower Low @ .78719 created July 1st which was a new 14 Year Low, finishing Wave 2 and initiating Wave 3 of the Impulse Wave.
The Extension of Wave 3 typically will end at the 1.236% or 1.618% level which gives us 2 potential Price Targets to start:
Price Target 1) .81479 - 1.236%
Price Target 2) .82213 - 1.618%
Once Wave 3 has ended, we will look for opportunities at the Wave 4 - Wave 5 juncture!

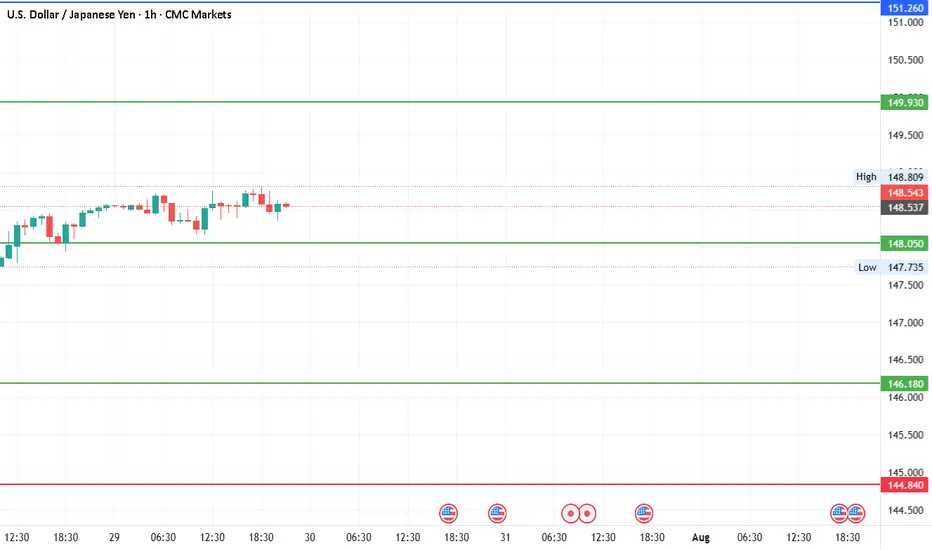
#USDJPYDate: 29-07-2025
#USDJPY Current Price: 148.53
Pivot Point: 148.049 Support: 146.177 Resistance: 149.932
Upside Targets:
Target 1: 151.264
Target 2: 152.597
Target 3: 154.303
Target 4: 156.008
Downside Targets:
Target 1: 144.839
Target 2: 143.501
Target 3: 141.796
Target 4: 140.090
#TradingView #Stocks #Equities #StockMarket #Investing #Trading #Forex
#TechnicalAnalysis #StockCharts #Currency
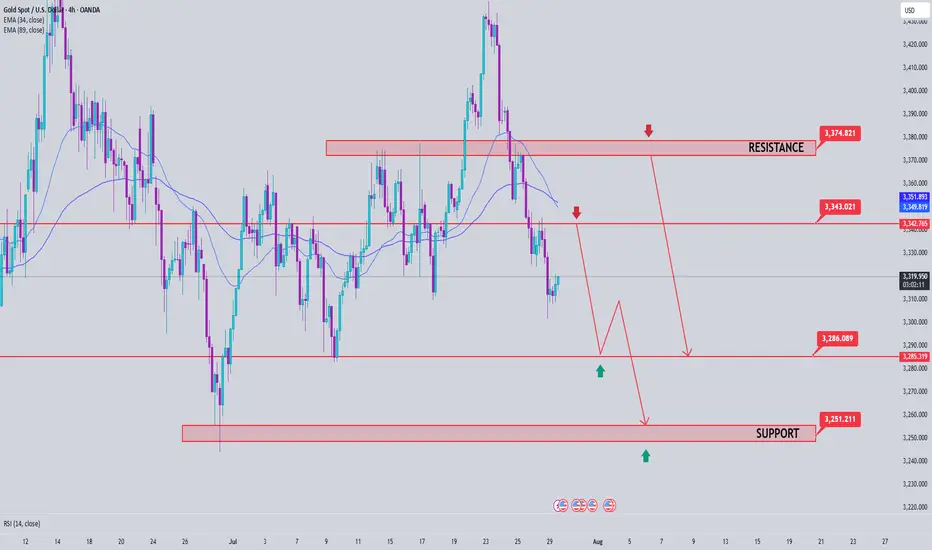
Gold Price Analysis July 29📉 XAUUSD ANALYSIS – IS THE CORRECTION OFFICIALLY STARTING?
Gold has officially broken out of the bullish wave structure and left the rising price channel – an important technical signal that the bearish correction trend has been activated. This development opens up the possibility of retests of the broken trendline, and if that happens in today's session, this could be a good opportunity to look for SELL entry points in the new trend.
📌 Short-term trading strategy:
Potential selling zone: 3343 – 3345
Downside target: 3283 first, followed by the strong liquidity zone around 3250
Confirmation of bearish force: Price continues to maintain below the 3375 area – which will act as an important resistance level. Only when the daily candle closes back above this zone will the uptrend be re-established.
✅ Reverse buying strategy if there is a strong support signal:
Buy trigger zone: Observe the price reaction around the 3285 area - there needs to be a clear bearish rejection signal (pin bar/bullish engulfing candle...)
Deeper buying zone: 3251 - where liquidity is concentrated and there is a possibility of bottom-fishing demand appearing.
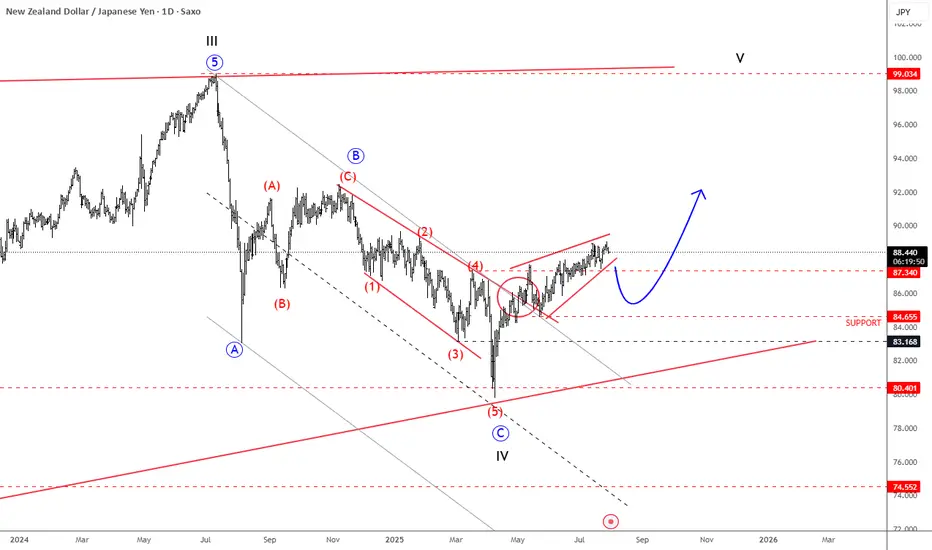
NZDJPY Is Back To Bullish ModeNZDJPY Is Back To Bullish Mode from technical and Elliott wave perspective, as we see it breaking back above trendline after a corrective decline.
NZDJPY is nicely recovering over the last few weeks after a strong rebound from 80.40 support, a key level going back to March 2023. Notice that it’s recovering after a three-wave ABC corrective decline that belongs to a higher degree wave IV correction. Current recovery looks to be in five waves, as a leading diagonal; so its a motive wave structure that already pushed above the 87.34 resistance, which is a strong bullish signal, suggesting more upside ahead. Of course, short-term pullbacks are always possible and welcome, and in that case, the 86 – 84 area could act as a nice support. But overall, we think that sooner or later the pair will target the 90 or even 92 levels, which are still possible this year. Wave V is eyeing even 100 area.
EURUSD BUYEUR/USD retreats below 1.1550 ahead of US data
EUR/USD finds it difficult to stage a rebound following Monday's sharp decline and trades in negative territory below 1.1550 on Tuesday. The US Dollar (USD) preserves its strength ahead of consumer sentiment and employment-related data releases, weighing on the pair.
From a technical point of view, the EUR/USD pair is poised to extend its slump. It keeps falling below a mildly bearish 20 Simple Moving Average (SMA), which provides dynamic resistance at around 1.1690. The 100 SMA, in the meantime, maintains its bullish slope, albeit partially losing its upward strength at around 1.1340. Finally, technical indicators keep heading south well below their midlines, and at multi-week lows, in line with a bearish extension ahead.
The near-term picture shows EUR/USD is oversold and may bounce or consolidate before the next directional move. In the 4-hour chart, technical indicators turned flat at extreme levels, yet it keeps developing below all its moving averages, which skews the risk to the downside. A firmly bearish 20 SMA is crossing below the 100 SMA and aims to extend its slide below a directionless 200 SMA, usually a sign of prevalent selling interest.
SUPPORT 1.15566
SUPPORT 1.15819
SUPPORT 1.15566
RESISTANCE 1.15114

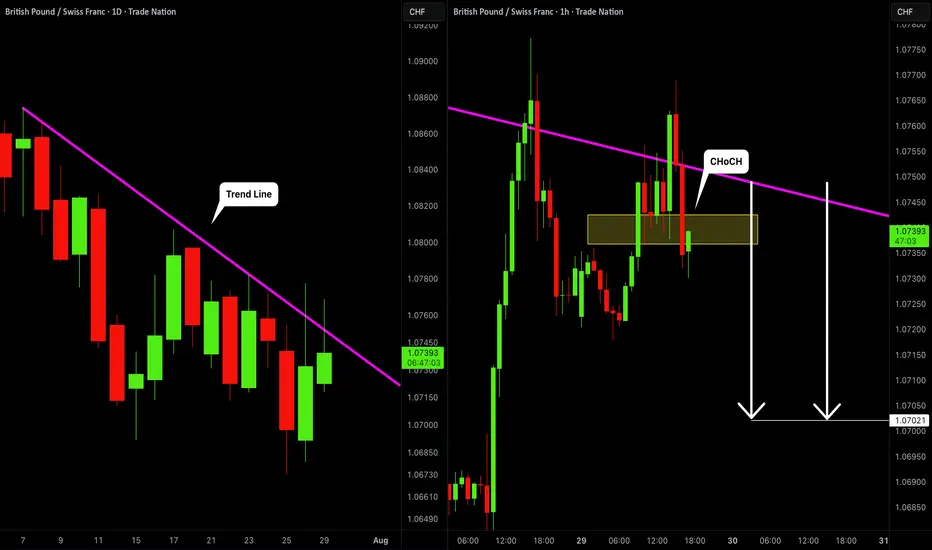
GBPCHF: Bearish Movement Confirmed 🇬🇧🇨🇭
GBPCHF looks bearish after the news today.
The price tested a solid rising trend line on a daily
and formed a confirmed bearish Change of Character
on an hourly time frame.
I think that the price will continue falling and reach 1.0702 level.
❤️Please, support my work with like, thank you!❤️
I am part of Trade Nation's Influencer program and receive a monthly fee for using their TradingView charts in my analysis.
EURUSD: Bullish Continuation is Expected! Here is Why:
Remember that we can not, and should not impose our will on the market but rather listen to its whims and make profit by following it. And thus shall be done today on the EURUSD pair which is likely to be pushed up by the bulls so we will buy!
Disclosure: I am part of Trade Nation's Influencer program and receive a monthly fee for using their TradingView charts in my analysis.
❤️ Please, support our work with like & comment! ❤️