NZD/JPY BEARS ARE STRONG HERE|SHORT
Hello, Friends!
Previous week’s green candle means that for us the NZD/JPY pair is in the uptrend. And the current movement leg was also up but the resistance line will be hit soon and upper BB band proximity will signal an overbought condition so we will go for a counter-trend short trade with the target being at 88.302.
Disclosure: I am part of Trade Nation's Influencer program and receive a monthly fee for using their TradingView charts in my analysis.
✅LIKE AND COMMENT MY IDEAS✅
Forex

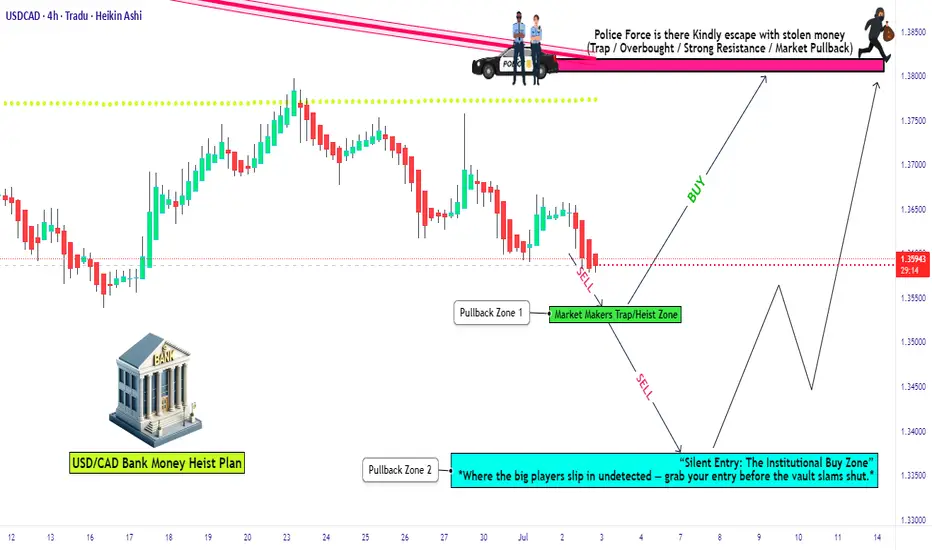
USD/CAD Institutional Buy Zone – Thief Trading Alert!🔥 USD/CAD "LOONIE BANK HEIST" 🔥 – THIEF TRADING STYLE (BULLISH SNIPER PLAN)
💸 ATTENTION: Market Robbers & Profit Pirates!
"Steal Like a Pro – Escape Before the Cops Arrive!"
🎯 MASTER TRADE PLAN (Based on Thief Trading Tactics):
Entry Zone (Pullback Heist):
📌 Pullback-1: Market Maker Trap Zone (1.35400+) – Wait for retest!
📌 Pullback-2: Institutional Buy Zone (1.33500+) – Confirm bullish momentum!
"Patience = Perfect Heist Timing. Don’t rush—ambush the trend!"
🎯 Profit Target: 1.38100 (or escape earlier if momentum fades).
🛑 Stop Loss (Escape Route): Nearest 4H Swing Low (wick/close) – Adjust based on risk & lot size!
🚨 SCALPERS’ WARNING:
"Only snipe LONG! Big pockets? Strike now. Small stack? Join swing robbers & trail your SL!"
📉 WHY THIS HEIST? (Bullish Triggers):
Technical + Fundamental alignment (COT, Macro, Sentiment).
Overbought but institutional demand holding strong.
"Bears are trapped—time to rob their stops!"
⚠️ CRITICAL ALERT:
News = Volatility = Police Ambush!
Avoid new trades during high-impact news.
Trailing SL = Your Getaway Car! Lock profits before reversals.
💥 BOOST THIS HEIST!
"Hit 👍, 🔔 Follow, and 🚀 Boost to fuel our next robbery! Let’s drain the banks together!"
🔮 NEXT HEIST COMING SOON… Stay tuned, partner! 🎭💰
GBPUSDHello Traders! 👋
What are your thoughts on GBPUSD?
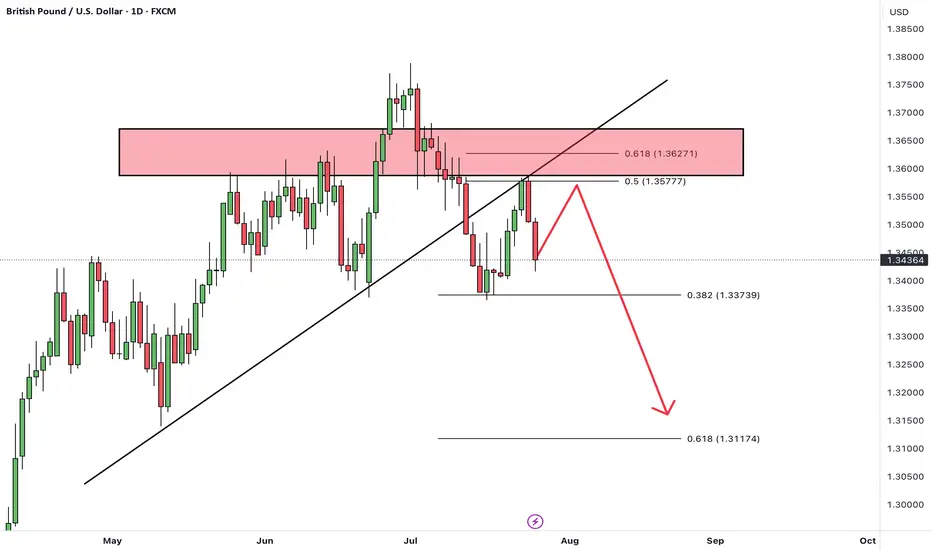
GBP/USD has broken below a trendline and has completed a retest (pullback) to the broken level.
The pair is now positioned for a potential downward move.
After some short-term consolidation, we expect price to drop at least toward the next identified support level.
As long as GBP/USD stays below the broken trendline, the bearish bias remains valid, and further downside is likely.
Don’t forget to like and share your thoughts in the comments! ❤️
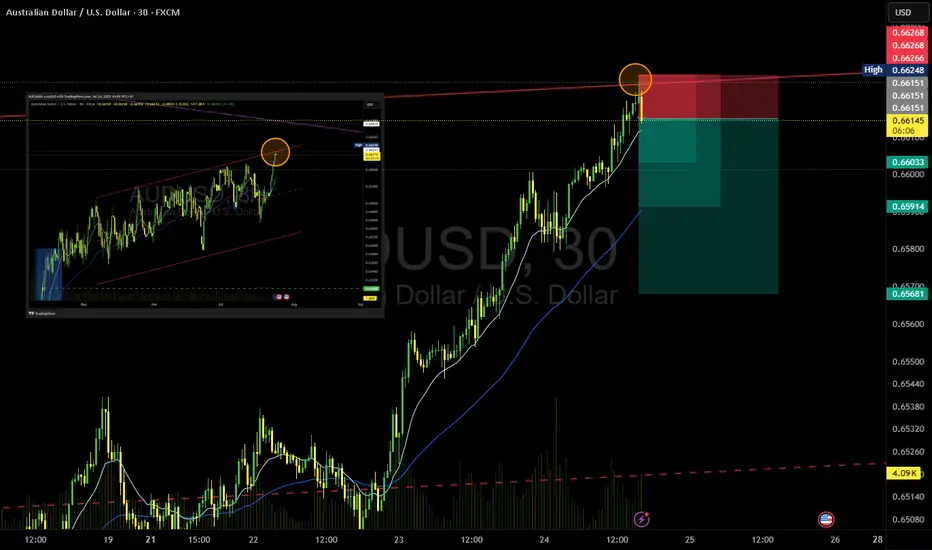
AUD/USD Sell SetupOANDA:AUDUSD
Timeframe: m30
Entry: 0.66151
SL: 0.66266
TP1: 0.66033
TP2: 0.65914
TP4: 0.65681
📊 Setup Rationale
🔺 Channel Top Rejection (8H Overlay) Price has touched the upper boundary of a descending channel visible on the 8-hour chart. This zone has historically acted as a strong resistance, increasing the probability of a reversal.
🧱 Local Structure (30min) Entry aligns with a minor double top (in lower TFs) and bearish momentum. The tight SL allows for a high R:R profile.
🔄 Momentum Shift Watch for bearish engulfing or rejection wick on lower timeframes to confirm entry.
#MJTrading #Forex #AUDUSD #Sell
Psychology always matters:
CHF_JPY RISKY SHORT|
✅CHF_JPY is going up now
But a strong resistance level is ahead at 186.036
Thus I am expecting a pullback
And a move down towards the target of 185.329
SHORT🔥
✅Like and subscribe to never miss a new idea!✅
Disclosure: I am part of Trade Nation's Influencer program and receive a monthly fee for using their TradingView charts in my analysis.

CAD-CHF Local Rebound Ahead! Buy!
Hello,Traders!
CAD-CHF made a retest
Of the horizontal support
At 0.5797 from where we
Are already seeing a bullish
Reaction so we will be
Expecting a further local
Bullish move up
Buy!
Comment and subscribe to help us grow!
Check out other forecasts below too!
Disclosure: I am part of Trade Nation's Influencer program and receive a monthly fee for using their TradingView charts in my analysis.

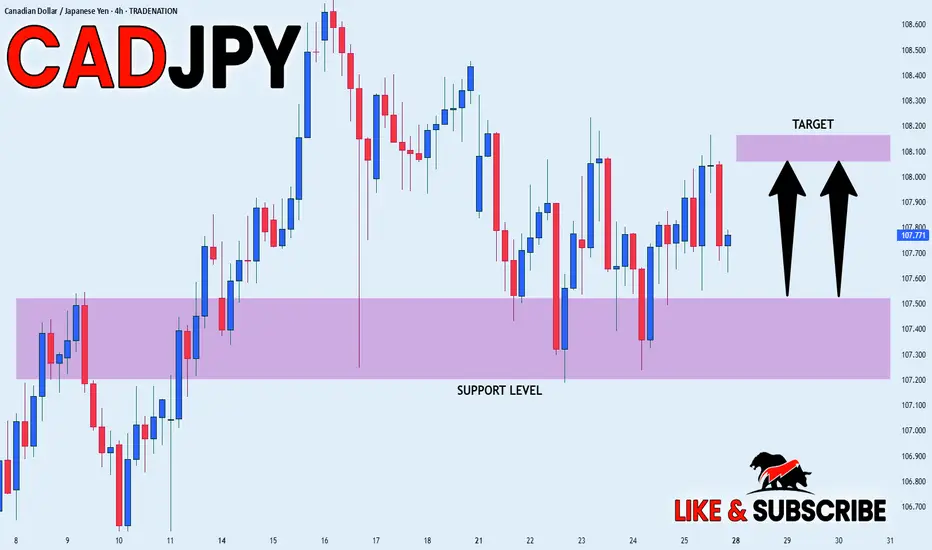
CAD_JPY WILL GO UP|LONG|
✅CAD_JPY will soon retest a key support level of 107.500
So I think that the pair will make a rebound
And go up to retest the supply level above at 108.100
LONG🚀
✅Like and subscribe to never miss a new idea!✅
Disclosure: I am part of Trade Nation's Influencer program and receive a monthly fee for using their TradingView charts in my analysis.
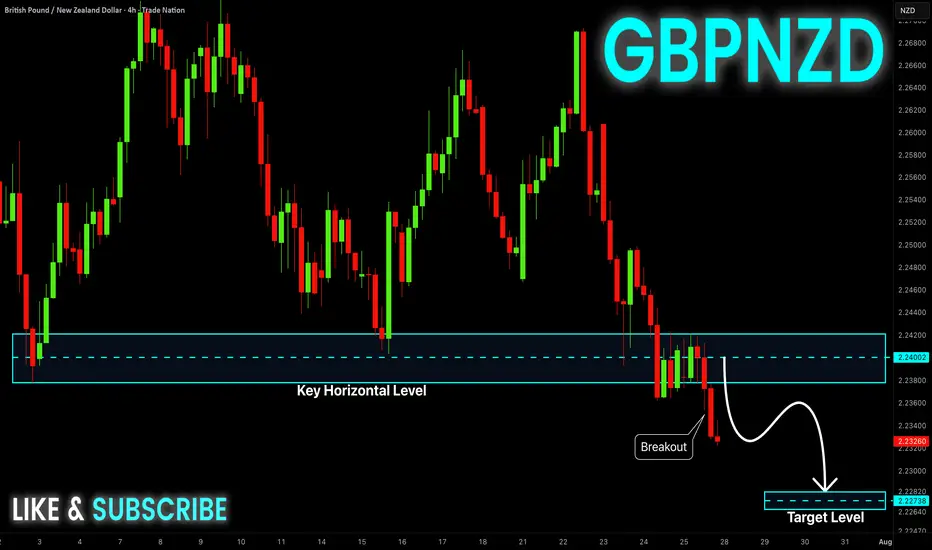
GBP-NZD Will Keep Falling! Sell!
Hello,Traders!
GBP-NZD keeps falling down
And the pair made a strong
Bearish breakout of the key
Horizontal key level of 2.2400
And the breakout is confirmed
So we are bearish biased and
We will be expecting a further
Bearish move down on Monday
Sell!
Comment and subscribe to help us grow!
Check out other forecasts below too!
Disclosure: I am part of Trade Nation's Influencer program and receive a monthly fee for using their TradingView charts in my analysis.
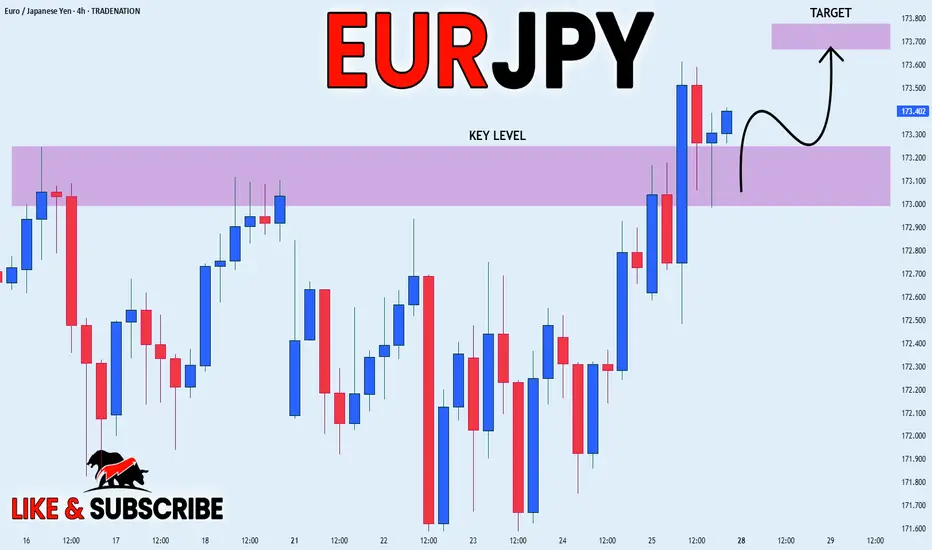
EUR_JPY WILL GROW|LONG|
✅EUR_JPY will keep growing
Because the pair is in the uptrend
And recently broke the key level of 173.200
So we will be expecting
Bullish continuation
LONG🚀
✅Like and subscribe to never miss a new idea!✅
Disclosure: I am part of Trade Nation's Influencer program and receive a monthly fee for using their TradingView charts in my analysis.
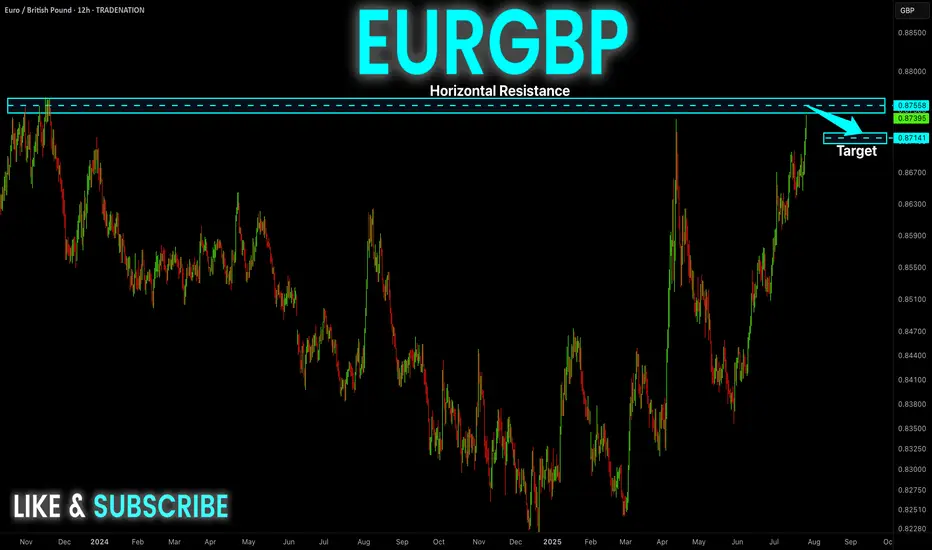
EUR-GBP Swing Short! Sell!
Hello,Traders!
EUR-GBP keeps growing in
A strong uptrend but the pair
Is locally overbought so after
The price hits a horizontal
Resistance level of 0.8764
We will be expecting a
Local bearish correction
Sell!
Comment and subscribe to help us grow!
Check out other forecasts below too!
Disclosure: I am part of Trade Nation's Influencer program and receive a monthly fee for using their TradingView charts in my analysis.
USDJPY Breakout and Potential RetraceHey Traders, in today's trading session we are monitoring USDJPY for a buying opportunity around 146.300 zone, USDJPY was trading in a downtrend and successfully managed to break it out. Currently is in a correction phase in which it is approaching the retrace area at 146.300 support and resistance area.
Trade safe, Joe.

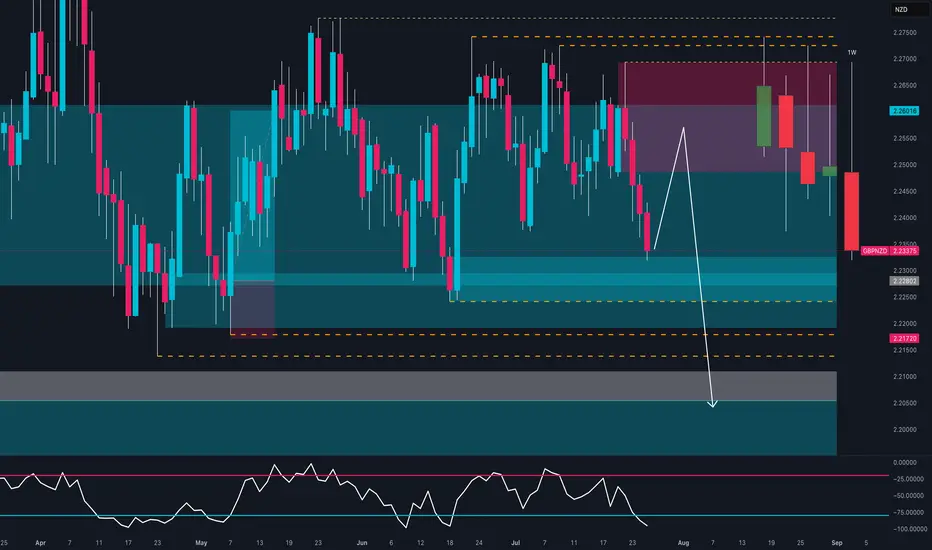
GBPNZD Breakdown – Smart Money Turns Fully Bearish🧠 Macro + COT + Sentiment Context
Commitment of Traders (COT) – Asset Managers
Institutional asset managers are significantly net short on GBPNZD, with positioning at its lowest level of the year and declining sharply since May. This reflects a clear bearish stance from smart money and reinforces the current downward pressure.
Sentiment & Momentum Indicators
DPO: -54.9 → Indicates a moderately bearish momentum phase.
Wyckoff: -20.3 → Price is in a distribution phase, suggesting weakness.
Speed: 3.2 → Low acceleration, but directional bias remains bearish.
Market Mood: Neutral, but leaning into oversold territory.
Seasonality (July 1st – Sept 30th)
Historically, GBPNZD performs positively in this period:
3Y: +1.7%, 5Y: +1.6%, 10Y: +2.3%, 15Y: +2.8%
However, in 2025, price is diverging sharply from seasonal norms. The pair is trading against historical patterns, suggesting a seasonal anomaly where institutional flow is dominating historical behavior.
🧱 Technical Outlook (Daily Chart)
GBPNZD had been consolidating in a clear range between 2.2170 support and 2.2750 resistance since May. The pair has now broken down with a strong, full-bodied weekly candle, closing below the 2.2320 demand zone.
Key Technical Zones:
Supply zone (2.2494–2.2659) → A clear rejection zone that initiated the current selloff.
Demand zone (2.2170–2.2300) → Has been tested twice already, increasing the probability of a clean breakdown.
RSI (Daily) → Currently neutral, with a sequence of lower highs and no bullish divergence in sight — indicating weak momentum.
✅ Conclusion & Trade Plan
Directional Bias: Bearish (Short)
Although seasonality typically supports bullish price action for GBPNZD in Q3, the current context is decisively bearish. Institutional positioning, price structure, and sentiment all confirm a potential shift in direction, reinforced by a confirmed weekly breakdown.
Bearish Targets:
📍 First: 2.2170 (recent support test)
📍 Second: 2.2000–2.1900 (April swing low)
📍 Extension: 2.1750 (base of previous accumulation zone)
Invalidation Criteria:
A weekly close above 2.2490 (supply zone breached)
Bullish RSI divergence + weekly recovery candle
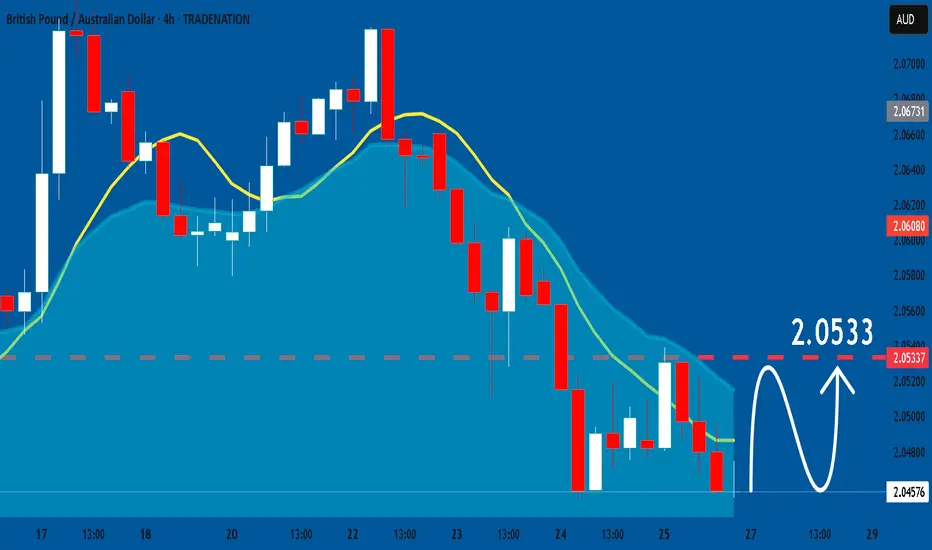
GBPAUD: Bullish Forecast & Outlook
Balance of buyers and sellers on the GBPAUD pair, that is best felt when all the timeframes are analyzed properly is shifting in favor of the buyers, therefore is it only natural that we go long on the pair.
Disclosure: I am part of Trade Nation's Influencer program and receive a monthly fee for using their TradingView charts in my analysis.
❤️ Please, support our work with like & comment! ❤️
SPY: Bearish Continuation & Short Signal
SPY
- Classic bearish setup
- Our team expects bearish continuation
SUGGESTED TRADE:
Swing Trade
Short SPY
Entry Point - 637.01
Stop Loss - 638.57
Take Profit - 633.58
Our Risk - 1%
Start protection of your profits from lower levels
Disclosure: I am part of Trade Nation's Influencer program and receive a monthly fee for using their TradingView charts in my analysis.
❤️ Please, support our work with like & comment! ❤️

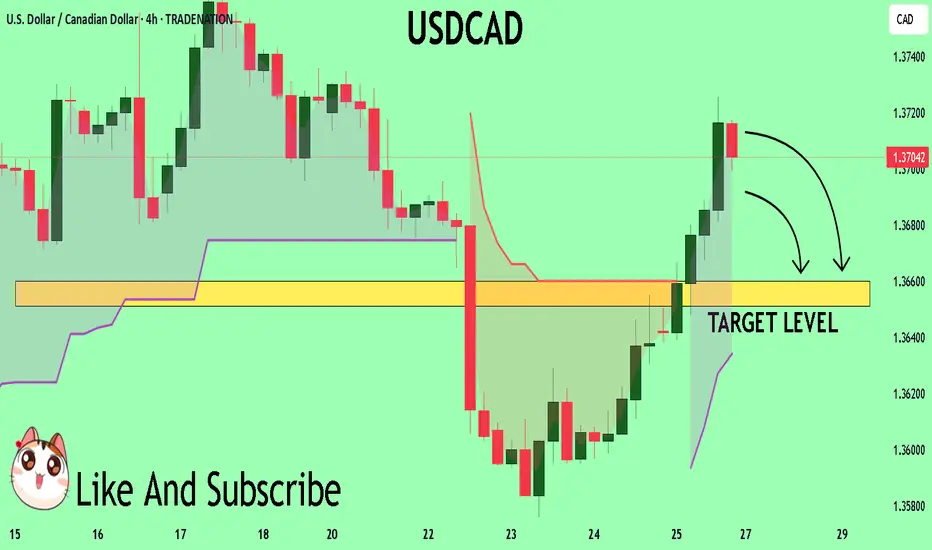
USDCAD Buyers In Panic! SELL!
My dear subscribers,
This is my opinion on the USDCAD next move:
The instrument tests an important psychological level 1.3704
Bias - Bearish
Technical Indicators: Supper Trend gives a precise Bearish signal, while Pivot Point HL predicts price changes and potential reversals in the market.
Target - 1.3660
About Used Indicators:
On the subsequent day, trading above the pivot point is thought to indicate ongoing bullish sentiment, while trading below the pivot point indicates bearish sentiment.
Disclosure: I am part of Trade Nation's Influencer program and receive a monthly fee for using their TradingView charts in my analysis.
———————————
WISH YOU ALL LUCK
QQQ Massive Short! SELL!
My dear followers,
This is my opinion on the QQQ next move:
The asset is approaching an important pivot point 566.35
Bias - Bearish
Safe Stop Loss - 567.41
Technical Indicators: Supper Trend generates a clear short signal while Pivot Point HL is currently determining the overall Bearish trend of the market.
Goal - 564.18
About Used Indicators:
For more efficient signals, super-trend is used in combination with other indicators like Pivot Points.
Disclosure: I am part of Trade Nation's Influencer program and receive a monthly fee for using their TradingView charts in my analysis.
———————————
WISH YOU ALL LUCK

SILVER: Expecting Bullish Continuation! Here is Why:
The charts are full of distraction, disturbance and are a graveyard of fear and greed which shall not cloud our judgement on the current state of affairs in the SILVER pair price action which suggests a high likelihood of a coming move up.
Disclosure: I am part of Trade Nation's Influencer program and receive a monthly fee for using their TradingView charts in my analysis.
❤️ Please, support our work with like & comment! ❤️

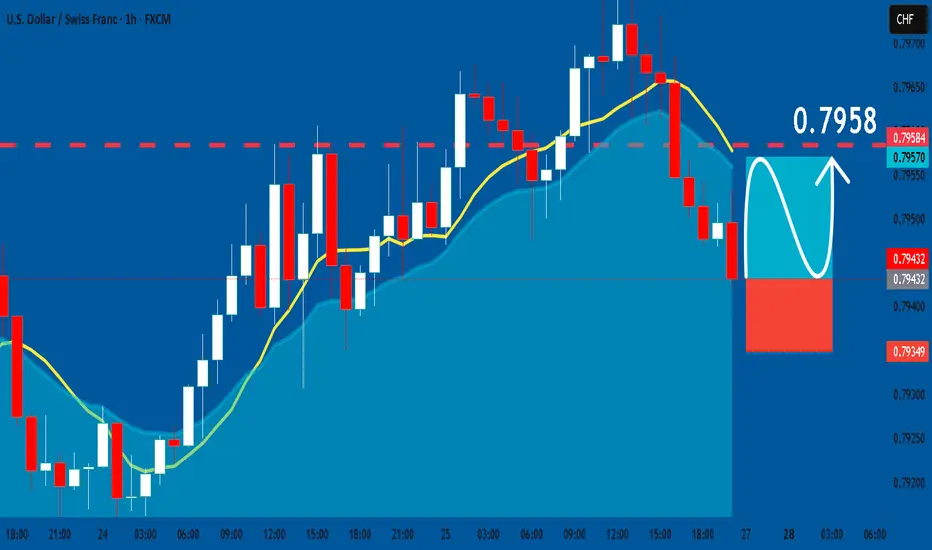
USDCHF: Long Signal Explained
USDCHF
- Classic bullish formation
- Our team expects pullback
SUGGESTED TRADE:
Swing Trade
Long USDCHF
Entry - 0.7943
Sl - 0.7934
Tp - 0.7958
Our Risk - 1%
Start protection of your profits from lower levels
Disclosure: I am part of Trade Nation's Influencer program and receive a monthly fee for using their TradingView charts in my analysis.
❤️ Please, support our work with like & comment! ❤️
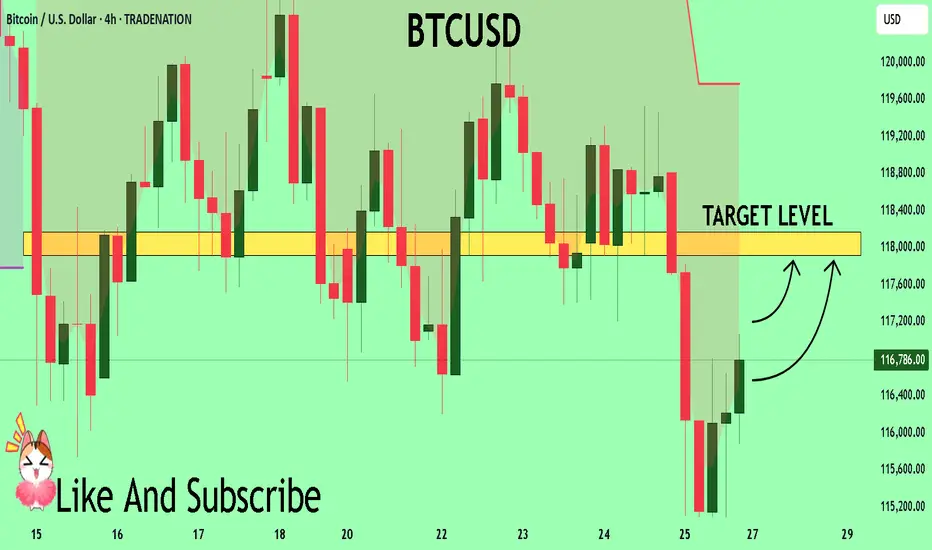
BTCUSD What Next? BUY!
My dear friends,
Please, find my technical outlook for BTCUSD below:
The price is coiling around a solid key level - 11678
Bias - Bullish
Technical Indicators: Pivot Points High anticipates a potential price reversal.
Super trend shows a clear buy, giving a perfect indicators' convergence.
Goal - 11791
About Used Indicators:
The pivot point itself is simply the average of the high, low and closing prices from the previous trading day.
Disclosure: I am part of Trade Nation's Influencer program and receive a monthly fee for using their TradingView charts in my analysis.
———————————
WISH YOU ALL LUCK
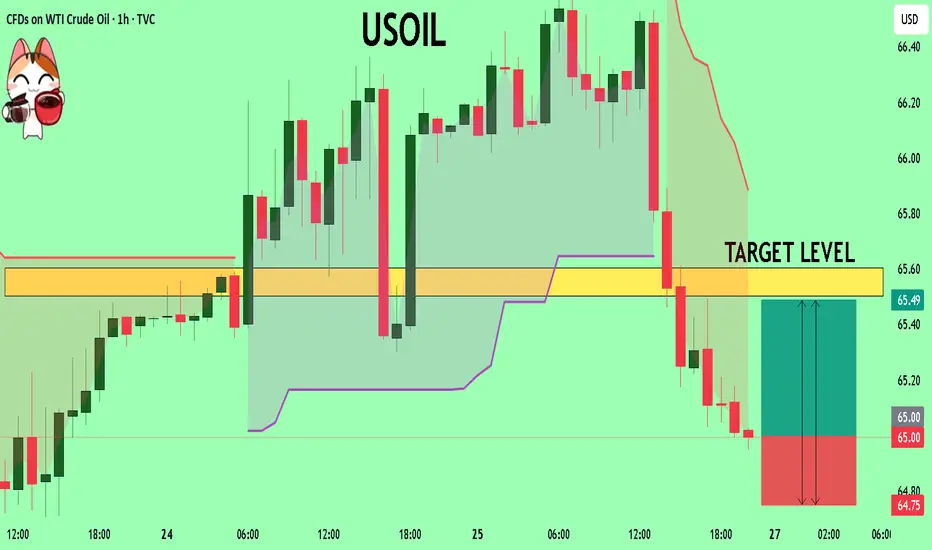
USOIL My Opinion! BUY!
My dear friends,
Please, find my technical outlook for USOIL below:
The instrument tests an important psychological level 65.00
Bias - Bullish
Technical Indicators: Supper Trend gives a precise Bullish signal, while Pivot Point HL predicts price changes and potential reversals in the market.
Target - 65.50
Recommended Stop Loss - 64.75
About Used Indicators:
Super-trend indicator is more useful in trending markets where there are clear uptrends and downtrends in price.
Disclosure: I am part of Trade Nation's Influencer program and receive a monthly fee for using their TradingView charts in my analysis.
———————————
WISH YOU ALL LUCK
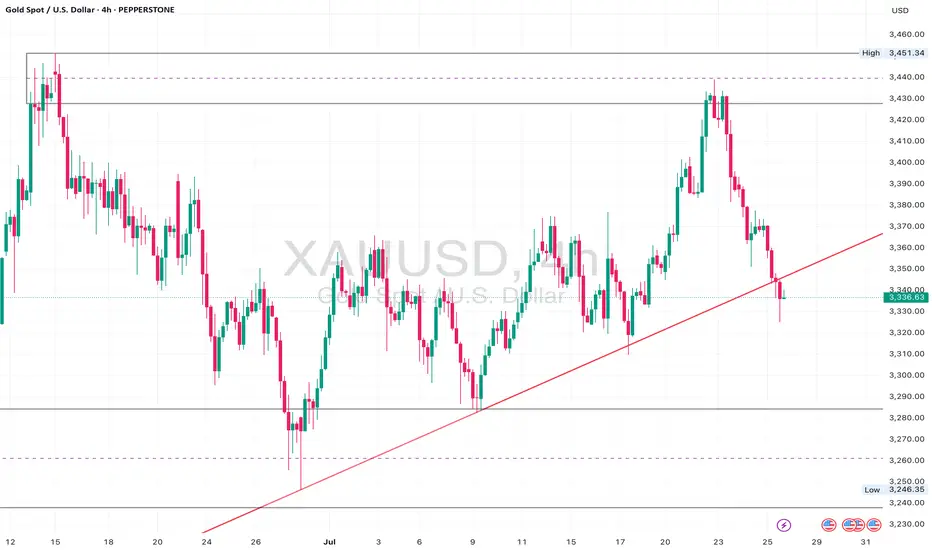
Gold Approaching 3365 Breakout: Bullish Continuation Above TrendDaily Analysis:
Price is respecting the long-term trendline support and still holding firmly above the 3300 region. Bulls are defending structure with a clean series of higher lows. No major change in trend as long as price remains above 3246.
4H Analysis:
Price is consolidating above the trendline and building structure around 3350. A clean break and close above 3365 could ignite a push toward the 3450 supply zone.
1H Analysis:
Descending trendline break confirmed with bullish closure. Retest holding well above 3350. If structure remains intact, next short-term target is 3375–3390.
Confirmation & Entry:
Break and close above 3365 with strong bullish candle = confirmation. Optional entry on 3350–3355 retest. Targets: 3390, 3450.
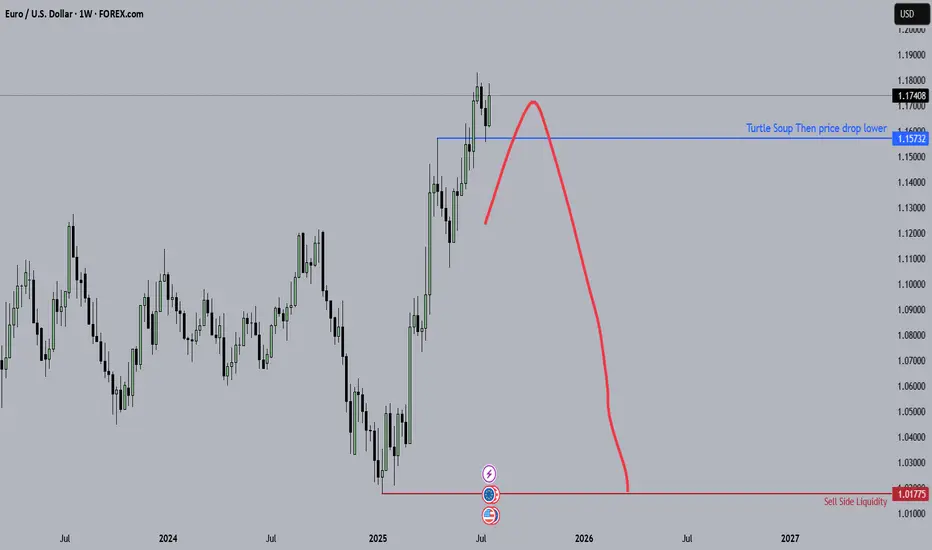
Fiber (EU) This is my Analysis for the Eurousd, Fiber has been in down trend for years now and comparing the US Central bank interest rates with the European Central bank it shows that the Dollar is Stronger compared to the Euro, Blending the Fundamentals with Technical Analysis.
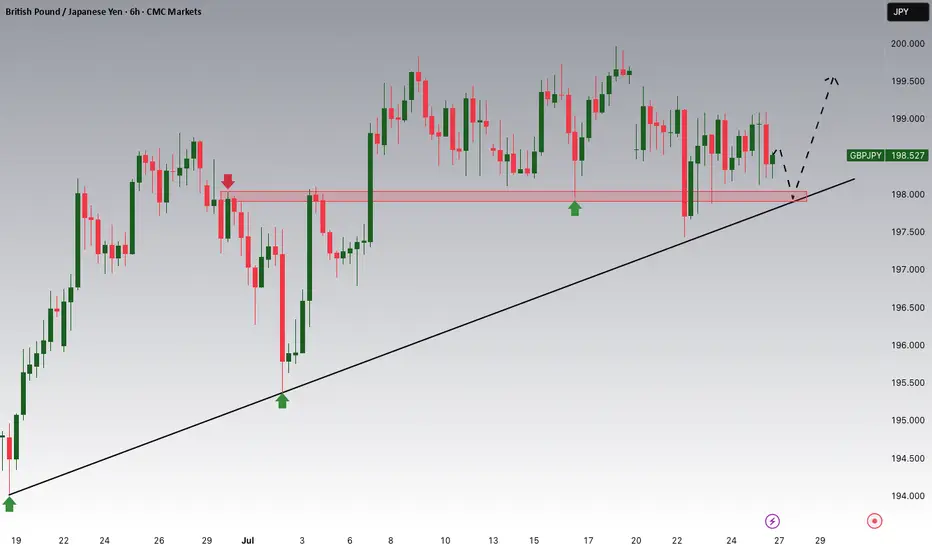
GBPJPY Potential UpsidesHey Traders, in the coming week we are monitoring GBPJPY for a buying opportunity around 197.900 zone, GBPJPY is trading in an uptrend and currently is in a correction phase in which it is approaching the trend at 197.900 support and resistance area.
Trade safe, Joe.