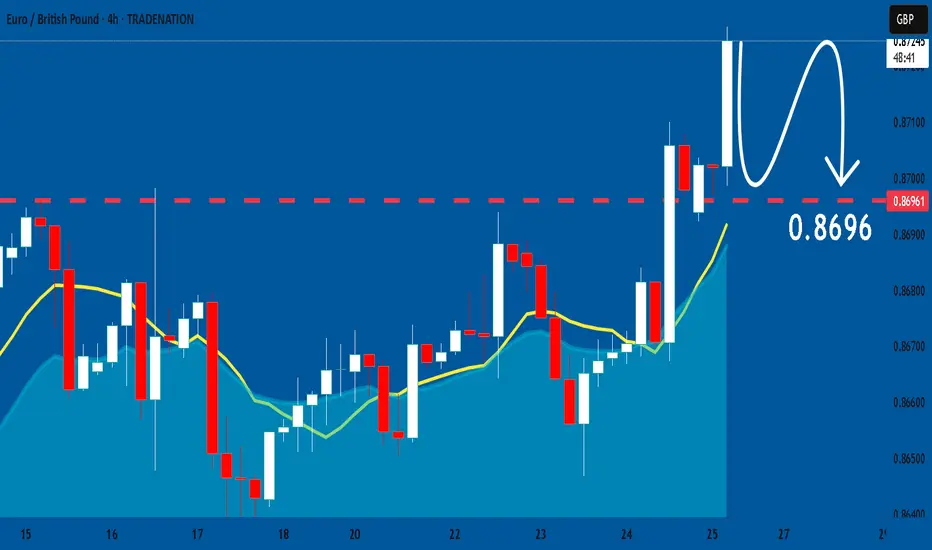
EURGBP near the current highest point of 2025.FX_IDC:EURGBP is slowly approaching a strong area of resistance, which is the current highest point of 2025. Let's dig in...
MARKETSCOM:EURGBP
Let us know what you think in the comments below.
Thank you.
75.2% of retail investor accounts lose money when trading CFDs with this provider. You should consider whether you understand how CFDs work and whether you can afford to take the high risk of losing your money. Past performance is not necessarily indicative of future results. The value of investments may fall as well as rise and the investor may not get back the amount initially invested. This content is not intended for nor applicable to residents of the UK. Cryptocurrency CFDs and spread bets are restricted in the UK for all retail clients.
Forex

USDNOK short potential setupUSDNOK recently broke down below the monthly 50ema (overlayed on this 4h chart) and has rejected off the daily 20ema (overlayed) twice this week. RSI is showing bearish momentum after a brief overbought period while the PA has remained in a strong downtrend. Short setup potential is evident but not certain.
I'm a cat not a financial advisor.

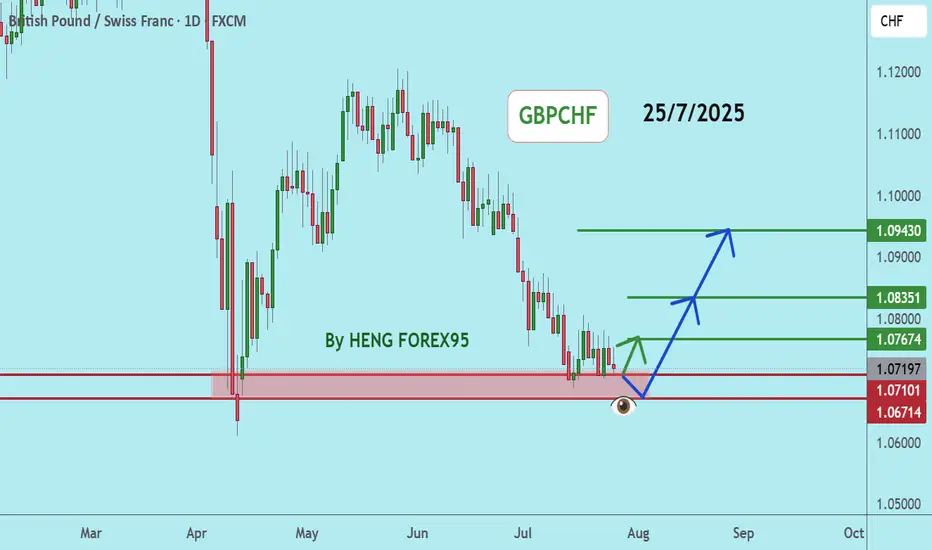
GBPCHFGBPCHF price is near the main support zone 1.07101-1.06714. If the price cannot break through the 1.06714 level, it is expected that the price will rebound. Consider buying the red zone.
🔥Trading futures, forex, CFDs and stocks carries a risk of loss.
Please consider carefully whether such trading is suitable for you.
>>GooD Luck 😊
❤️ Like and subscribe to never miss a new idea!
GBPCAD: Growth & Bullish Continuation
The price of GBPCAD will most likely increase soon enough, due to the demand beginning to exceed supply which we can see by looking at the chart of the pair.
Disclosure: I am part of Trade Nation's Influencer program and receive a monthly fee for using their TradingView charts in my analysis.
❤️ Please, support our work with like & comment! ❤️

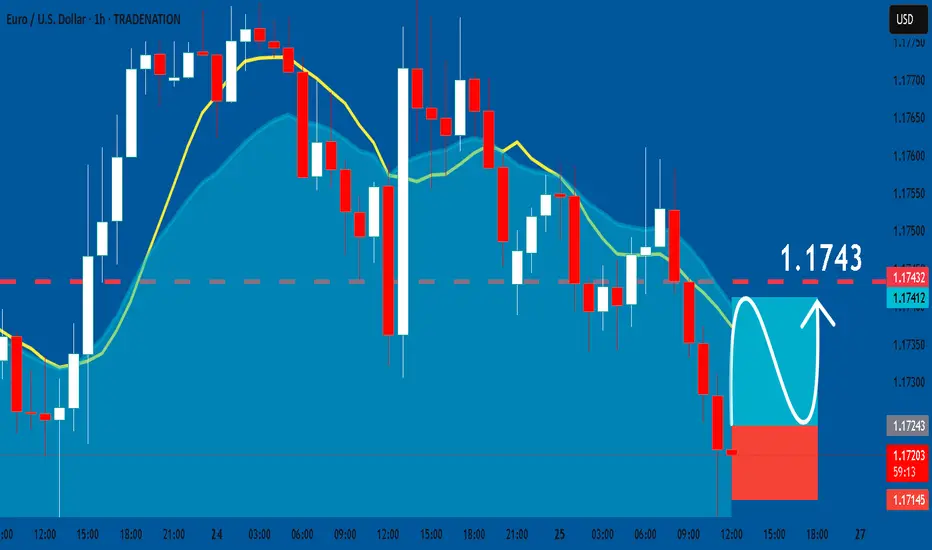
EURUSD: Long Signal with Entry/SL/TP
EURUSD
- Classic bullish pattern
- Our team expects retracement
SUGGESTED TRADE:
Swing Trade
Buy EURUSD
Entry - 1.1724
Stop - 1.1714
Take - 1.1743
Our Risk - 1%
Start protection of your profits from lower levels
Disclosure: I am part of Trade Nation's Influencer program and receive a monthly fee for using their TradingView charts in my analysis.
❤️ Please, support our work with like & comment! ❤️
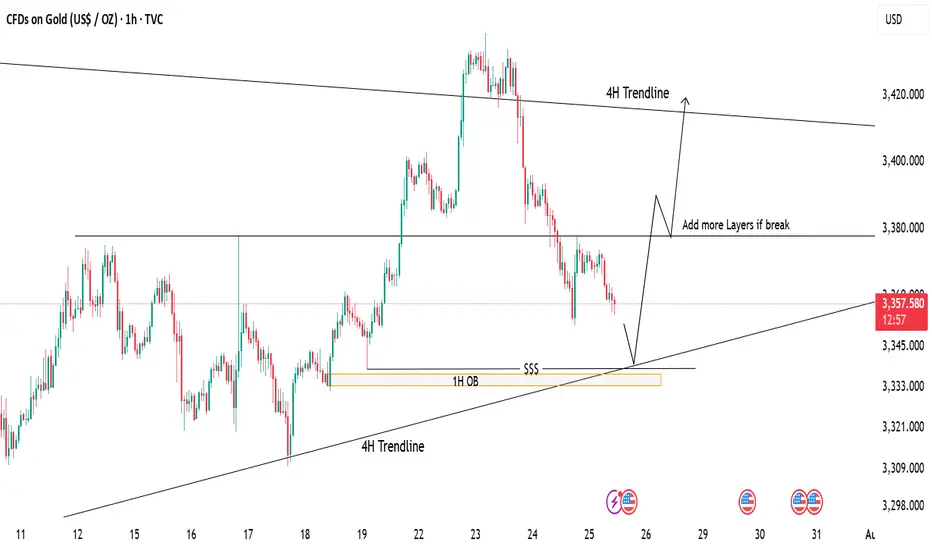
Gold Tapping Into Major Support – Eyes on Bullish ReversalPrice is currently retracing after a strong drop from recent highs. We're now approaching a key demand zone, aligning with:
📍 1H Order Block (OB)
📍 4H Trendline Support
📍 Liquidity Zone ($$$)
📉 If price taps into this area, it may offer a high-probability long setup.
📈 First target: 3380 (mid-range resistance)
🧱 If this breaks, we can look to scale in/add more positions, targeting the 4H trendline zone near 3420.
⚠️ Waiting for price reaction at support – patience is key!
GBPNZD Will Explode! BUY!
My dear friends,
My technical analysis for GBPNZD is below:
The market is trading on 2.2361 pivot level.
Bias - Bullish
Technical Indicators: Both Super Trend & Pivot HL indicate a highly probable Bullish continuation.
Target - 2.2454
About Used Indicators:
A pivot point is a technical analysis indicator, or calculations, used to determine the overall trend of the market over different time frames.
Disclosure: I am part of Trade Nation's Influencer program and receive a monthly fee for using their TradingView charts in my analysis.
———————————
WISH YOU ALL LUCK

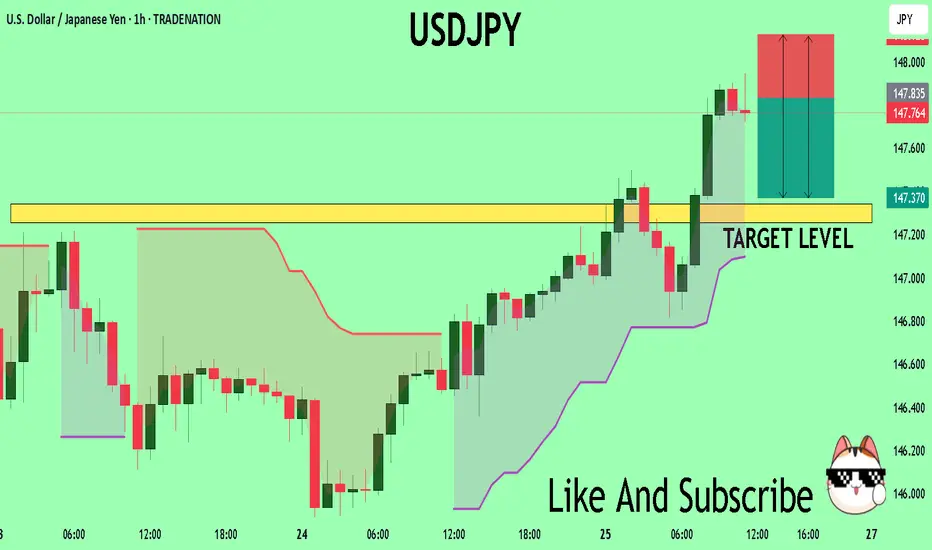
USDJPY Under Pressure! SELL!
My dear subscribers,
My technical analysis for USDJPY is below:
The price is coiling around a solid key level - 147.83
Bias - Bearish
Technical Indicators: Pivot Points High anticipates a potential price reversal.
Super trend shows a clear sell, giving a perfect indicators' convergence.
Goal - 147.34
My Stop Loss - 148.12
About Used Indicators:
By the very nature of the supertrend indicator, it offers firm support and resistance levels for traders to enter and exit trades. Additionally, it also provides signals for setting stop losses
Disclosure: I am part of Trade Nation's Influencer program and receive a monthly fee for using their TradingView charts in my analysis.
———————————
WISH YOU ALL LUCK
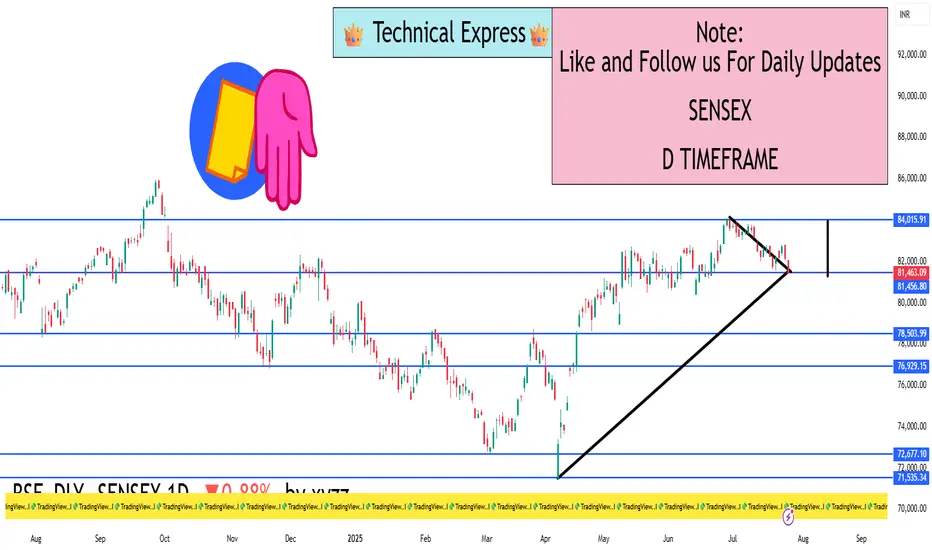
SENSEX 1D Timeframe📉 SENSEX Daily Overview (as of July 25, 2025)
Current Price: Around 81,460
Daily Change: Down by approximately 720 points (–0.9%)
Day’s High: About 82,070
Day’s Low: About 81,400
Previous Close: Around 82,184
📊 1-Day Candlestick Analysis
The candle for today is bearish, indicating strong selling pressure.
The price opened near previous levels but faced resistance at around 82,000.
Sellers dominated most of the day, pushing the index toward the 81,400 support zone.
🔍 Key Support and Resistance Levels
Level Type Price Range
Resistance 82,000 – 82,200
Support 81,400 – 81,000
If Sensex breaks below 81,400, the next target could be around 80,500 or 79,900.
If it holds above support and bounces, it could retest 82,200.
🧠 Technical Trend Analysis
Short-Term Trend: Bearish
Medium-Term Trend: Neutral to mildly bullish (as long as above 80,000)
Market Structure: Lower highs forming, suggesting pressure building on bulls
Indicators (assumed):
RSI may be approaching oversold
MACD likely showing bearish crossover
Volume increasing on red candles—indicating strong sell interest
📌 Sentiment & Market Context
Financial stocks (like banking, NBFCs) are under pressure.
Global cues (such as interest rate uncertainty and geopolitical concerns) are impacting investor confidence.
FII outflows and weak earnings in key sectors are adding to bearish momentum.
The broader trend remains range-bound, but with short-term downside bias.
✅ Strategy Suggestions (For Traders & Investors)
Swing Traders: Wait for a reversal candle (like a bullish engulfing or hammer) before considering long positions.
Breakout Traders: Watch for breakdown below 81,000 for continuation of the fall.
Positional Traders: Can wait to enter near 80,000–79,500 if the market holds that key level.
🔄 Summary
SENSEX is under pressure with a drop of 720+ points.
Technical structure suggests caution, especially if 81,000 breaks.
Support: 81,000 – 80,500
Resistance: 82,000 – 82,200
Gold – Bear-to-Bull Transition in Motion?🧠 MJTrading:
TVC:GOLD – 8H Chart: Bulls, It’s Your Move.
📸 Viewing Tip:
🛠️ Some layout elements may shift depending on your screen size.
🔗 View the fixed high-resolution chart here:
The impulsive move from 3000 to 3500 wasn’t just a trend — it was a statement of strength.
That rally carved the ATH, then left behind weeks of digestion and structural compression.
Now, the market may be setting up for its next decision.
Notice how each bearish leg has been shrinking — a classic behavioral signal that sellers are losing momentum — possibly a shift in control underway.
We’re also pressing above the downtrend line from the ATH (3500), while the uptrend from 3000 remains clean and respected.
We’re now testing the 3400 zone — a key battleground.
📍 If bulls want to reclaim the momentum and show dominance, this is the moment to act.
🔹 1st Support: 3363–3377
🔹 2nd Support: Rising trendline
🎯 Target Zone: 3455–3500+ (Liquidity Pool & ATH proximity)
⚠️ Break back inside the triangle could delay the breakout narrative.
⚠️ If momentum fails to increase from here, and bulls can’t break out with conviction, the market is likely to remain range-bound for longer — extending the sideways phase between 3250–3500.
💭 If you’re watching for a new ATH… stay sharp, stay structured — the market rewards patience and readiness.
“If the structure speaks to you, let it echo, boost it.”
📐 MJTrading 🚀
What do you think?
#GoldAnalysis #XAUUSD #MarketStructure #LiquiditySweep #AnythingCanHappen
#MJTrading
#ChartDesigner
Psychology Always Matters:
Click on them for the caption...

EURJPY; Heikin Ashi with FXAN algo indicator exampleHere you will see my approach with Heikin Ashi chart in combination of algo indicator from FXAN.

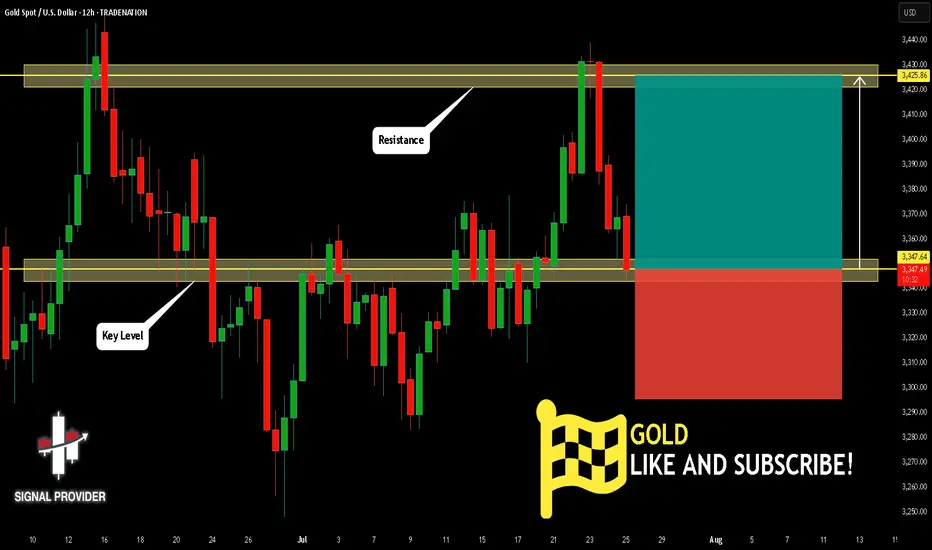
GOLD Will Move Higher! Buy!
Here is our detailed technical review for GOLD.
Time Frame: 12h
Current Trend: Bullish
Sentiment: Oversold (based on 7-period RSI)
Forecast: Bullish
The market is on a crucial zone of demand 3,347.64.
The oversold market condition in a combination with key structure gives us a relatively strong bullish signal with goal 3,425.86 level.
P.S
We determine oversold/overbought condition with RSI indicator.
When it drops below 30 - the market is considered to be oversold.
When it bounces above 70 - the market is considered to be overbought.
Disclosure: I am part of Trade Nation's Influencer program and receive a monthly fee for using their TradingView charts in my analysis.
Like and subscribe and comment my ideas if you enjoy them!
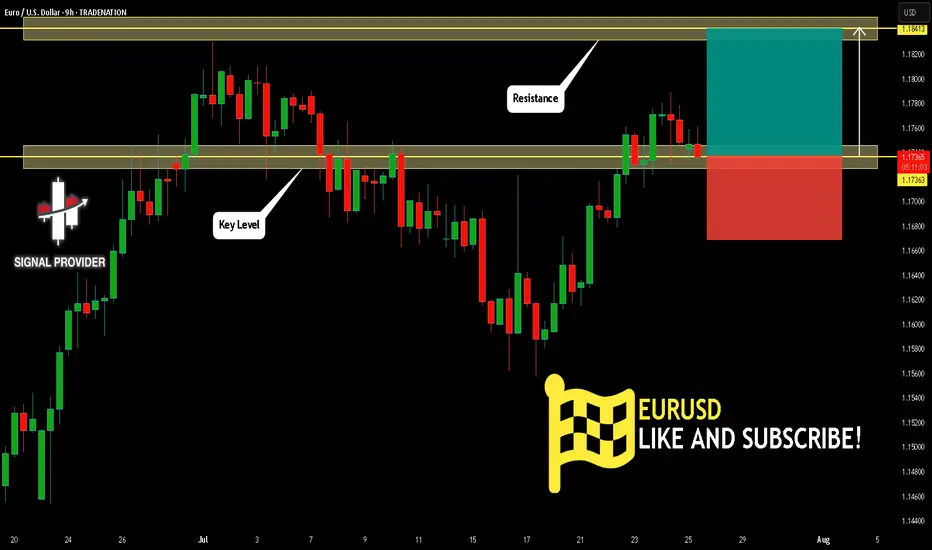
EURUSD Is Bullish! Long!
Take a look at our analysis for EURUSD.
Time Frame: 9h
Current Trend: Bullish
Sentiment: Oversold (based on 7-period RSI)
Forecast: Bullish
The price is testing a key support 1.173.
Current market trend & oversold RSI makes me think that buyers will push the price. I will anticipate a bullish movement at least to 1.184 level.
P.S
Overbought describes a period of time where there has been a significant and consistent upward move in price over a period of time without much pullback.
Disclosure: I am part of Trade Nation's Influencer program and receive a monthly fee for using their TradingView charts in my analysis.
Like and subscribe and comment my ideas if you enjoy them!
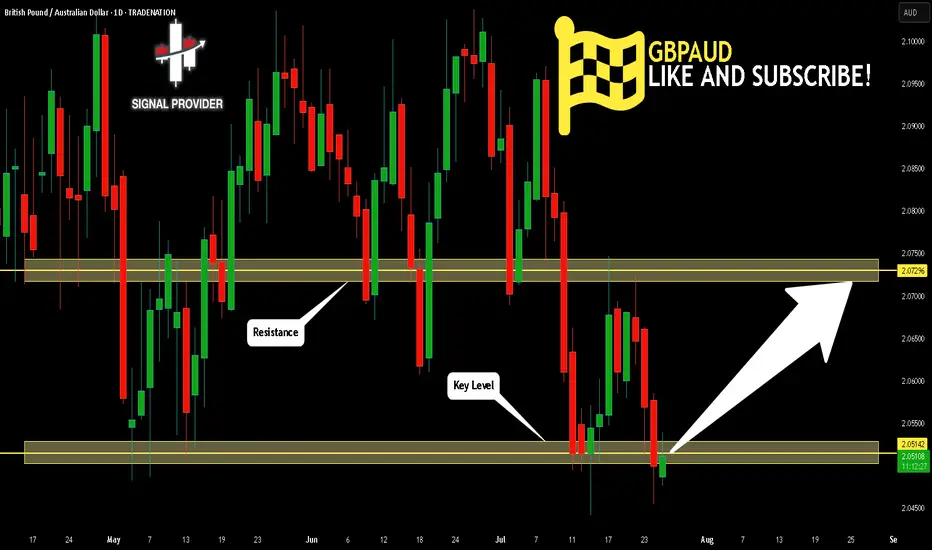
GBPAUD Is Going Up! Buy!
Here is our detailed technical review for GBPAUD.
Time Frame: 1D
Current Trend: Bullish
Sentiment: Oversold (based on 7-period RSI)
Forecast: Bullish
The market is testing a major horizontal structure 2.051.
Taking into consideration the structure & trend analysis, I believe that the market will reach 2.072 level soon.
P.S
The term oversold refers to a condition where an asset has traded lower in price and has the potential for a price bounce.
Overbought refers to market scenarios where the instrument is traded considerably higher than its fair value. Overvaluation is caused by market sentiments when there is positive news.
Disclosure: I am part of Trade Nation's Influencer program and receive a monthly fee for using their TradingView charts in my analysis.
Like and subscribe and comment my ideas if you enjoy them!
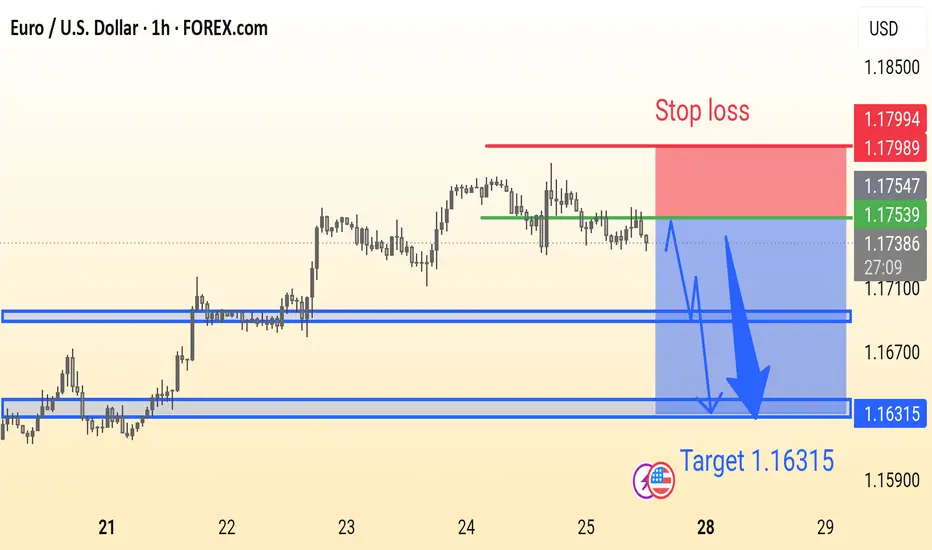
EURUSD Analysis is ReadyEUR/USD Trade Idea (1H Chart):
Price is ranging below resistance with a potential bearish breakout. Suggested Sell near 1.1753 with Stop Loss at 1.1799 and Target at 1.16315. Strong support zones marked for possible reaction.
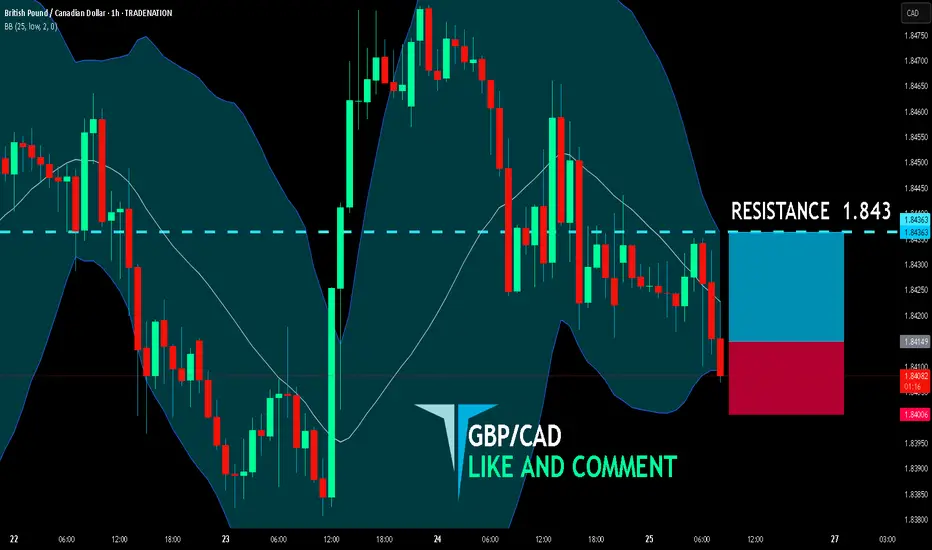
GBP/CAD BUYERS WILL DOMINATE THE MARKET|LONG
GBP/CAD SIGNAL
Trade Direction: long
Entry Level: 1.841
Target Level: 1.843
Stop Loss: 1.840
RISK PROFILE
Risk level: medium
Suggested risk: 1%
Timeframe: 1h
Disclosure: I am part of Trade Nation's Influencer program and receive a monthly fee for using their TradingView charts in my analysis.
✅LIKE AND COMMENT MY IDEAS✅
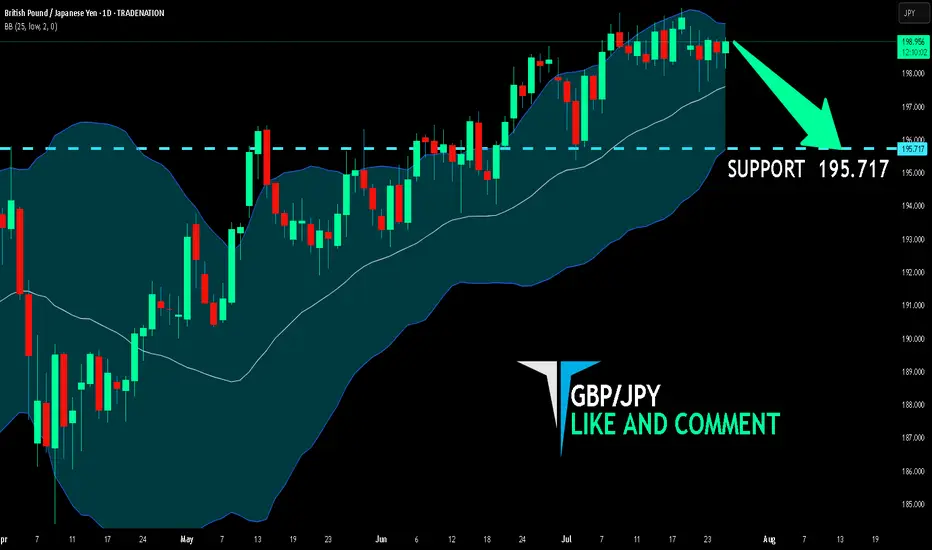
GBP/JPY BEARISH BIAS RIGHT NOW| SHORT
Hello, Friends!
GBP/JPY pair is trading in a local uptrend which we know by looking at the previous 1W candle which is green. On the 1D timeframe the pair is going up too. The pair is overbought because the price is close to the upper band of the BB indicator. So we are looking to sell the pair with the upper BB line acting as resistance. The next target is 195.717 area.
Disclosure: I am part of Trade Nation's Influencer program and receive a monthly fee for using their TradingView charts in my analysis.
✅LIKE AND COMMENT MY IDEAS✅
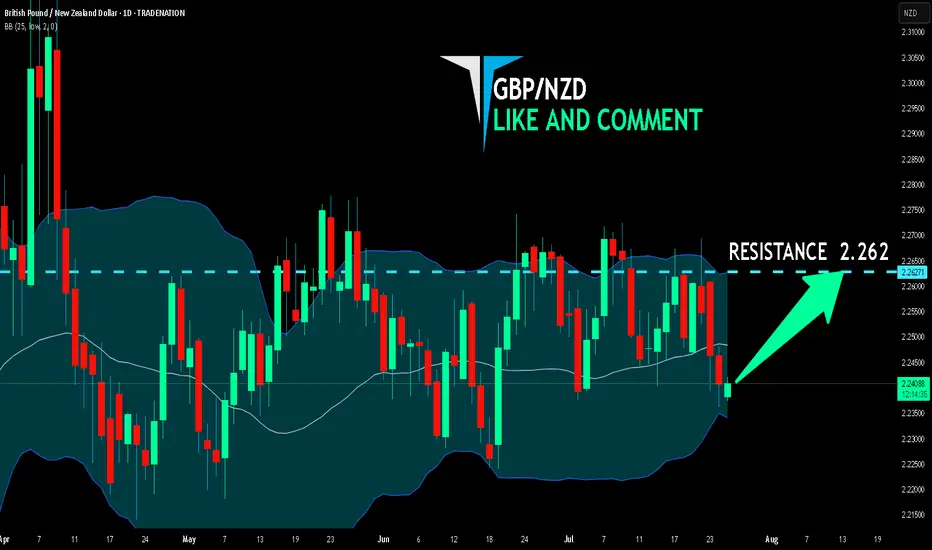
GBP/NZD BEST PLACE TO BUY FROM|LONG
Hello, Friends!
We are going long on the GBP/NZD with the target of 2.262 level, because the pair is oversold and will soon hit the support line below. We deduced the oversold condition from the price being near to the lower BB band. However, we should use low risk here because the 1W TF is red and gives us a counter-signal.
Disclosure: I am part of Trade Nation's Influencer program and receive a monthly fee for using their TradingView charts in my analysis.
✅LIKE AND COMMENT MY IDEAS✅
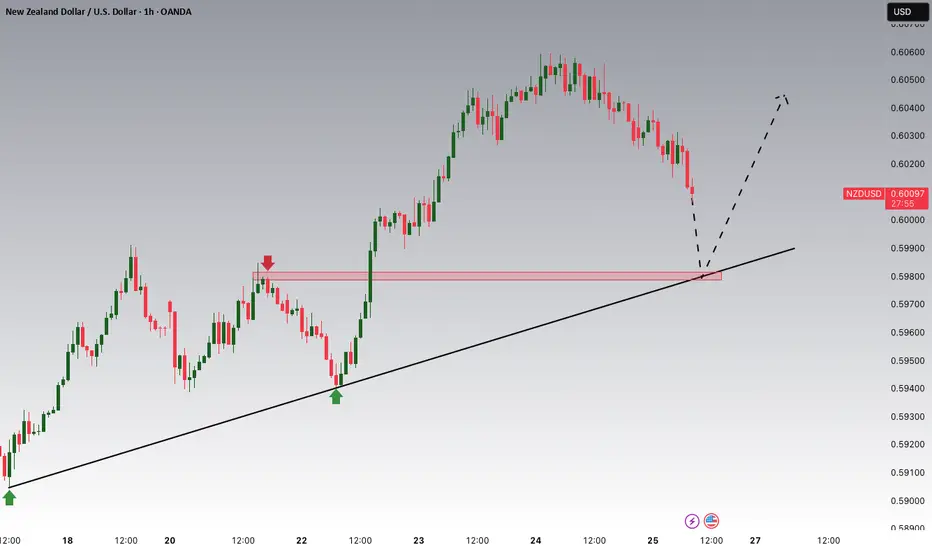
NZDUSD Potential UpsidesHey Traders, in today's trading session we are monitoring NZDUSD for a buying opportunity around 0.59800 zone, NZDUSD is trading in an uptrend and currently is in a correction phase in which it is approaching the trend at 0.59800 support and resistance area.
Trade safe, Joe.
EURGBP: Bearish Forecast & Outlook
The charts are full of distraction, disturbance and are a graveyard of fear and greed which shall not cloud our judgement on the current state of affairs in the EURGBP pair price action which suggests a high likelihood of a coming move down.
Disclosure: I am part of Trade Nation's Influencer program and receive a monthly fee for using their TradingView charts in my analysis.
❤️ Please, support our work with like & comment! ❤️
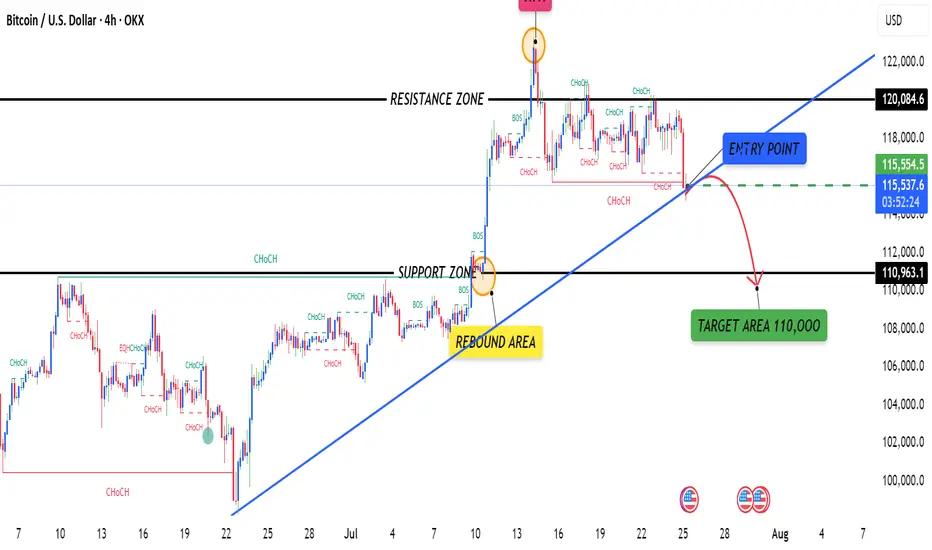
BTCUSD 4HOUR TIME FRAME ANALYSISCurrently bearish on the 4-hour chart with lower highs and lower lows forming consistently.
Price Action: BTCUSD recently broke below a key support zone around 116,000, turning it into a fresh resistance. The market shows bearish momentum as price fails to reclaim above that zone.
Candlestick Patterns: Multiple bearish engulfing candles confirm selling pressure near the 115,500–116,000 area.
NZDUSD: Free Trading Signal
NZDUSD
- Classic bullish setup
- Our team expects bullish continuation
SUGGESTED TRADE:
Swing Trade
Long NZDUSD
Entry Point - 0.6013
Stop Loss - 0.6004
Take Profit - 0.6028
Our Risk - 1%
Start protection of your profits from lower levels
Disclosure: I am part of Trade Nation's Influencer program and receive a monthly fee for using their TradingView charts in my analysis.
❤️ Please, support our work with like & comment! ❤️

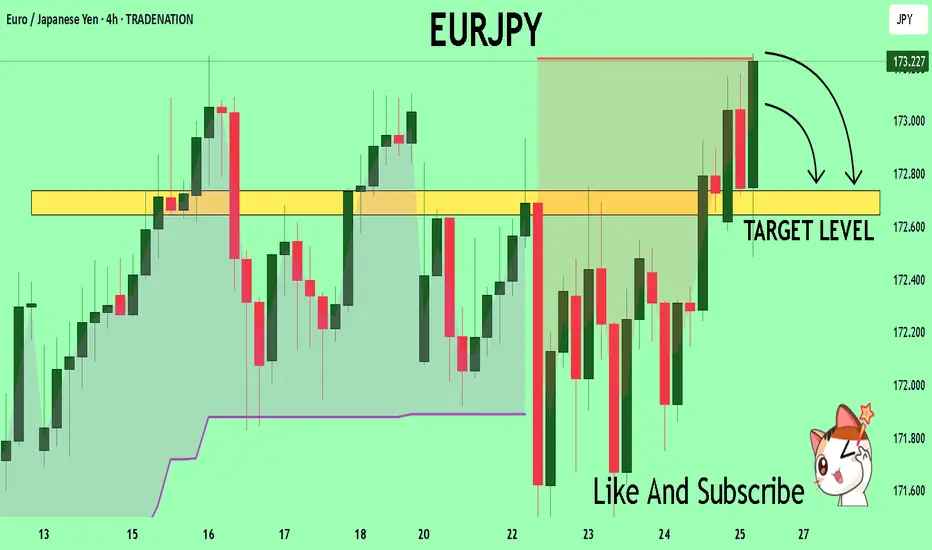
EURJPY Technical Analysis! SELL!
My dear subscribers,
EURJPY looks like it will make a good move, and here are the details:
The market is trading on 173.19 pivot level.
Bias - Bearish
Technical Indicators: Both Super Trend & Pivot HL indicate a highly probable Bearish continuation.
Target - 172.73
About Used Indicators:
The average true range (ATR) plays an important role in 'Supertrend' as the indicator uses ATR to calculate its value. The ATR indicator signals the degree of price volatility.
Disclosure: I am part of Trade Nation's Influencer program and receive a monthly fee for using their TradingView charts in my analysis.
———————————
WISH YOU ALL LUCK