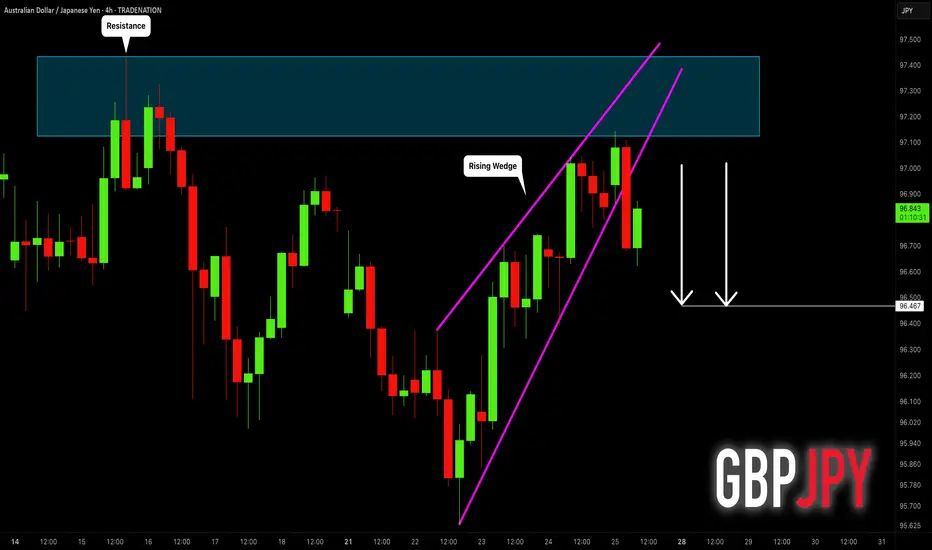
AUDJPY: Strong Bearish Signal?! 🇦🇺🇯🇵
AUDJPY may retrace from a key daily resistance.
As a confirmation, I see a bearish breakout of a support line of a rising
wedge pattern with a high momentum bearish candle.
Goal - 96.47
❤️Please, support my work with like, thank you!❤️
I am part of Trade Nation's Influencer program and receive a monthly fee for using their TradingView charts in my analysis.
Forex
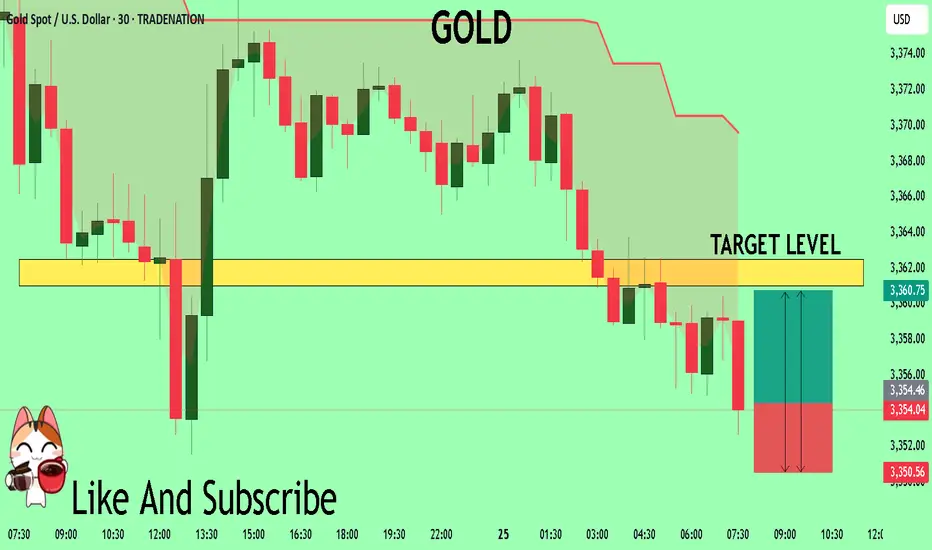
GOLD The Target Is UP! BUY!
My dear followers,
I analysed this chart on GOLD and concluded the following:
The market is trading on 3354.1 pivot level.
Bias - Bullish
Technical Indicators: Both Super Trend & Pivot HL indicate a highly probable Bullish continuation.
Target - 3361.01
Safe Stop Loss - 3350.5
About Used Indicators:
A super-trend indicator is plotted on either above or below the closing price to signal a buy or sell. The indicator changes color, based on whether or not you should be buying. If the super-trend indicator moves below the closing price, the indicator turns green, and it signals an entry point or points to buy.
Disclosure: I am part of Trade Nation's Influencer program and receive a monthly fee for using their TradingView charts in my analysis.
———————————
WISH YOU ALL LUCK
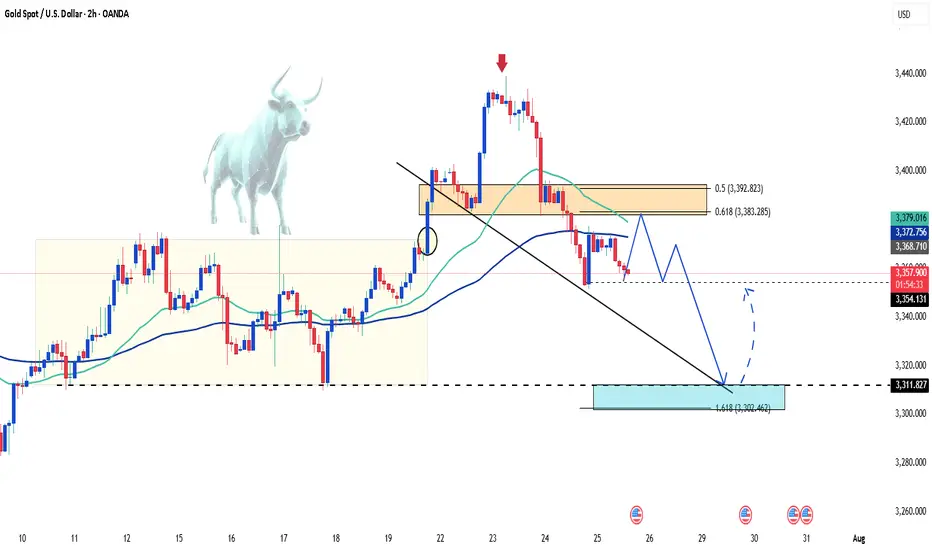
Gold dips on profit-taking, long-term outlook still bullishGold prices continued to decline this morning as investors locked in profits following the precious metal’s recent rally above $3,400.
In the short term, further downside is possible if profit-taking persists and capital flows shift toward equities, especially as U.S. stock markets hover near record highs. However, gold remains a favored safe-haven asset for the long run amid ongoing global economic and geopolitical uncertainties.
Markets are also turning their focus to the upcoming Federal Reserve policy meeting on July 29–30. While the Fed is expected to hold interest rates steady this time, many investors still anticipate a potential rate cut in September. A low interest rate environment typically supports non-yielding assets like gold.
Gold price analysis July 25Gold Analysis – D1 Uptrend Still Maintains, But Needs New Momentum
Yesterday’s trading session recorded a D1 candle closing above the Breakout 3363 zone, indicating that buying power in the US session is still dominant. This implies that the uptrend is still being maintained, although the market may need a short-term technical correction.
In today’s Tokyo and London sessions, there is a possibility of liquidity sweeps to the support zone below before Gold recovers and increases again in the New York session.
Important to note:
The uptrend will only be broken if Gold closes below the 3345 zone on the D1 chart.
In this case, the 3320 level will be the next support zone to observe the price reaction and consider buying points.
For the bullish wave to continue expanding towards the historical peak (ATH) at 3500, the market needs stronger supporting factors, which can come from economic data or geopolitical developments.
📌 Support zone: 3345 – 3320
📌 Resistance zone: 3373 – 3418
🎯 Potential buy zone:
3345 (prioritize price reaction in this zone)
3320 (in case of breaking through 3345)
🎯 Target: 3417

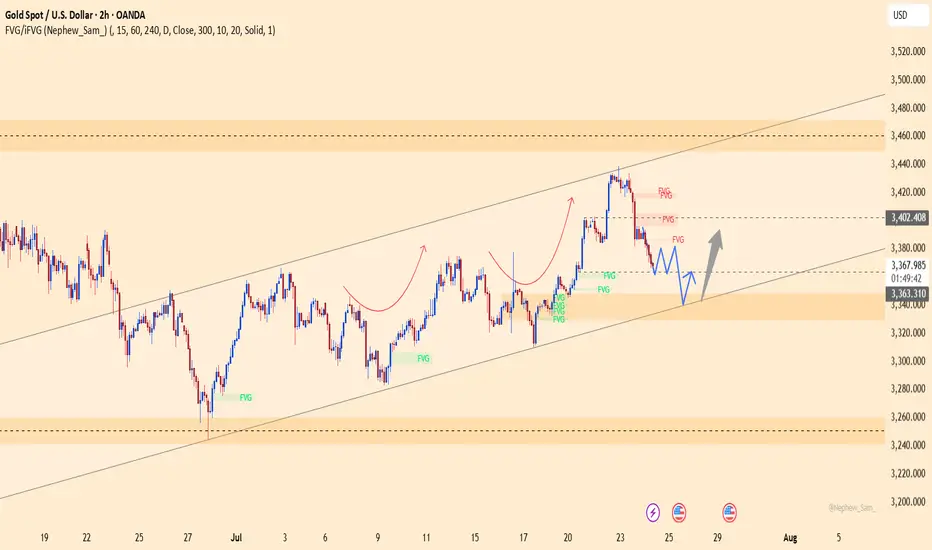
XAUUSD – healthy correction, ready to bounce from 3,338Gold is retracing within an ascending channel after facing rejection at the FVG zone near 3,402.800. This pullback is seen as a healthy correction, with confluence support around 3,338, which previously acted as a springboard for bullish momentum.
As long as price holds above this zone, a rebound toward 3,402 remains likely.
Primary scenario
Buy zone: 3,338
Target: 3,402
Invalidation: Break below 3,320
Note
Weak volume near the FVG zone may cause short-term consolidation, but the broader trend still favors buyers.
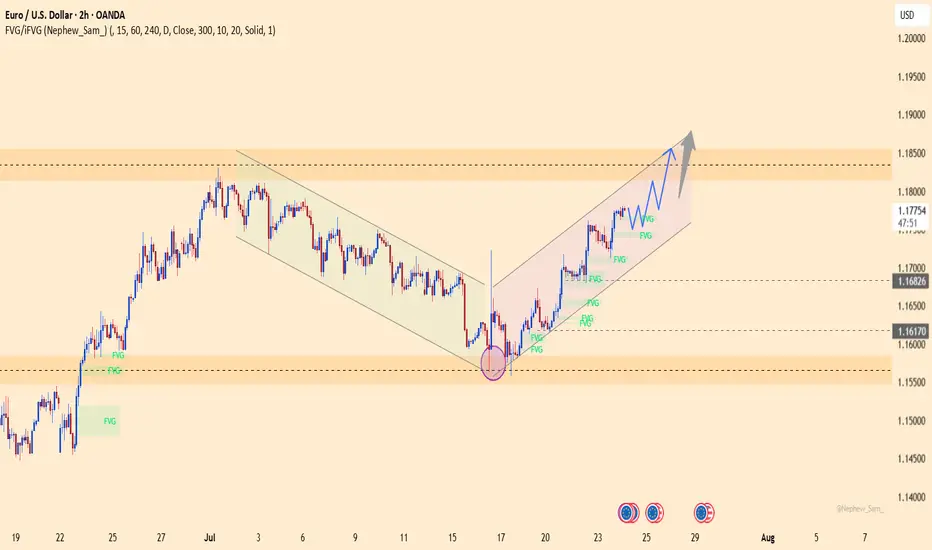
EURUSD – The Comeback is Real! After weeks trapped in a descending channel, EURUSD has broken out in style, launching into a clean bullish channel. Price is now carving a staircase of FVG zones, with momentum clearly favoring the bulls.
What’s fueling the fire?
Flash Manufacturing PMI from Europe beat forecasts
Eurozone consumer confidence improved
Markets pricing in dovish Fed as jobless claims dropped but inflation expectations stall
As long as price stays above 1.1750 and respects the ascending channel, the 1.1850 zone is well within reach.
Strategy: Buy the dips inside the bullish channel. FVGs act as stepping stones for further upside.
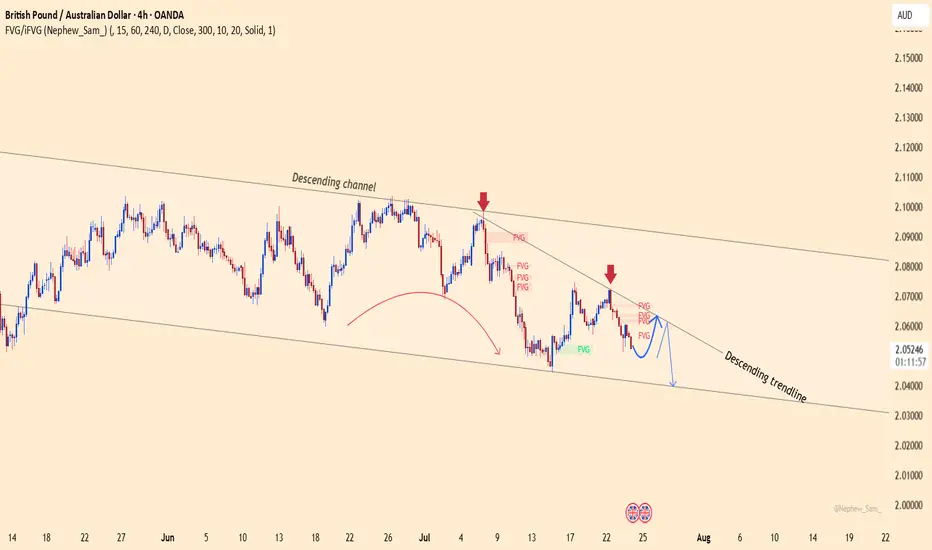
GBPAUD – False breakout or the next sharp drop?The GBPAUD pair continues to trade within a well-defined descending channel, with every bullish attempt being firmly rejected by the descending trendline. Recent candlesticks show a clear sell signal right at the FVG resistance zone.
Market-moving news:
Australia’s manufacturing PMI surprised to the upside → strong support for AUD
GBP remains under pressure after dovish comments from the BoE, diminishing hopes of further rate hikes.
If the price fails to break above the 2.0640 zone — creating yet another fake top — a sharp drop toward 2.0400 is highly likely.
Strategy: Look to SELL near the trendline and FVG zone, targeting 2.0400.
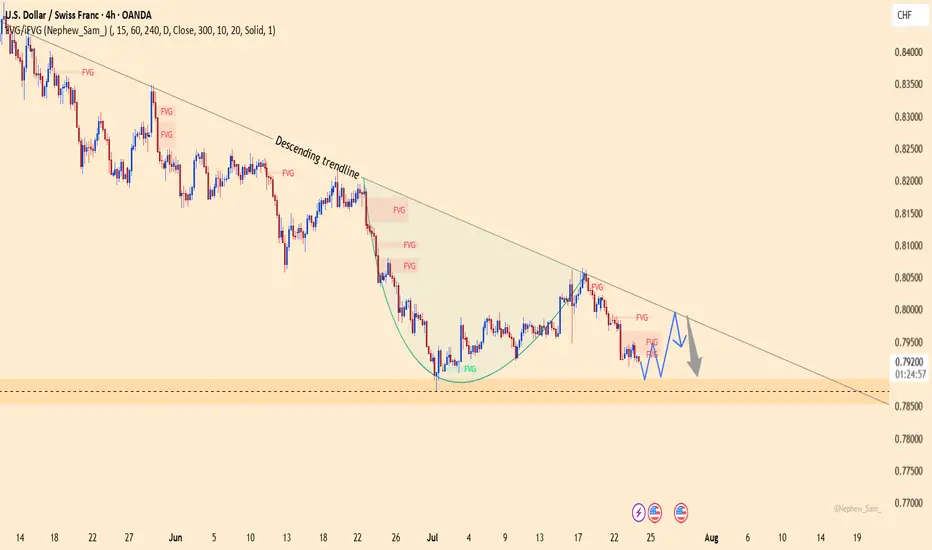
USDCHF – The Wind Still Blows South!USDCHF remains trapped below the descending trendline since June. Every bullish attempt has been sharply rejected – showing sellers are still in control.
Fresh U.S. data just released:
Jobless claims dropped → strong labor market → Fed likely to keep rates high → USD gains strength.
Manufacturing PMI beat expectations → resilient economy → more reason for a hawkish Fed.
But don’t forget: CHF is attracting safe-haven flows, adding downward pressure on USD!
If price fails to break above 0.7990 and gets rejected at the trendline, a drop toward 0.7890 is likely.
Strategy: Look to SELL around the trendline – follow the trend, not your emotions!
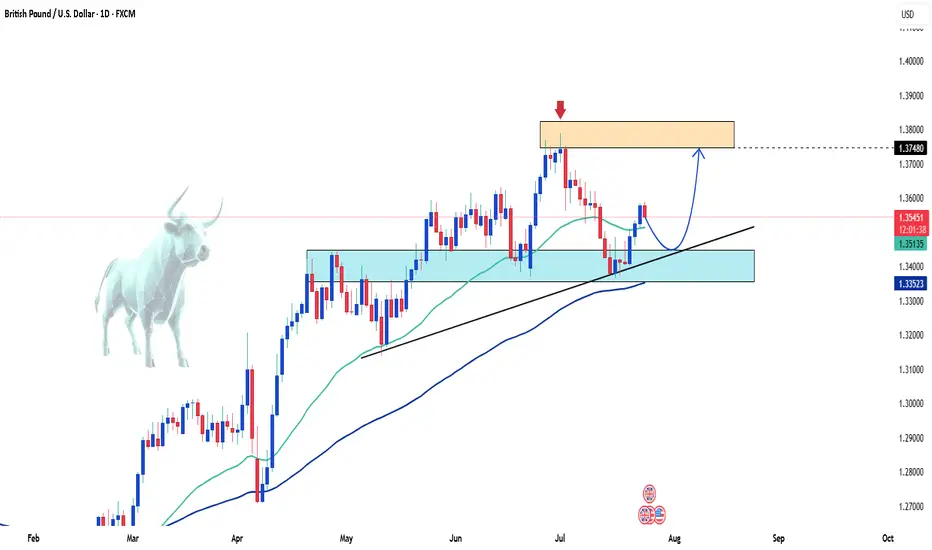
GBPUSD Rebounds Strongly – Is the Uptrend Ready to Resume?Hello traders!
On the D1 chart, GBPUSD is showing a strong recovery after bouncing off the support zone around 1.33500–1.34500. This rebound happened right at the ascending trendline and the confluence with the EMA, reinforcing the strength of the bullish zone.
The overall bullish structure remains intact. As long as price stays above the trendline, I expect GBPUSD to continue its move toward the resistance area near the recent highs.
My strategy is to look for buying opportunities around the support zone or after a confirmation signal from price action following a minor pullback.
Good luck and happy trading!
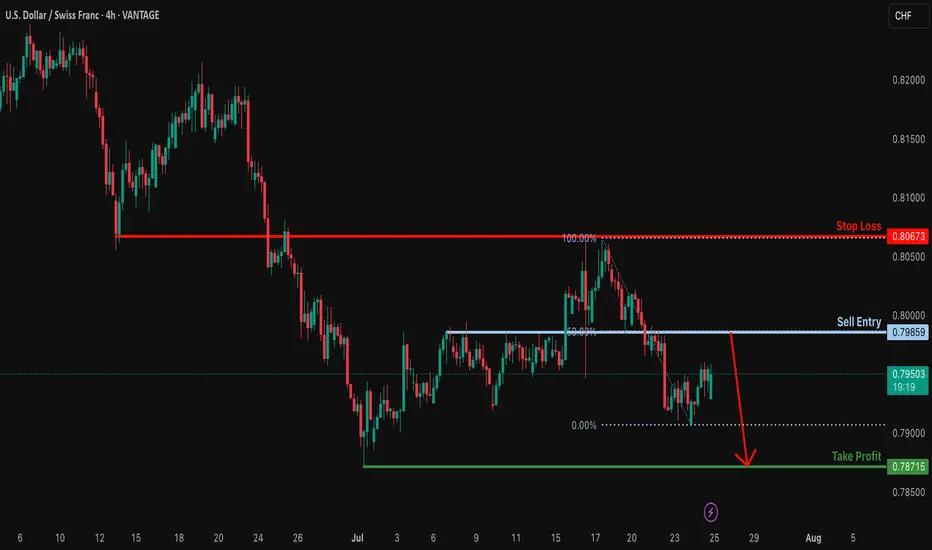
Bearish drop?USD/CHF is rising towards the resistance level which is an overlap resitance that lines up with the 50% FIbonacci retracement and could reverse from this level to our take profit.
Entry: 0.7985
Why we like it:
There is an overlap reistance that lines up with the 50% FIbonacci retraecment.
Stop loss: 0.8067
Why we like it:
There is an overlap resitance.
Take profit: 0.7871
Why we like it:
There is a swing low support.
Enjoying your TradingView experience? Review us!
Please be advised that the information presented on TradingView is provided to Vantage (‘Vantage Global Limited’, ‘we’) by a third-party provider (‘Everest Fortune Group’). Please be reminded that you are solely responsible for the trading decisions on your account. There is a very high degree of risk involved in trading. Any information and/or content is intended entirely for research, educational and informational purposes only and does not constitute investment or consultation advice or investment strategy. The information is not tailored to the investment needs of any specific person and therefore does not involve a consideration of any of the investment objectives, financial situation or needs of any viewer that may receive it. Kindly also note that past performance is not a reliable indicator of future results. Actual results may differ materially from those anticipated in forward-looking or past performance statements. We assume no liability as to the accuracy or completeness of any of the information and/or content provided herein and the Company cannot be held responsible for any omission, mistake nor for any loss or damage including without limitation to any loss of profit which may arise from reliance on any information supplied by Everest Fortune Group.
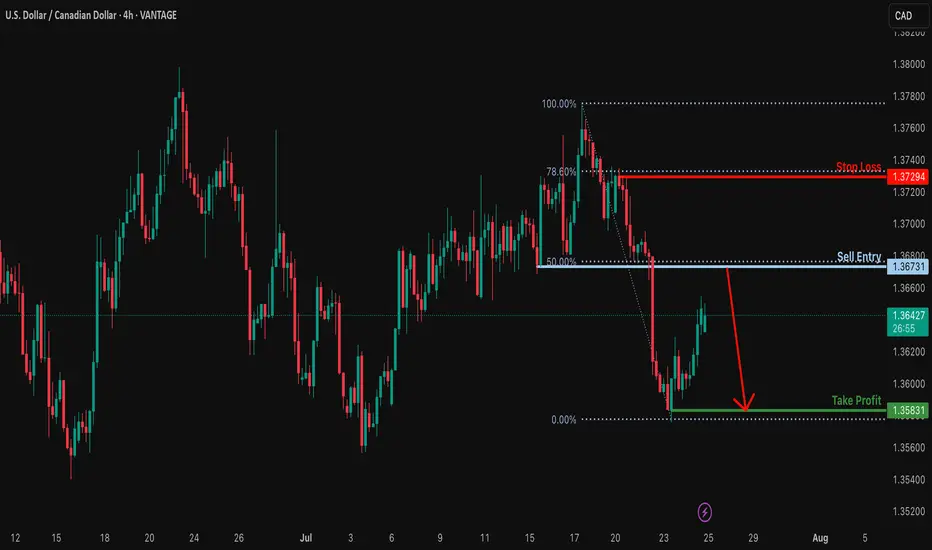
Heading into 50% Fibonacci resistance?USD/CAD is rising towards the resistance level, which serves as a pullback resistance that aligns with the 50% Fibonacci retracement and could reverse from this level to our take-profit target.
Entry: 1.3673
Why we like it:
There is a pullback resistance that lines up with the 50% Fibonacci retracement.
Stop loss: 1.3729
Why we like it:
There is a pullback resistance that lines up with the 78.6% Fibonacci retracement.
Take profit: 1.3583
Why we like it:
There is a swing low support.
Enjoying your TradingView experience? Review us!
Please be advised that the information presented on TradingView is provided to Vantage (‘Vantage Global Limited’, ‘we’) by a third-party provider (‘Everest Fortune Group’). Please be reminded that you are solely responsible for the trading decisions on your account. There is a very high degree of risk involved in trading. Any information and/or content is intended entirely for research, educational and informational purposes only and does not constitute investment or consultation advice or investment strategy. The information is not tailored to the investment needs of any specific person and therefore does not involve a consideration of any of the investment objectives, financial situation or needs of any viewer that may receive it. Kindly also note that past performance is not a reliable indicator of future results. Actual results may differ materially from those anticipated in forward-looking or past performance statements. We assume no liability as to the accuracy or completeness of any of the information and/or content provided herein and the Company cannot be held responsible for any omission, mistake nor for any loss or damage including without limitation to any loss of profit which may arise from reliance on any information supplied by Everest Fortune Group.
Bullish bounce for the Cable?The price is falling towards the suoprt level which is an overlap support that is slightly above the 61.8% Fibonacci retracement and could bounce from this level to our take profit.
Entry: 1.3468
Why we like it:
There is an overlap support that is slightly above the 61.8% Fibonacci retracement.
Stop loss: 1.3377
Why we like it:
There is a swing low support.
Take profit: 1.3577
Why we like it:
There is a pullback resistance.
Enjoying your TradingView experience? Review us!
Please be advised that the information presented on TradingView is provided to Vantage (‘Vantage Global Limited’, ‘we’) by a third-party provider (‘Everest Fortune Group’). Please be reminded that you are solely responsible for the trading decisions on your account. There is a very high degree of risk involved in trading. Any information and/or content is intended entirely for research, educational and informational purposes only and does not constitute investment or consultation advice or investment strategy. The information is not tailored to the investment needs of any specific person and therefore does not involve a consideration of any of the investment objectives, financial situation or needs of any viewer that may receive it. Kindly also note that past performance is not a reliable indicator of future results. Actual results may differ materially from those anticipated in forward-looking or past performance statements. We assume no liability as to the accuracy or completeness of any of the information and/or content provided herein and the Company cannot be held responsible for any omission, mistake nor for any loss or damage including without limitation to any loss of profit which may arise from reliance on any information supplied by Everest Fortune Group.

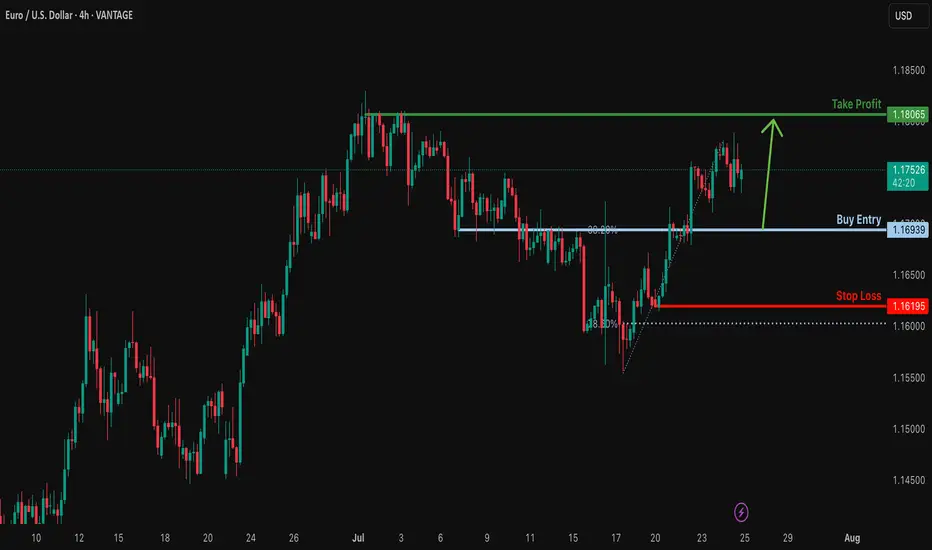
Bullish bounce off overlap support?EUR/USD is falling towards the support level, which is an overlap support that aligns with the 38.2% Fibonacci retracement and could bounce from this level to our take profit.
Entry: 1.1693
Why we like it:
There is an overlap support that lines up with the 38.2% Fibonacci retracement.
Stop loss: 1.1619
Why we like it:
There is a pullback support that is slightly above the 78.6% Fibonacci retracement.
Take profit: 1.1806
Why we like it:
There is a swing high resistance.
Enjoying your TradingView experience? Review us!
Please be advised that the information presented on TradingView is provided to Vantage (‘Vantage Global Limited’, ‘we’) by a third-party provider (‘Everest Fortune Group’). Please be reminded that you are solely responsible for the trading decisions on your account. There is a very high degree of risk involved in trading. Any information and/or content is intended entirely for research, educational and informational purposes only and does not constitute investment or consultation advice or investment strategy. The information is not tailored to the investment needs of any specific person and therefore does not involve a consideration of any of the investment objectives, financial situation or needs of any viewer that may receive it. Kindly also note that past performance is not a reliable indicator of future results. Actual results may differ materially from those anticipated in forward-looking or past performance statements. We assume no liability as to the accuracy or completeness of any of the information and/or content provided herein and the Company cannot be held responsible for any omission, mistake nor for any loss or damage including without limitation to any loss of profit which may arise from reliance on any information supplied by Everest Fortune Group.
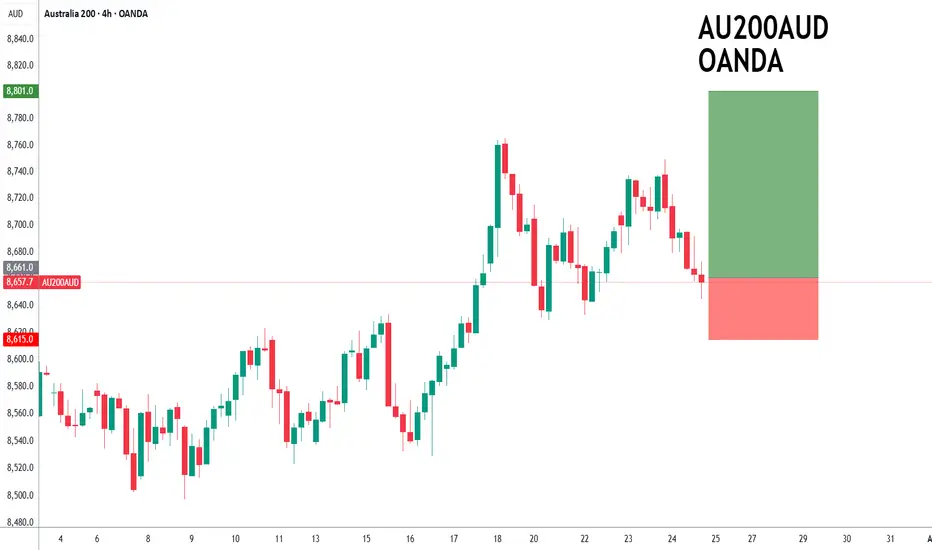
ASX200 to find buyers at current market price?ASX200 - 24h expiry
Price action resulted in a new all-time high at 8765.
Price action continues to trade around the all-time highs.
The bullish engulfing candle on the 4 hour chart the positive for sentiment.
50 4hour EMA is at 8658.
We look for a temporary move lower.
We look to Buy at 8661 (stop at 8615)
Our profit targets will be 8801 and 8831
Resistance: 8700 / 8749 / 8765
Support: 8658 / 8629 / 8600
Risk Disclaimer
The trade ideas beyond this page are for informational purposes only and do not constitute investment advice or a solicitation to trade. This information is provided by Signal Centre, a third-party unaffiliated with OANDA, and is intended for general circulation only. OANDA does not guarantee the accuracy of this information and assumes no responsibilities for the information provided by the third party. The information does not take into account the specific investment objectives, financial situation, or particular needs of any particular person. You should take into account your specific investment objectives, financial situation, and particular needs before making a commitment to trade, including seeking, under a separate engagement, as you deem fit.
You accept that you assume all risks in independently viewing the contents and selecting a chosen strategy.
Where the research is distributed in Singapore to a person who is not an Accredited Investor, Expert Investor or an Institutional Investor, Oanda Asia Pacific Pte Ltd (“OAP“) accepts legal responsibility for the contents of the report to such persons only to the extent required by law. Singapore customers should contact OAP at 6579 8289 for matters arising from, or in connection with, the information/research distributed.
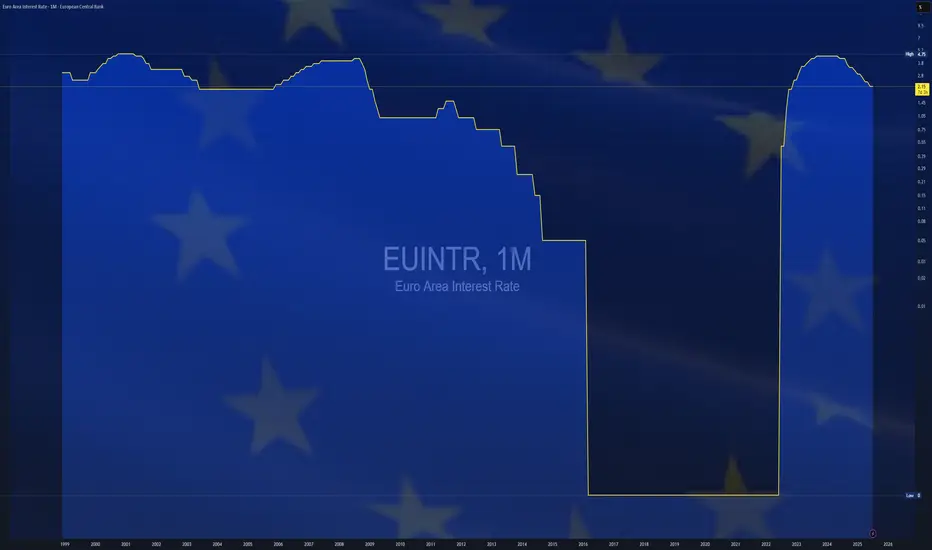
$EUINTR - Europe Interest Rates (July/2025)ECONOMICS:EUINTR
July/2025
source: European Central Bank
- The ECB kept interest rates unchanged in July, effectively marking the end of its current easing cycle after eight cuts over the past year that brought borrowing costs to their lowest levels since November 2022.
The main refinancing rate remains at 2.15%, while the deposit facility rate holds at 2.0%. Policymakers struck a wait-and-see stance, as they evaluate the impact of lingering trade uncertainty and the potential fallout from proposed US tariffs on economic growth and inflation.
Inflation hit the ECB’s 2% target in June, adding to the case for a pause in policy adjustments. Speaking at the ECB press conference, President Lagarde said the central bank is “in a good place” but acknowledged the difficulty in assessing how tariffs will affect price outlooks, given the mix of both inflationary and disinflationary pressures.
On the recent euro appreciation, Lagarde reiterated that the ECB does not target exchange rates directly but considers them when forecasting inflation.
NZDUSD is forming an upward cycle trendKiwi dollar is strong at the moment.
It is in an upward trend. If the trend completes 2 cycles and maintains the upward trajectory, I will get in the trade as a Long/Buy.
Patiently watching if the trend continues or breaks down.

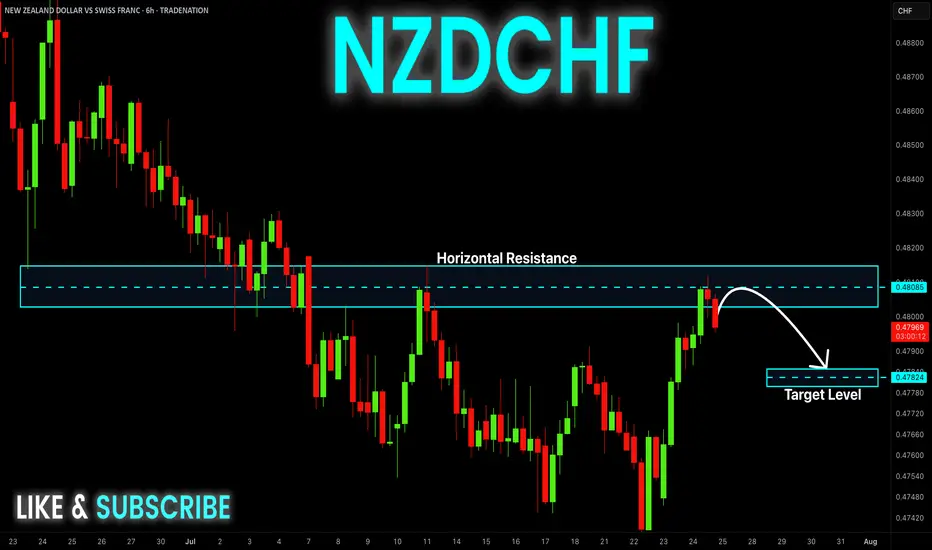
NZD-CHF Local Bearish Bias! Sell!
Hello,Traders!
NZD-CHF made a retest of
The horizontal resistance
of 0.4810 so we are locally
Bearish biased and we
Will be expecting a
Further bearish move down
Sell!
Comment and subscribe to help us grow!
Check out other forecasts below too!
Disclosure: I am part of Trade Nation's Influencer program and receive a monthly fee for using their TradingView charts in my analysis.
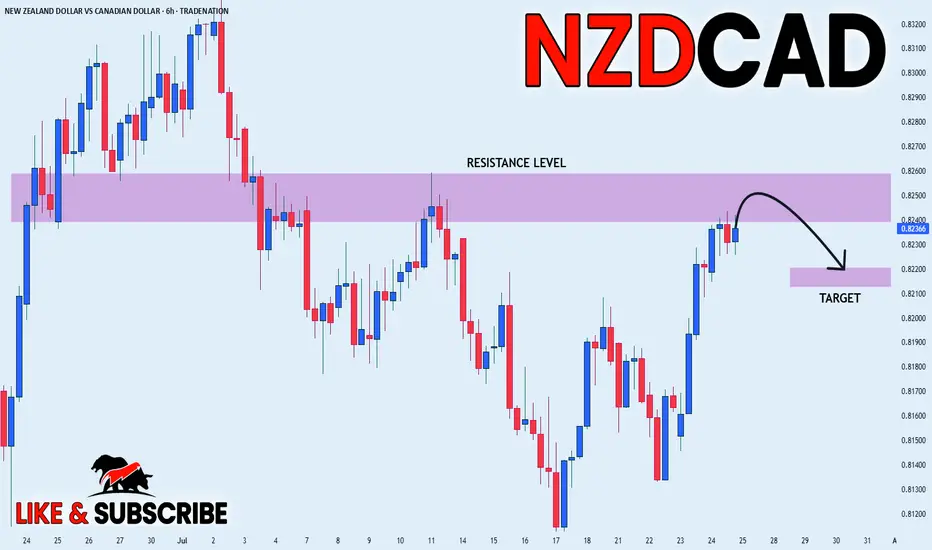
NZD_CAD POTENTIAL SHORT|
✅NZD_CAD has been growing recently
And the pair seems locally overbought
So as the pair is approaching
A horizontal resistance of 0.8260
Price decline is to be expected
SHORT🔥
✅Like and subscribe to never miss a new idea!✅
Disclosure: I am part of Trade Nation's Influencer program and receive a monthly fee for using their TradingView charts in my analysis.
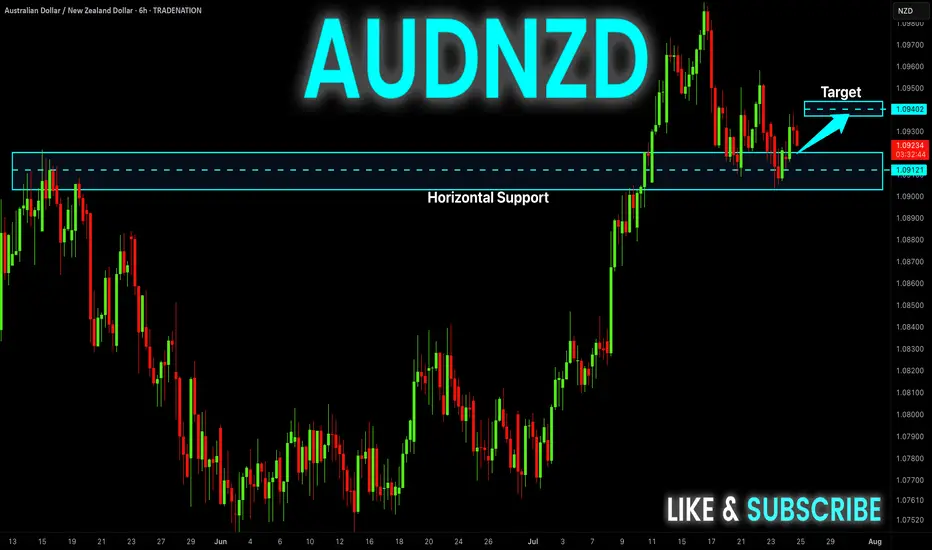
AUD-NZD Local Long! Buy!
Hello,Traders!
AUD-NZD is about to retest
A strong horizontal support
Level of 1.0912 and as we are
Bullish biased we will be expecting
A local bullish rebound
Buy!
Comment and subscribe to help us grow!
Check out other forecasts below too!
Disclosure: I am part of Trade Nation's Influencer program and receive a monthly fee for using their TradingView charts in my analysis.
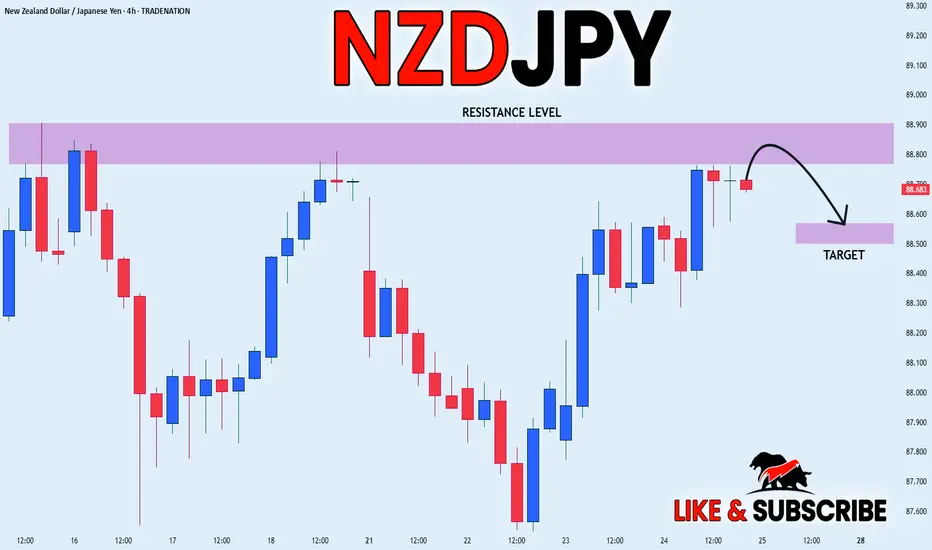
NZD_JPY SHORT FROM RESISTANCE|
✅NZD_JPY is going up now
But a strong resistance level is ahead at 88.900
Thus I am expecting a pullback
And a move down towards the target of 88.572
SHORT🔥
✅Like and subscribe to never miss a new idea!✅
Disclosure: I am part of Trade Nation's Influencer program and receive a monthly fee for using their TradingView charts in my analysis.
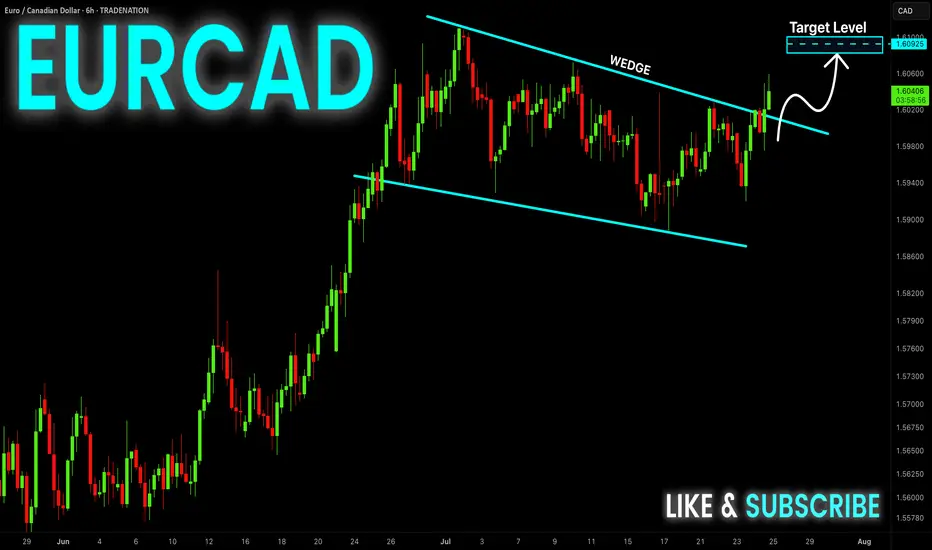
EUR-CAD Bullish Wedge! Buy!
Hello,Traders!
EUR-CAD is trading in an
Uptrend and the pair formed
A bullish wedge pattern and
Now we are seeing a bullish
Breakout from the wedge so
We are bullish biased and we
Will be expecting a further
Bullish move up
Buy!
Comment and subscribe to help us grow!
Check out other forecasts below too!
Disclosure: I am part of Trade Nation's Influencer program and receive a monthly fee for using their TradingView charts in my analysis.
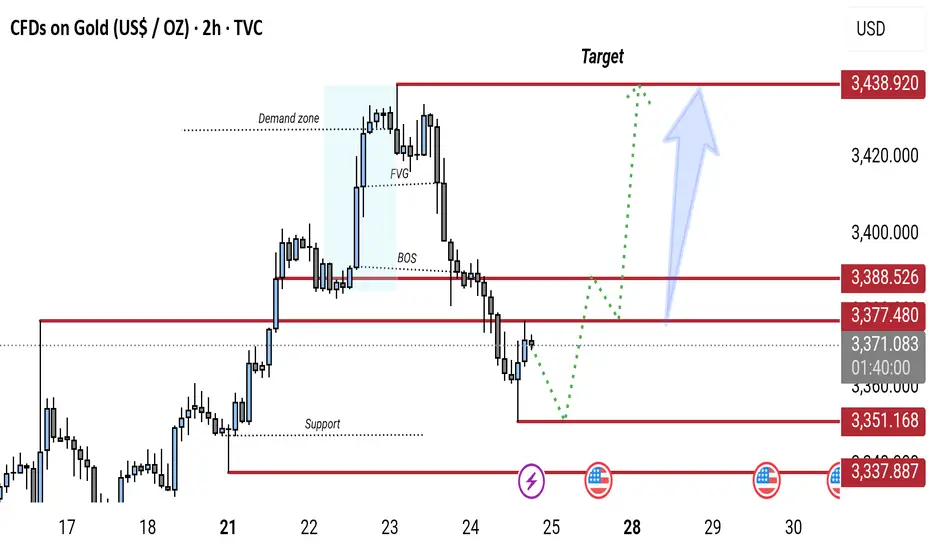
Gold 2H Chart: Bullish Reversal Expected from Key Support ZoneGold (XAU/USD) 2H chart shows a bearish break of structure (BOS) followed by a pullback toward a key support zone (around 3,337–3,351). A potential bullish reversal is expected from this zone, targeting the 3,438 resistance level. The chart highlights a demand zone, FVG (Fair Value Gap), and possible retracement before continuation to the upside.
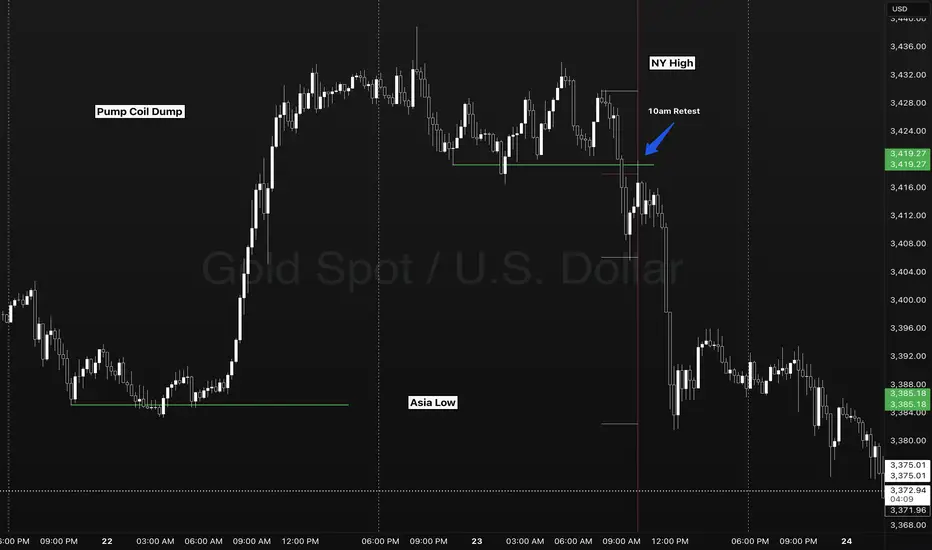
Gold two session setups - Timings Levels Behavior of PriceIn this example we see FOREXCOM:XAUUSD forming a simple and scalable setup interacting with key session levels and key times of day.
- 4HR OPEN CLOSE (10:00am)
- SESSION TIME RANGES
- DAILY HIGH/LOW
- SESSION HIGH/LOW
Here on my chart I use no lagging indicators. A previous session ranges high and low represents the major liquidity levels. A classic break and retest going into the NY session took place at 10:00am offering a parabolic opportunity back to a previous days session low.
SIMPLICITY IS KEY. Stay away from trading gaps, sweeps, hunts, soups on the inside of a high and low. The market only does two things.
- Breakout, fail, reverse.
- Breakout, pullback, continue.
Its important to be on a higher time frame to capture multiple sessions of liquidity areas. As a new trader I found looking to take a trade instead of waiting for a setup. 1 minute charts with multiple moving averages, oscillators, macd. Essentially a science project! Keep it simple traders. Patience pays. Timing, levels, behavior of price.