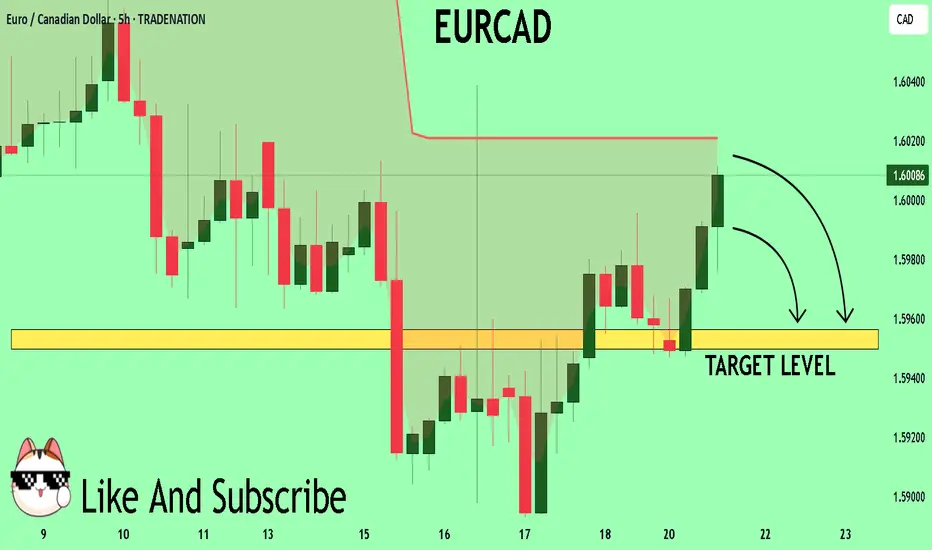
EURCAD Buyers In Panic! SELL!
My dear friends,
My technical analysis for EURCAD is below:
The market is trading on 1.6005 pivot level.
Bias - Bearish
Technical Indicators: Both Super Trend & Pivot HL indicate a highly probable Bearish continuation.
Target - 1.5956
About Used Indicators:
A pivot point is a technical analysis indicator, or calculations, used to determine the overall trend of the market over different time frames.
Disclosure: I am part of Trade Nation's Influencer program and receive a monthly fee for using their TradingView charts in my analysis.
———————————
WISH YOU ALL LUCK
Forex
EURJPY Will Explode! BUY!
My dear subscribers,
My technical analysis for EURJPY is below:
The price is coiling around a solid key level - 171.82
Bias - Bullish
Technical Indicators: Pivot Points Low anticipates a potential price reversal.
Super trend shows a clear buy, giving a perfect indicators' convergence.
Goal - 172.34
About Used Indicators:
By the very nature of the supertrend indicator, it offers firm support and resistance levels for traders to enter and exit trades. Additionally, it also provides signals for setting stop losses
Disclosure: I am part of Trade Nation's Influencer program and receive a monthly fee for using their TradingView charts in my analysis.
———————————
WISH YOU ALL LUCK

EURCAD: Expecting Bearish Continuation! Here is Why
Balance of buyers and sellers on the EURCAD pair, that is best felt when all the timeframes are analyzed properly is shifting in favor of the sellers, therefore is it only natural that we go short on the pair.
Disclosure: I am part of Trade Nation's Influencer program and receive a monthly fee for using their TradingView charts in my analysis.
❤️ Please, support our work with like & comment! ❤️
USDJPY: Short Trading Opportunity
USDJPY
- Classic bearish pattern
- Our team expects retracement
SUGGESTED TRADE:
Swing Trade
Sell USDJPY
Entry - 146.78
Stop - 146.96
Take - 146.43
Our Risk - 1%
Start protection of your profits from lower levels
Disclosure: I am part of Trade Nation's Influencer program and receive a monthly fee for using their TradingView charts in my analysis.
❤️ Please, support our work with like & comment! ❤️

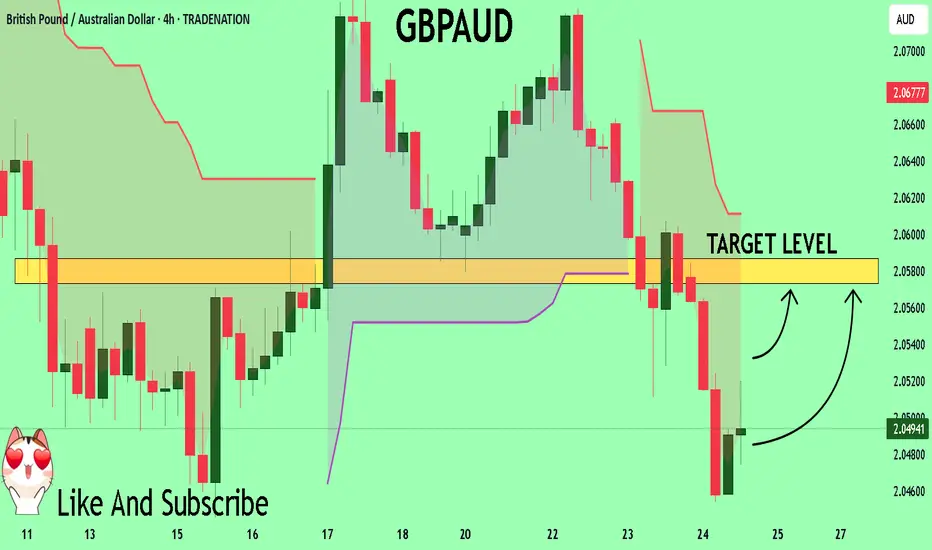
GBPAUD Sellers In Panic! BUY!
My dear followers,
This is my opinion on the GBPAUD next move:
The asset is approaching an important pivot point 2.0491
Bias - Bullish
Technical Indicators: Supper Trend generates a clear long signal while Pivot Point HL is currently determining the overall Bullish trend of the market.
Goal - 2.0573
About Used Indicators:
For more efficient signals, super-trend is used in combination with other indicators like Pivot Points.
Disclosure: I am part of Trade Nation's Influencer program and receive a monthly fee for using their TradingView charts in my analysis.
———————————
WISH YOU ALL LUCK
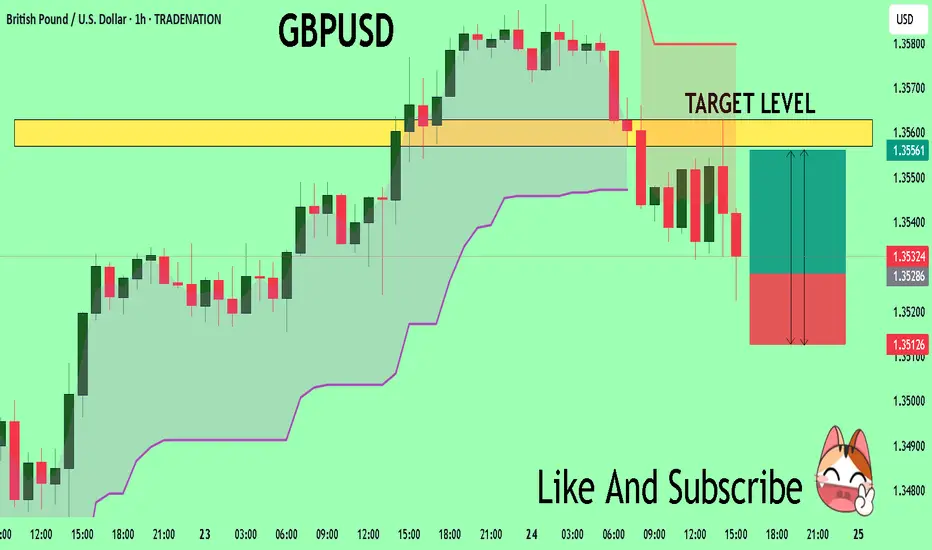
GBPUSD Massive Long! BUY!
My dear friends,
GBPUSD looks like it will make a good move, and here are the details:
The market is trading on 1.3528 pivot level.
Bias - Bullish
Technical Indicators: Supper Trend generates a clear long signal while Pivot Point HL is currently determining the overall Bullish trend of the market.
Goal - 1.3556
Recommended Stop Loss - 1.3512
About Used Indicators:
Pivot points are a great way to identify areas of support and resistance, but they work best when combined with other kinds of technical analysis
Disclosure: I am part of Trade Nation's Influencer program and receive a monthly fee for using their TradingView charts in my analysis.
———————————
WISH YOU ALL LUCK
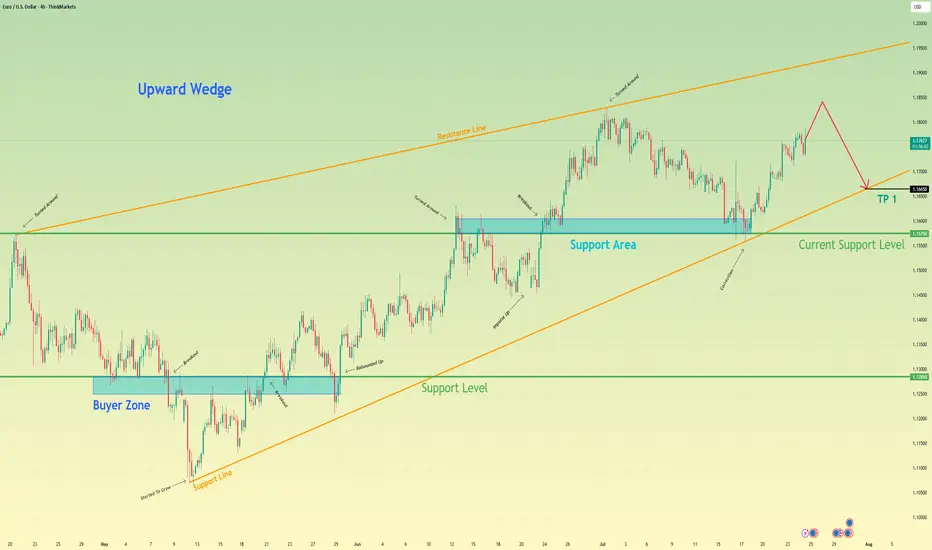
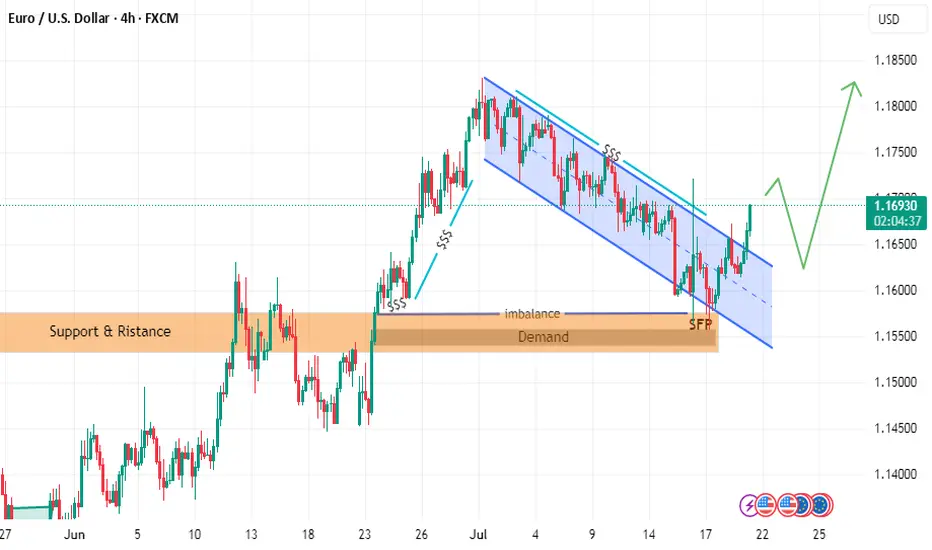
Euro will rise a little and then start to fall to support lineHello traders, I want share with you my opinion about Euro. After a prolonged consolidation period, a strong upward trend was initiated from the buyer zone around 1.1285, propelling the EUR significantly higher. This initial impulsive move has since transitioned into a more complex and mature phase, taking the shape of a large upward wedge formation, a pattern which often signals underlying exhaustion in the prevailing trend. Currently, the pair is operating within this defined market zone, characterized by a clear ascending support line and a corresponding resistance line. The price action inside the wedge has become corrective, with the most recent upward correction originating from the support area near 1.1575. The working hypothesis is centered on a short-term bearish scenario, which anticipates that this current rally will fail as it approaches the upper boundary of the wedge. A rejection from this resistance would confirm that selling pressure is increasing and that the bullish momentum is waning. This would likely trigger a significant downward rotation within the structure, with the immediate objective being a retest of the main ascending support line. For this reason, the TP is strategically and logically placed at the 1.1665 level, as this point lies directly on the trend line and serves as the most critical test for the existing uptrend's viability. Please share this idea with your friends and click Boost 🚀
Disclaimer: As part of ThinkMarkets’ Influencer Program, I am sponsored to share and publish their charts in my analysis.
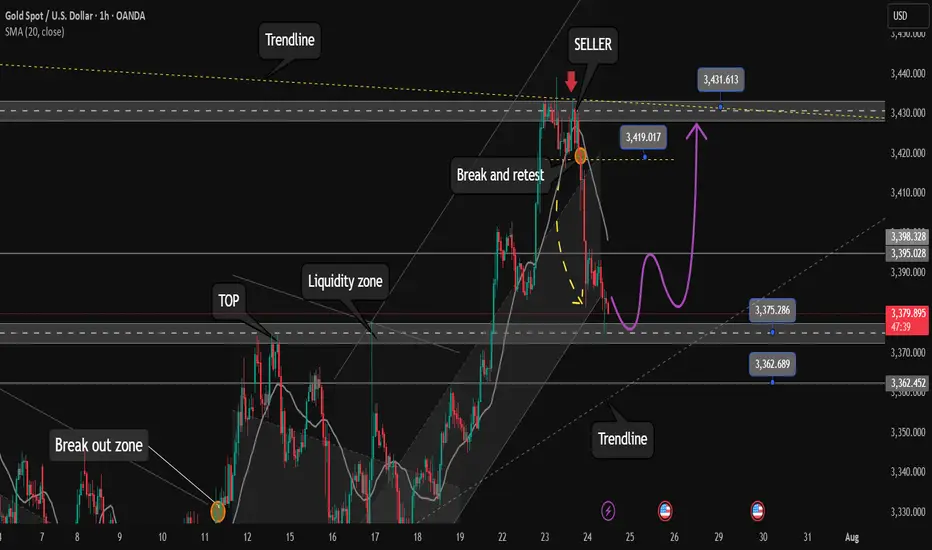
Some investors take profits. Opportunity to buy gold to 3500?✏️ OANDA:XAUUSD price correction of 50 appeared yesterday. This is obvious to happen in a sustainable uptrend. Today's strategy will look for liquidity sweeps to support to BUY to ATH 3500. Gold's current border zone is limited by the upper and lower trendlines. Be careful not to trade against the trend when breaking the trend zone.
📉 Key Levels
Support: 3375 -3363
Resistance: 3418-3431-3490
Buy trigger: Buyers react at 3375
Buy zone: 3363
Target: 3430; level higher at 3490
Leave your comments on the idea. I am happy to read your views.
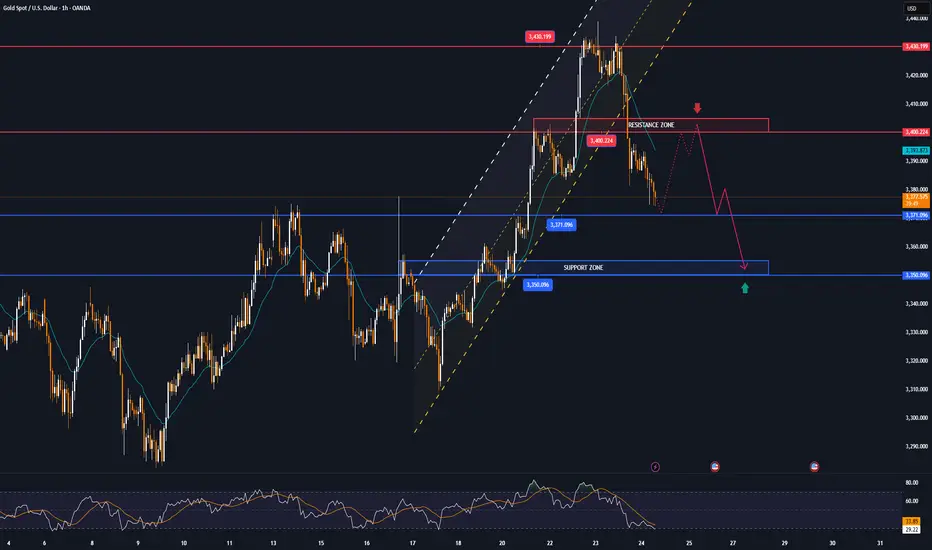
From 3,430 USD GOLD falls below 3,400 USD on optimistic newsOANDA:XAUUSD has suffered a sharp sell-off after rising sharply earlier in the week. Media reports said the United States and the European Union were getting closer to reaching a tariff deal, and the news weighed on safe-haven demand.
OANDA:XAUUSD fell below $3,400 an ounce on Wednesday, down more than 1.2%, following news that the United States and the European Union were close to signing a deal similar to the one Washington and Tokyo signed on Tuesday. It is now trading below that key base point.
The European Union and the United States are moving toward a trade deal that could see more EU goods hit with a 15 percent U.S. import tariff, two diplomats said. Earlier, U.S. President Donald Trump reached a trade deal with Japan that would cut auto tariffs to 15 percent.
Optimism about an imminent U.S.-EU trade deal overshadowed a decline in the U.S. dollar. The U.S. dollar index (DXY), which measures the greenback against a basket of six currencies, fell 0.05 percent on the day to 97.160.
U.S. Treasury yields rose, with the 10-year Treasury yield rising to 4.396%. U.S. real yields, calculated by subtracting inflation expectations from nominal yields, rose nearly 4 basis points to 1.994%.
Gold tends to gain in value during times of uncertainty and low-interest-rate environments because gold itself does not generate interest, and in low-interest-rate environments, the opportunity cost of holding gold is relatively low.
U.S., EU near trade deal
The Financial Times reported on Wednesday that the European Union and the United States are close to reaching a trade deal that would impose a 15% tariff on imports from Europe, similar to the one reached between US President Donald Trump and Japan this week.
The Financial Times reported that Brussels is likely to agree to so-called “reciprocal tariffs” to avoid tariffs that Trump has threatened to impose on EU goods of up to 30% from August 1.
“The agreement reached with Japan is clearly extortionate in terms. Most member states are swallowing their anger and are likely to accept the deal,” an EU diplomat said.
The two sides will exempt some products, including aircraft, spirits and medical equipment, from tariffs.
The agreement between the US and Japan has also left Brussels reluctant to accept higher reciprocal tariffs to avoid a damaging trade war, according to the Financial Times.
Technical Outlook Analysis OANDA:XAUUSD
On the daily chart, after gold reached its target at $3,430, it failed to break above this important resistance level and fell slightly. The decline brought gold back to test the support confluence area, which is the location of the 0.236% Fibonacci retracement with the lower edge of the price channel. And with the current position, gold still technically has enough conditions for a possible increase in price.
Specifically, gold is still in/above the supports from the short-term price channel, the long-term rising price channel and the support from the EMA21, as long as gold is still trading above the EMA21, it still has a bullish outlook in the short term. On the other hand, the short-term target is still at 3,430 USD, while once the 3,430 USD level is broken, it will provide the possibility of further upside with the next target at around 3,450 USD in the short term, more than the all-time high.
RSI remains above 50, far from the 80 – 100 area (overbought area). Showing that there is still a lot of room for upside ahead.
During the day, the technical outlook for gold prices continues to favor upside and notable positions will be listed as follows.
Support: 3,371 – 3,350 USD
Resistance: 3,400 – 3,430 – 3,450 USD
SELL XAUUSD PRICE 3421 - 3419⚡️
↠↠ Stop Loss 3425
→Take Profit 1 3413
↨
→Take Profit 2 3407
BUY XAUUSD PRICE 3354 - 3356⚡️
↠↠ Stop Loss 3350
→Take Profit 1 3362
↨
→Take Profit 2 3368
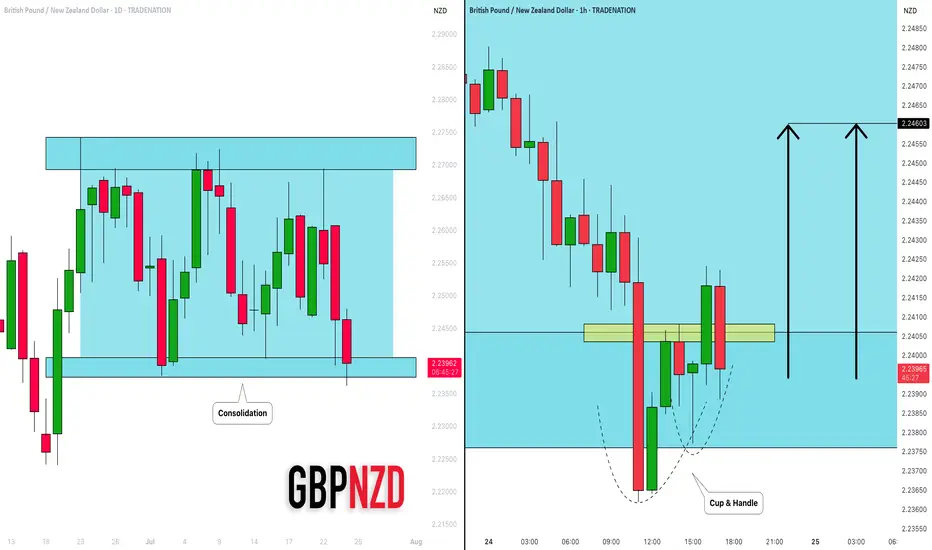
GBPNZD: Bullish Move in a Channel 🇬🇧🇳🇿
I see a horizontal parallel channel on GBPNZD on a daily.
The price is currently testing its support.
On an hourly time frame, a cup & handle pattern was formed on that.
Its neckline was violated with the today's high impact news.
I think that the price may bounce at least to 2.246 level.
❤️Please, support my work with like, thank you!❤️
I am part of Trade Nation's Influencer program and receive a monthly fee for using their TradingView charts in my analysis.
SHIB/USDT: A Fight for Recovery?SHIB/USDT is currently trading around $0.00001363, marking an approximately 11.5% drop over the past 24 hours. However, it's crucial to note that the price is successfully holding above the key support level of $0.00001373.
Recently, we've witnessed a significant increase in the activity of so-called "large holders" or "whales" concerning SHIB/USDT. Their netflow has reached a two-month high, signaling heightened interest. In the past 24 hours, addresses holding at least 0.1% of the total SHIB supply accumulated an impressive 4.66 trillion SHIB, representing an investment of a staggering $63.7 million. These major players clearly believe in the potential for a price recovery.
What's Next? Scenarios for SHIB/USDT
Bullish Scenario (Uptrend):
Should SHIB/USDT successfully bounce off the support level at $0.00001317, it would likely pave the way for further price appreciation. It could potentially reach $0.00001423. If this level solidifies as new support, it would mark a full recovery of today's losses and could initiate a new uptrend, provided that broader market conditions remain favorable. The investment by the whales would be crucial in this scenario.
Bearish Scenario (Downtrend):
However, if SHIB/USDT fails to hold above the support of $0.00001317 and falls below this level (likely due to profit-taking by other market participants), the popular "meme coin" could slip to $0.00001188. Such a development would invalidate the bullish thesis and further reduce investor confidence. The next few days will be critical for SHIB to demonstrate whether it can
maintain its current support levels.
#forex #SHIB #USDT #SwingTrade

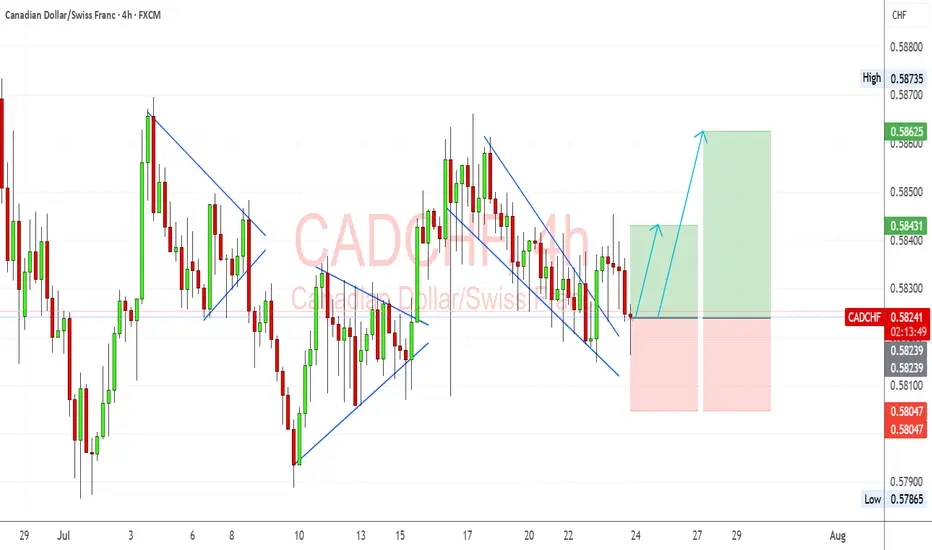
CADCHF Bullish Reversal in Motion Channel Break & Momentum ShiftCADCHF setup is developing into a potential bullish recovery after a breakout from a falling wedge. I’m looking for signs of buyer control as price attempts to build higher structure off the recent breakout.
📊 Technical View (My Setup Insight):
Falling Wedge Breakout: Price has cleanly broken out of the descending channel/wedge formation. That’s often a reversal signal, especially near support zones.
Support Holding: The pair found buyers around 0.5810–0.5820, an area tested multiple times in July. This zone has acted as a soft base.
Bullish Flag Recovery: Prior corrective patterns (flags/pennants) were followed by strong impulsive moves, and we may be repeating this pattern now.
Next Targets:
TP1: 0.5843 – aligns with previous structure and minor resistance.
TP2: 0.5862 – near the most recent high and top of consolidation.
Stop-Loss: Below 0.5800 to invalidate the reversal structure.
🧮 Fundamental Drivers (My Outlook):
CAD Support from Oil Stability: Oil prices have firmed around $78–$80, which helps the CAD via improved trade and energy revenue prospects.
SNB Stance Neutral-Dovish: Swiss inflation remains soft, and SNB has signaled comfort with its current policy rate, reducing CHF bullish pressure.
BoC Hawkish Bias: Despite softening Canadian CPI, the BoC remains cautious and hasn’t ruled out future hikes. CAD remains supported relative to CHF.
Global Risk Mood: CHF is sensitive to risk-off flows. With equities and commodities rebounding modestly, safe haven flows into CHF may slow.
⚠️ Risks to the Setup:
A sudden drop in oil prices could hurt CAD.
Risk-off sentiment due to geopolitical tensions or US equity selloffs could fuel CHF strength.
Any surprise SNB jawboning about FX could cause CHF to spike.
📆 Upcoming Events to Monitor:
Canadian GDP / Retail Sales – if strong, reinforces CAD recovery.
Swiss KOF Economic Barometer – gives insight into CHF macro tone.
Oil Inventories – strong builds or drawdowns influence CAD indirectly.
🔁 Leader/Lagger Context:
CADCHF is often a lagger, especially when risk sentiment or oil makes bigger moves. It can follow USDCHF or USDCAD behavior due to shared components.
If oil or global risk sentiment shifts, CADCHF tends to react with a small lag, making it great for secondary confirmation trades.
🧩 Summary – Bias & Watchpoints:
I currently hold a bullish bias on CADCHF following the falling wedge breakout and support defense. Fundamentals are moderately in favor of CAD due to oil stability and BoC’s cautious stance versus the more passive SNB. Key risks include any renewed CHF demand from risk-off shifts or soft Canadian economic surprises. The most critical levels now lie at 0.5843 and 0.5862 for upside targets, while 0.5800 remains key invalidation support.
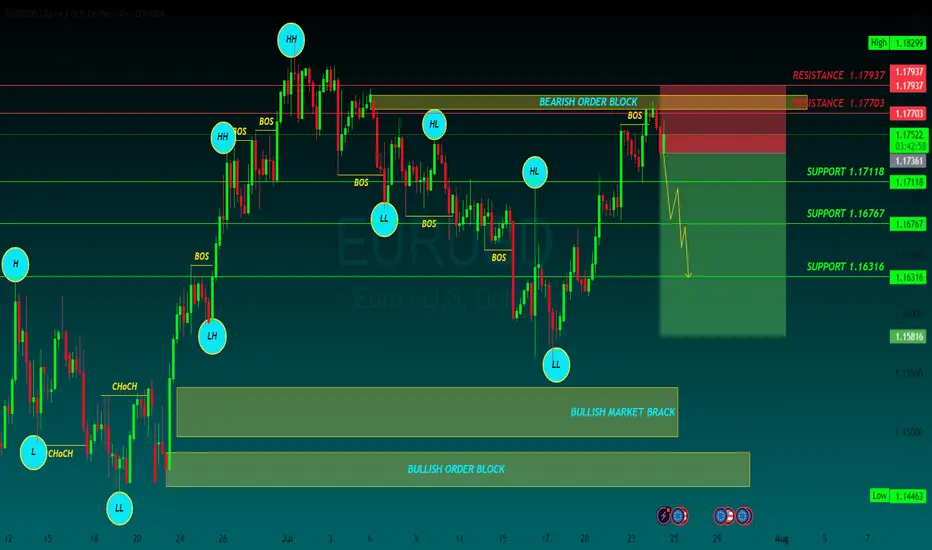
EURUSD SELLEUR/USD stays defensive below 1.1800 ahead of ECB decision
EUR/USD remains in a bullish consolidation mode below 1.1800 in European trading on Thursday. Traders refrain from placing fresh bets ahead of the European Central Bank policy announcements and the US preliminary PMI data. Mixed PMI data from Germany and the Eurozone failed to trigger a noticeable reaction.
The EUR/USD pair retreated from a fresh two-week peak at 1.1781 posted during Asian trading hours, hovering around 1.1750 ahead of the European Central Bank (ECB) monetary policy announcement. The US Dollar (USD) edged lower on the back of risk appetite, amid headlines indicating a trade deal between Japan and the United States (US).
US President Donald Trump announced in a post on social media a trade deal with Japan that sets "reciprocal" tariffs at 15% on Tuesday, while Japanese Prime Minister Shigeru Ishiba acknowledged the trade agreement on Wednesday, saying it would benefit both sides. Trump shifted his attention to the European Union (EU), noting that if the Union agrees to open up to US businesses, he will then charge lower levies.
Meanwhile, the Hamburg Commercial Bank (HCOB) published the preliminary estimates of the July Purchasing Managers’ Indexes (PMIs). European growth stands at its highest in almost a year according to the surveys, as the Composite PMI rose to 51.0 in July from 50.6 in Jun,e while beating expectations of 50.8.
As for the ECB, the central bank announced its decision to keep the benchmark rates on hold, as widely anticipated. The interest rate on the main refinancing operations, the interest rates on the marginal lending facility and the deposit facility stood at 2.15%, 2.4% and 2%, respectively. The headline had no impact on EUR/USD, which kept trading at around 1.1750.
Right afterwards, the US released Initial Jobless Claims for the week ended July 19, which improved to 217K from the 221K previously posted and the 227K anticipated. Coming up next is ECB President Christine Lagarde's press conference, and the US S&P Global preliminary July PMIs.
SUPPORT 1.17118
SUPPORT 1.16767
SUPPORT 1.16316
RESISTANCE 1.17937
RESISTANCE 1.17703
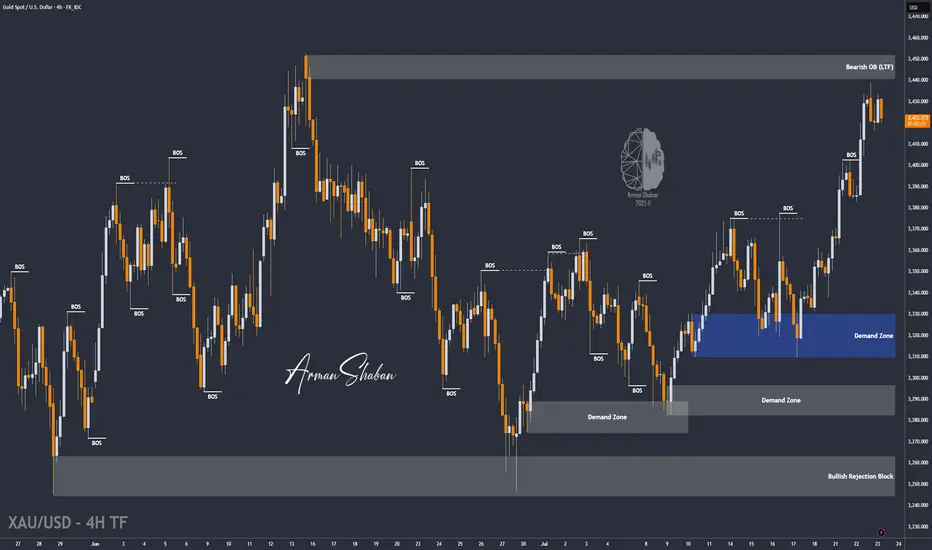
XAU/USD | Watching for Potential Drop Toward $3391! (READ)By analyzing the gold chart on the 4-hour timeframe, we can see that gold continued its bullish move after holding above $3409, successfully hitting the $3440 target and delivering over 200 pips in returns! After reaching this key supply zone, gold corrected down to $3415 and is now trading around $3421. If the price stabilizes below $3431, we can expect further downside movement, with the next bearish targets at $3415, $3404, and $3391. If this scenario fails, an alternative setup will be shared.
Please support me with your likes and comments to motivate me to share more analysis with you and share your opinion about the possible trend of this chart with me !
Best Regards , Arman Shaban
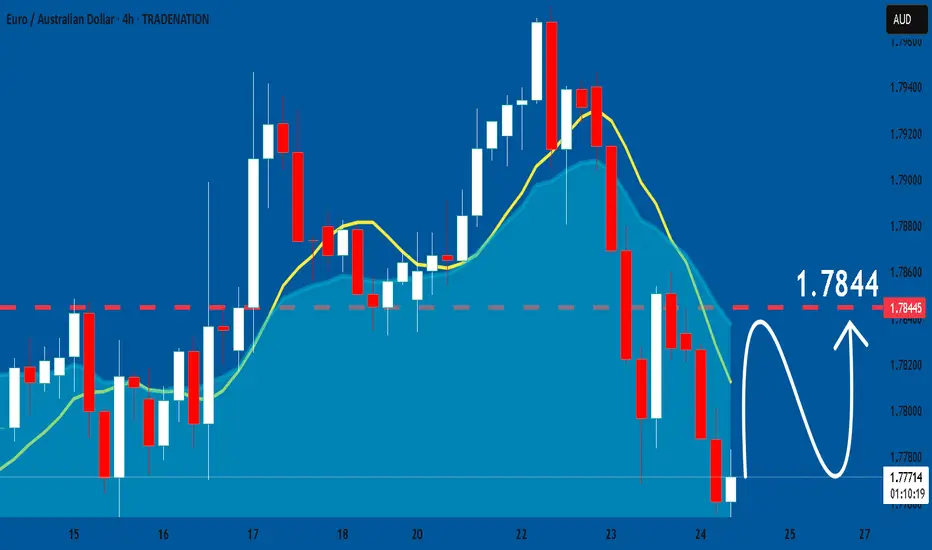
EURAUD: Bullish Forecast & Outlook
Our strategy, polished by years of trial and error has helped us identify what seems to be a great trading opportunity and we are here to share it with you as the time is ripe for us to buy EURAUD.
Disclosure: I am part of Trade Nation's Influencer program and receive a monthly fee for using their TradingView charts in my analysis.
❤️ Please, support our work with like & comment! ❤️
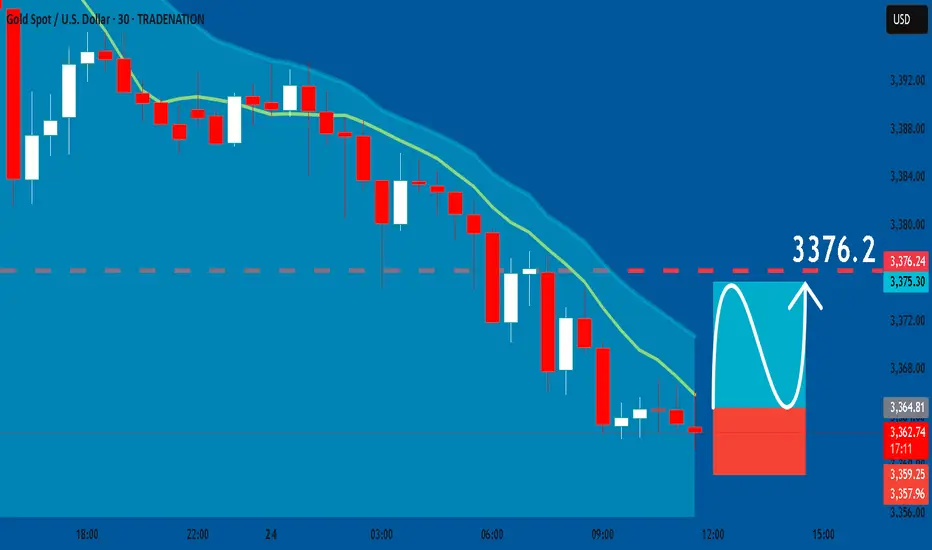
GOLD: Bullish Continuation & Long Signal
GOLD
- Classic bullish formation
- Our team expects growth
SUGGESTED TRADE:
Swing Trade
Buy GOLD
Entry Level - 3364.8
Sl - 3359.2
Tp - 3376.2
Our Risk - 1%
Start protection of your profits from lower levels
Disclosure: I am part of Trade Nation's Influencer program and receive a monthly fee for using their TradingView charts in my analysis.
❤️ Please, support our work with like & comment! ❤️
Is USDCAD staring at a new low for 2025?FX_IDC:USDCAD ready for a lower low? Let's see.
MARKETSCOM:USDCAD
Let us know what you think in the comments below.
Thank you.
75.2% of retail investor accounts lose money when trading CFDs with this provider. You should consider whether you understand how CFDs work and whether you can afford to take the high risk of losing your money. Past performance is not necessarily indicative of future results. The value of investments may fall as well as rise and the investor may not get back the amount initially invested. This content is not intended for nor applicable to residents of the UK. Cryptocurrency CFDs and spread bets are restricted in the UK for all retail clients.

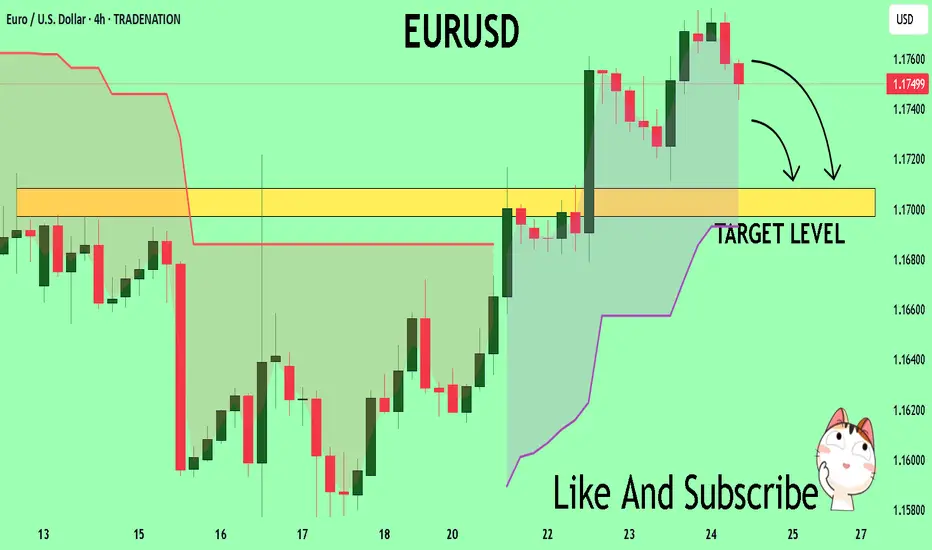
EURUSD A Fall Expected! SELL!
My dear friends,
Please, find my technical outlook for EURUSD below:
The instrument tests an important psychological level 1.1751
Bias - Bearish
Technical Indicators: Supper Trend gives a precise Bearish signal, while Pivot Point HL predicts price changes and potential reversals in the market.
Target - 1.1708
About Used Indicators:
Super-trend indicator is more useful in trending markets where there are clear uptrends and downtrends in price.
Disclosure: I am part of Trade Nation's Influencer program and receive a monthly fee for using their TradingView charts in my analysis.
———————————
WISH YOU ALL LUCK
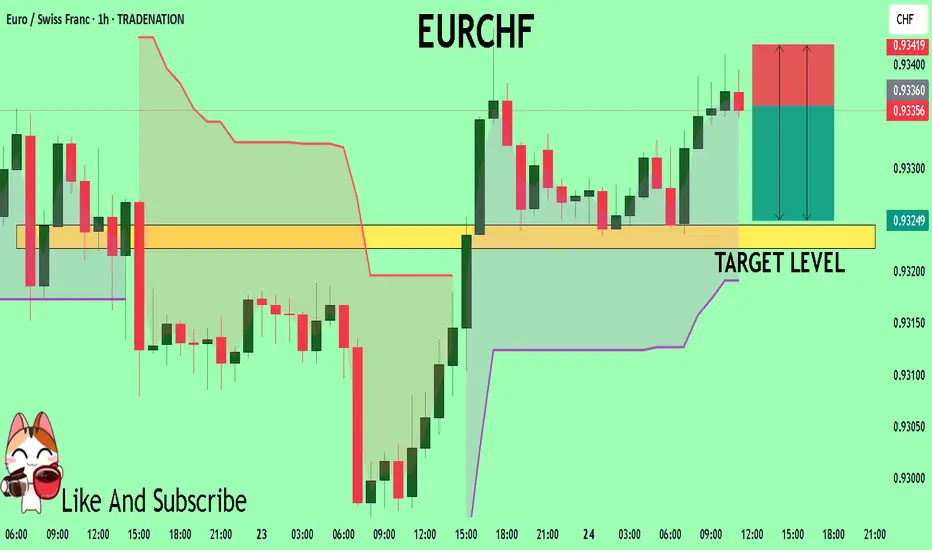
EURCHF Trading Opportunity! SELL!
My dear subscribers,
EURCHF looks like it will make a good move, and here are the details:
The market is trading on 0.9335 pivot level.
Bias - Bearish
My Stop Loss - 0.9341
Technical Indicators: Both Super Trend & Pivot HL indicate a highly probable Bearish continuation.
Target - 0.9324
About Used Indicators:
The average true range (ATR) plays an important role in 'Supertrend' as the indicator uses ATR to calculate its value. The ATR indicator signals the degree of price volatility.
Disclosure: I am part of Trade Nation's Influencer program and receive a monthly fee for using their TradingView charts in my analysis.
———————————
WISH YOU ALL LUCK
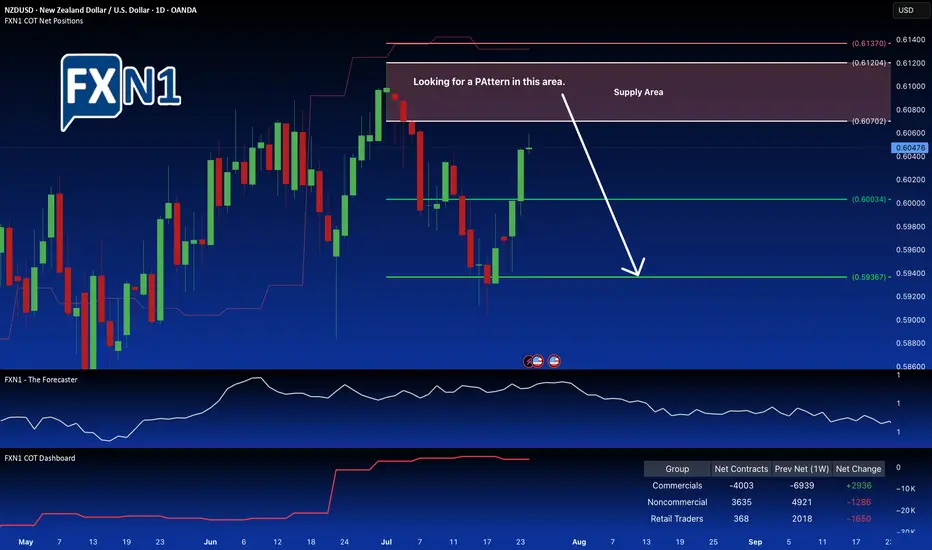
NZD/USD Weekly Bearish Trend Faces Critical Supply LevelThe NZD/USD pair is nearing a significant supply zone near 0.6070, where notable market activity is unfolding. Non-commercial traders are beginning to trim their holdings, signaling a potential shift in market sentiment. Conversely, commercial traders are at their lowest net positions since August 2024 and are starting to accumulate again, creating a divergence between these two groups.
This divergence, combined with the presence of a defined supply area and seasonal factors, suggests a possible reversal point in the current downtrend. On the weekly chart, the overall trend remains bearish, but the confluence of these technical and seasonal signals points toward a potential reversal pattern forming within the supply zone.
Traders may consider monitoring this area for signs of a reversal, potentially setting up for a short position if a clear pattern confirms the shift in momentum. Overall, the setup indicates a cautious opportunity for a bearish trade, provided the price action confirms the anticipated reversal.
✅ Please share your thoughts about NZD/USD in the comments section below and HIT LIKE if you appreciate my analysis. Don't forget to FOLLOW ME; you will help us a lot with this small contribution.
follow EURUSD LION & PLANE BUY SETUPTHE PRICE has moved as I explained in the last two posts
but we have some update to go along the way
the price could break failing channel
and withdrawal liquidity and filled imbalance
hence reflect from demand zone with zero reflection as i explained in last post with rock and plane
and it will go up to take liquidity in failing channel or downtrend
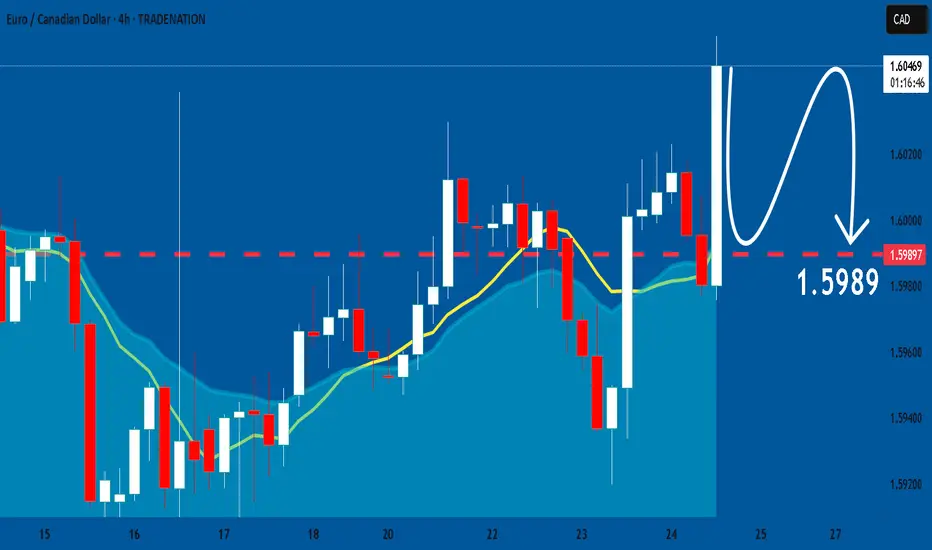
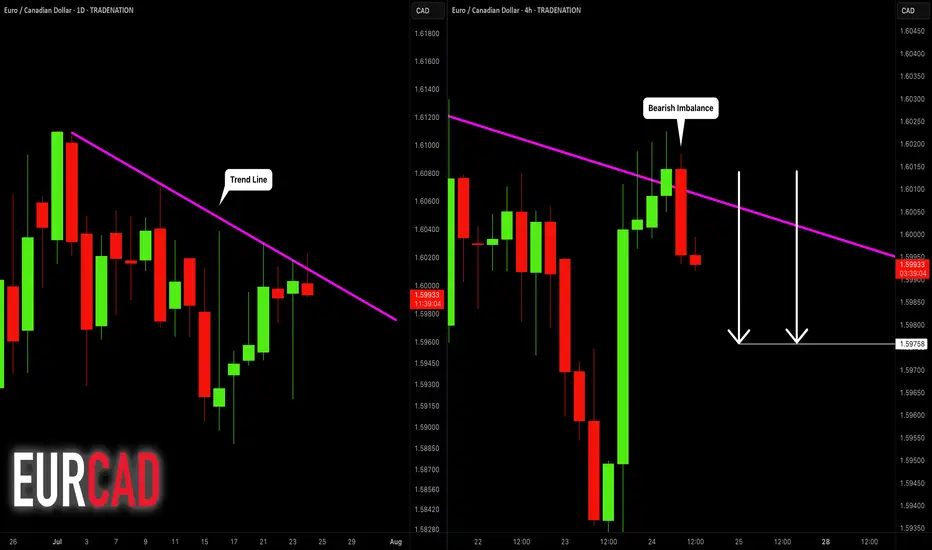
EURCAD: Bearish After the News 🇪🇺🇨🇦
EURCAD may drop from a solid daily resistance.
As a confirmation signal, I spotted a bearish engulfing candle
on a 4H time frame after its test.
The formation of this candle is accompanied by multiple negative
German fundamentals.
Goal - 1.5976
❤️Please, support my work with like, thank you!❤️
I am part of Trade Nation's Influencer program and receive a monthly fee for using their TradingView charts in my analysis.
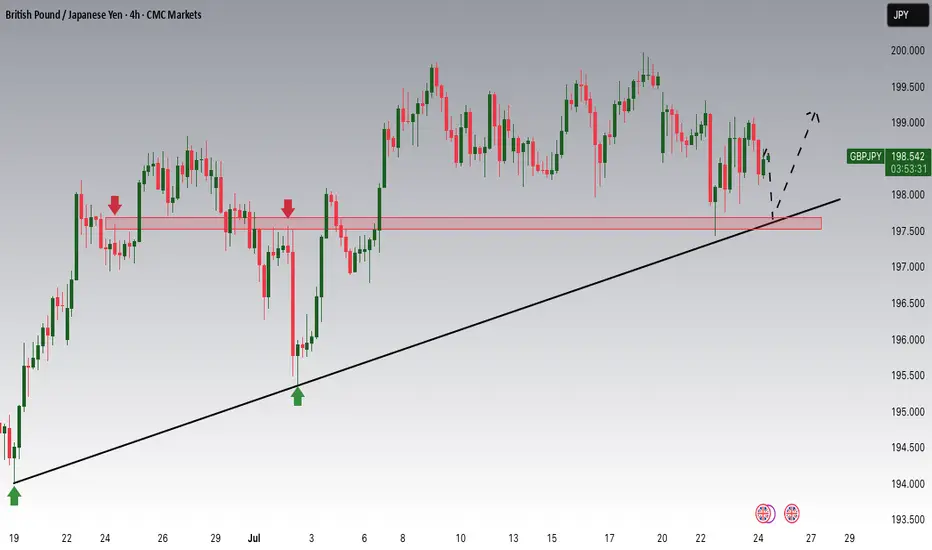
GBPJPY Potential UpsidesHey Traders, in today's trading session we are monitoring GBPJPY for a buying opportunity around 197.700 zone, GBPJPY is trading in an uptrend and currently is in a correction phase in which it is approaching the trend at 197.700 support and resistance area.
Trade safe, Joe.