Bullish momentum to extend?The Fiber (EUR/USD) is reacting off the pivot and could rise to the 127.2% Fibonacci resistance.
Pivot: 1.1746
1st Support: 1.1659
1st Resistance: 1.1907
Risk Warning:
Trading Forex and CFDs carries a high level of risk to your capital and you should only trade with money you can afford to lose. Trading Forex and CFDs may not be suitable for all investors, so please ensure that you fully understand the risks involved and seek independent advice if necessary.
Disclaimer:
The above opinions given constitute general market commentary, and do not constitute the opinion or advice of IC Markets or any form of personal or investment advice.
Any opinions, news, research, analyses, prices, other information, or links to third-party sites contained on this website are provided on an "as-is" basis, are intended only to be informative, is not an advice nor a recommendation, nor research, or a record of our trading prices, or an offer of, or solicitation for a transaction in any financial instrument and thus should not be treated as such. The information provided does not involve any specific investment objectives, financial situation and needs of any specific person who may receive it. Please be aware, that past performance is not a reliable indicator of future performance and/or results. Past Performance or Forward-looking scenarios based upon the reasonable beliefs of the third-party provider are not a guarantee of future performance. Actual results may differ materially from those anticipated in forward-looking or past performance statements. IC Markets makes no representation or warranty and assumes no liability as to the accuracy or completeness of the information provided, nor any loss arising from any investment based on a recommendation, forecast or any information supplied by any third-party.
Forex

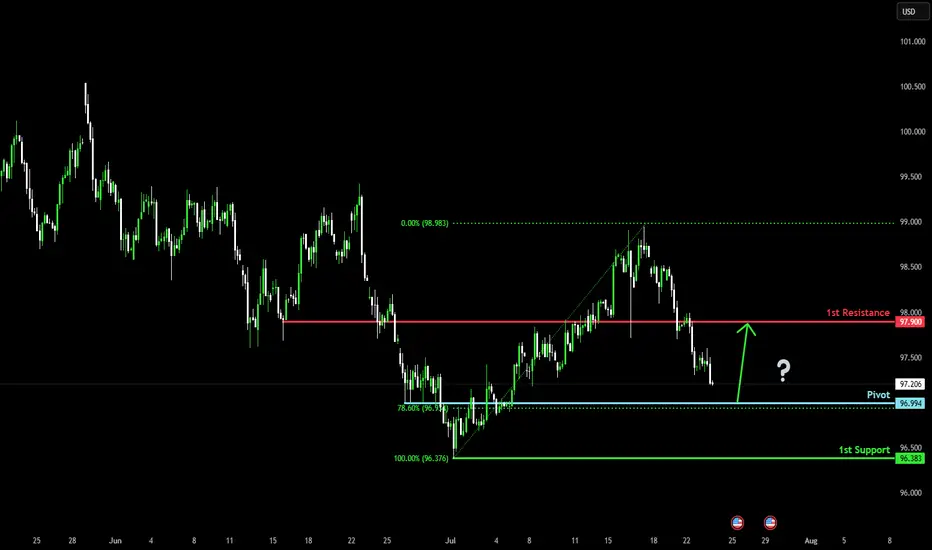
Bullish reversal?US Dollar Index (DXY) is falling towards the pivot and could bounce to the 1st resistance, which is an overlap resistance.
Pivot: 96.99
1st Support: 96.38
1st Resistance: 97.90
Risk Warning:
Trading Forex and CFDs carries a high level of risk to your capital and you should only trade with money you can afford to lose. Trading Forex and CFDs may not be suitable for all investors, so please ensure that you fully understand the risks involved and seek independent advice if necessary.
Disclaimer:
The above opinions given constitute general market commentary, and do not constitute the opinion or advice of IC Markets or any form of personal or investment advice.
Any opinions, news, research, analyses, prices, other information, or links to third-party sites contained on this website are provided on an "as-is" basis, are intended only to be informative, is not an advice nor a recommendation, nor research, or a record of our trading prices, or an offer of, or solicitation for a transaction in any financial instrument and thus should not be treated as such. The information provided does not involve any specific investment objectives, financial situation and needs of any specific person who may receive it. Please be aware, that past performance is not a reliable indicator of future performance and/or results. Past Performance or Forward-looking scenarios based upon the reasonable beliefs of the third-party provider are not a guarantee of future performance. Actual results may differ materially from those anticipated in forward-looking or past performance statements. IC Markets makes no representation or warranty and assumes no liability as to the accuracy or completeness of the information provided, nor any loss arising from any investment based on a recommendation, forecast or any information supplied by any third-party.
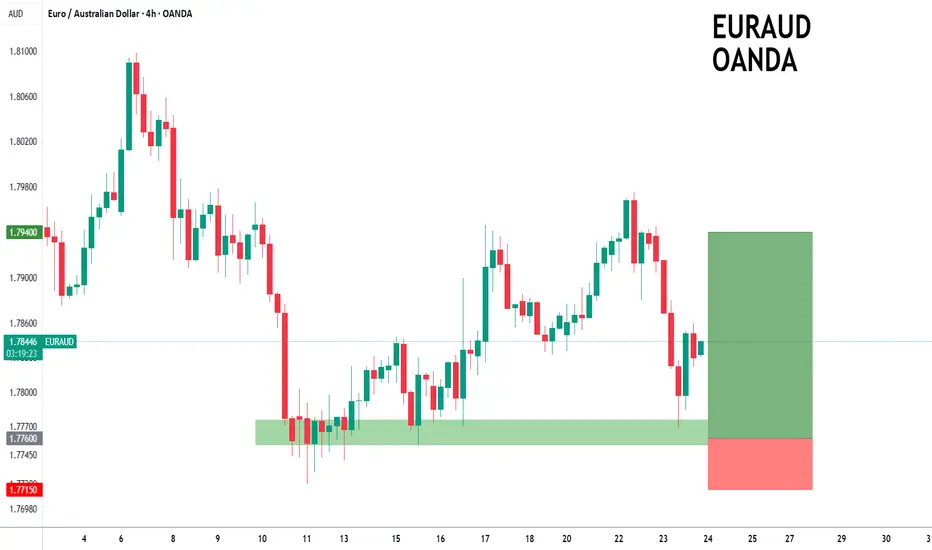
EURAUD to find buyers at previous support?EURAUD - 24h expiry
The primary trend remains bullish.
We are trading at oversold extremes.
Preferred trade is to buy on dips.
Risk/Reward would be poor to call a buy from current levels.
Bespoke support is located at 1.7760.
We look to Buy at 1.7760 (stop at 1.7715)
Our profit targets will be 1.7940 and 1.7960
Resistance: 1.7840 / 1.7900 / 1.7950
Support: 1.7750 / 1.7720 / 1.7700
Risk Disclaimer
The trade ideas beyond this page are for informational purposes only and do not constitute investment advice or a solicitation to trade. This information is provided by Signal Centre, a third-party unaffiliated with OANDA, and is intended for general circulation only. OANDA does not guarantee the accuracy of this information and assumes no responsibilities for the information provided by the third party. The information does not take into account the specific investment objectives, financial situation, or particular needs of any particular person. You should take into account your specific investment objectives, financial situation, and particular needs before making a commitment to trade, including seeking, under a separate engagement, as you deem fit.
You accept that you assume all risks in independently viewing the contents and selecting a chosen strategy.
Where the research is distributed in Singapore to a person who is not an Accredited Investor, Expert Investor or an Institutional Investor, Oanda Asia Pacific Pte Ltd (“OAP“) accepts legal responsibility for the contents of the report to such persons only to the extent required by law. Singapore customers should contact OAP at 6579 8289 for matters arising from, or in connection with, the information/research distributed.
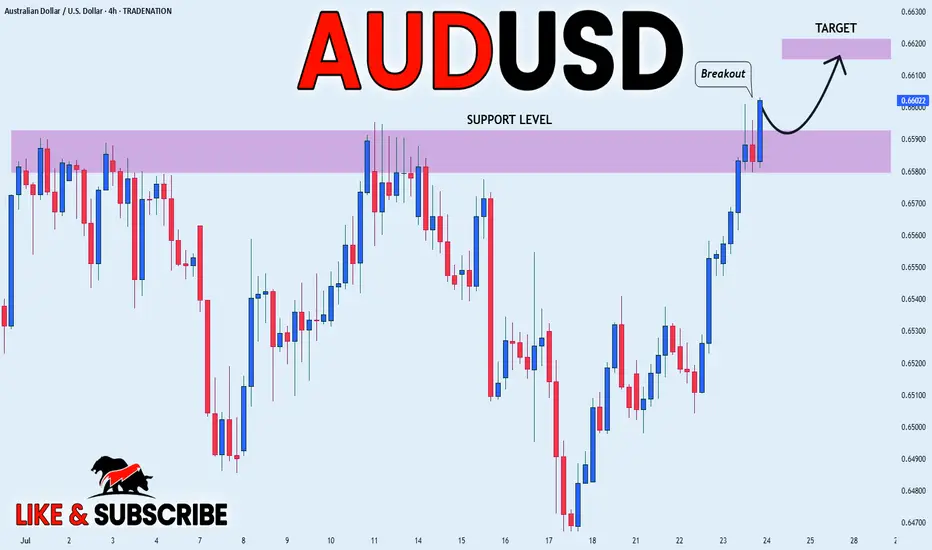
AUD_USD BULLISH BREAKOUT|LONG|
✅AUD_USD is going up
Now and the pair made a bullish
Breakout of the key horizontal
Level of 0.6590 and the breakout
Is confirmed so we are bullish
Biased and we will be expecting
A further bullish move up
LONG🚀
✅Like and subscribe to never miss a new idea!✅
Disclosure: I am part of Trade Nation's Influencer program and receive a monthly fee for using their TradingView charts in my analysis.
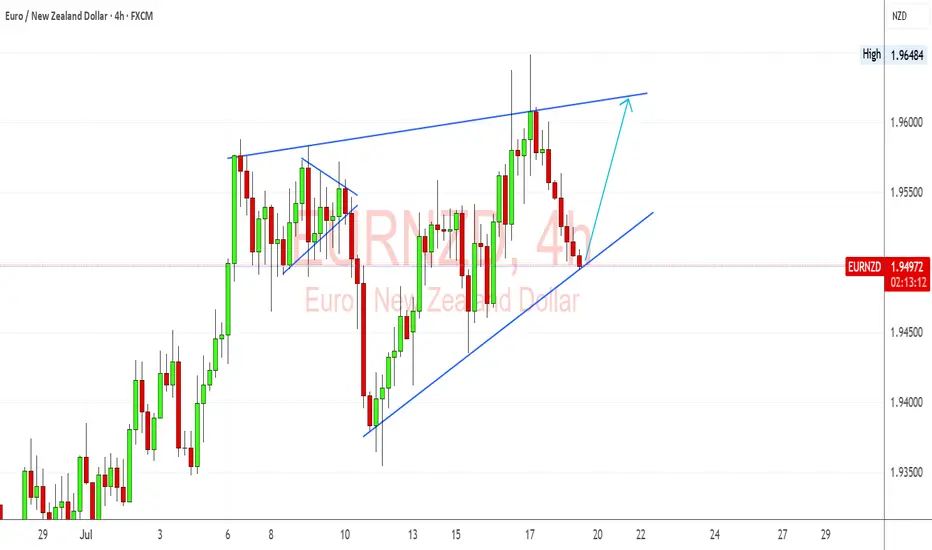
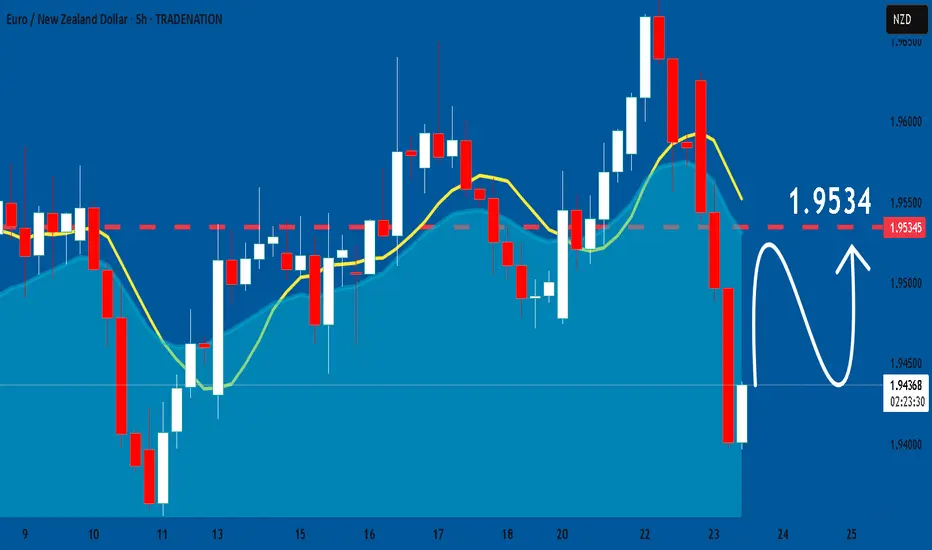
EURNZD Trendline & Hawkish ECB Bias Support Bullish ContinuationEURNZD is holding beautifully above the ascending trendline on the 4H, and I’m watching this level closely for a bounce continuation setup. Fundamentally, the euro remains supported by sticky inflation and hawkish ECB commentary, while the kiwi is showing softness after dovish signals from the RBNZ and mixed jobs data. If this trendline holds, I’ll be targeting a retest of the upper wedge resistance near 1.9640.
🔍 Technical Setup (4H):
Structure: Ascending triangle forming – price is pressing into dynamic support.
Support Zone: Around 1.9480 trendline area – price rejected this level several times in July.
Resistance Target: 1.9640 highs – double top and triangle resistance.
Bullish Confirmation: Rebound with bullish engulfing or strong 4H close above 1.9525 could trigger long setup.
Invalidation: Clean break below trendline and 1.9440 invalidates bullish scenario short-term.
💡 Fundamental Insight:
EUR Drivers:
ECB members remain cautious about declaring victory on inflation.
German and Eurozone CPI data remain above target, supporting higher-for-longer ECB stance.
Speculation that ECB won't cut aggressively compared to RBNZ.
NZD Weakness:
RBNZ minutes show concern over downside inflation risks.
Labor market cooling, and migration pressures remain high.
Commodity and China-linked sentiment weakening NZD.
⚠️ Key Risks:
If Eurozone inflation or PMI data surprises to the downside, EUR may weaken.
RBNZ hawkish pivot or surprise tightening would flip sentiment toward NZD.
Global risk-on could favor NZD as a high-beta currency.
🧭 Summary:
I’m bullish on EURNZD as long as price holds above the trendline near 1.9480. The technical structure shows a clean ascending pattern, and the fundamentals currently favor EUR strength over NZD. My eyes are on a potential move toward 1.9640, especially if upcoming ECB rhetoric stays hawkish. EURNZD tends to lead NZD-crosses like NZDJPY or NZDCHF in risk-off regimes and could signal euro strength if it breaks out. Watching closely for price action confirmation.
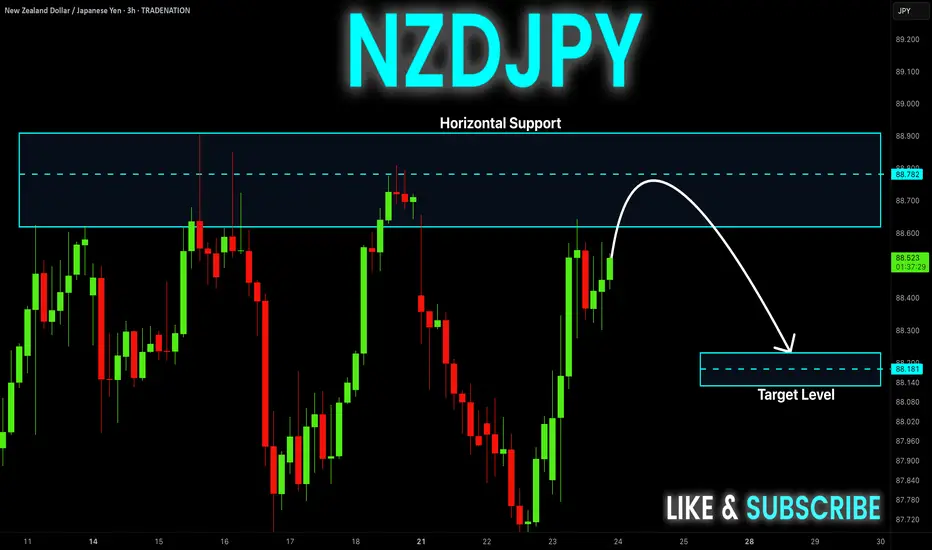
NZD-JPY Resistance Ahead! Sell!
Hello,Traders!
NZD-JPY is trading in an
Uptrend but the pair is locally
Overbought so after the pair
Hits the horizontal resistance
Level of 88.900 we will be
Expecting a local bearish
Move down
Sell!
Comment and subscribe to help us grow!
Check out other forecasts below too!
Disclosure: I am part of Trade Nation's Influencer program and receive a monthly fee for using their TradingView charts in my analysis.
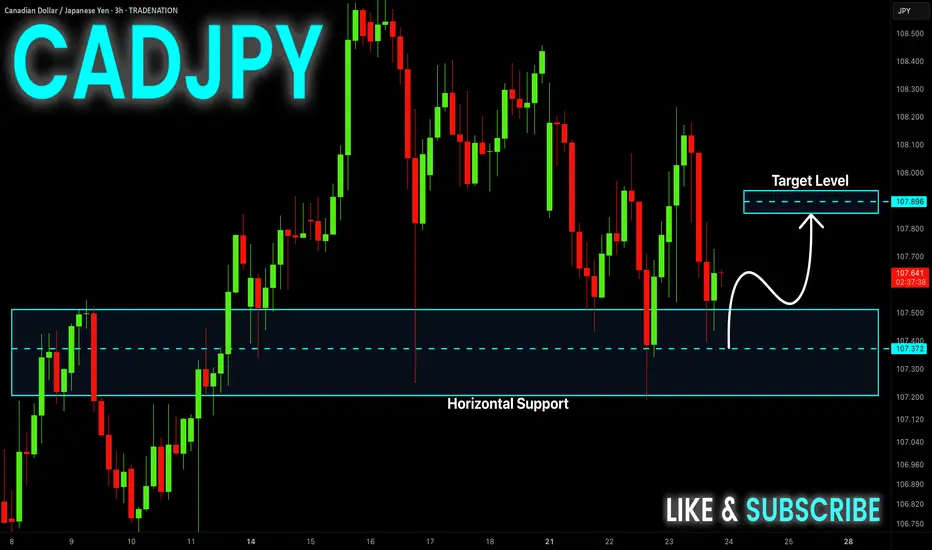
CAD-JPY Local Long! Buy!
Hello,Traders!
CAD-JPY made a retest
Of the horizontal support
Level of 107.400 and we
Are already seeing a bullish
Rebound and we will be
Expecting a further local
Bullish move up
Buy!
Comment and subscribe to help us grow!
Check out other forecasts below too!
Disclosure: I am part of Trade Nation's Influencer program and receive a monthly fee for using their TradingView charts in my analysis.
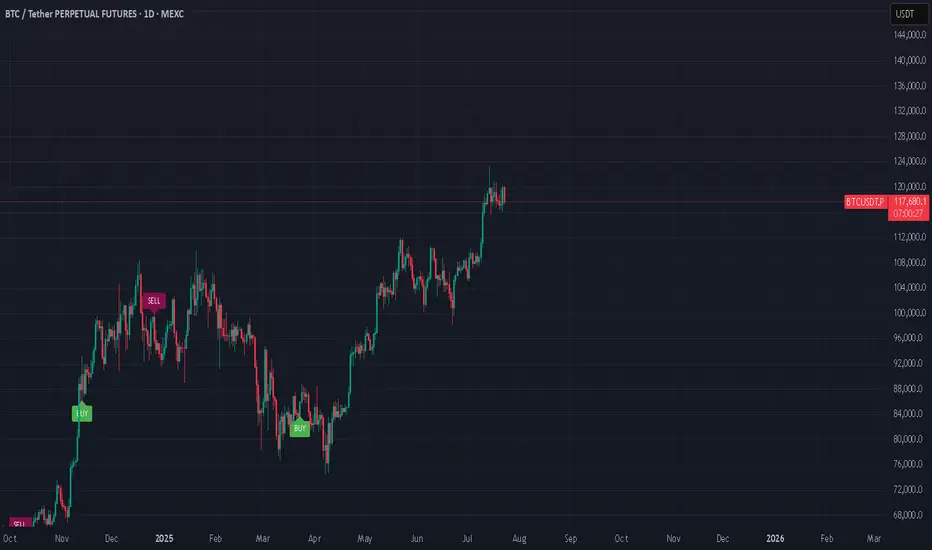
Tariffs incoming...July 23: Markets are booming.
August 1st: Tariffs.
I'm just saying, it might be a nice discount...
#market #finance #tariff #trump #crypto #forex #stocks #economy #trading
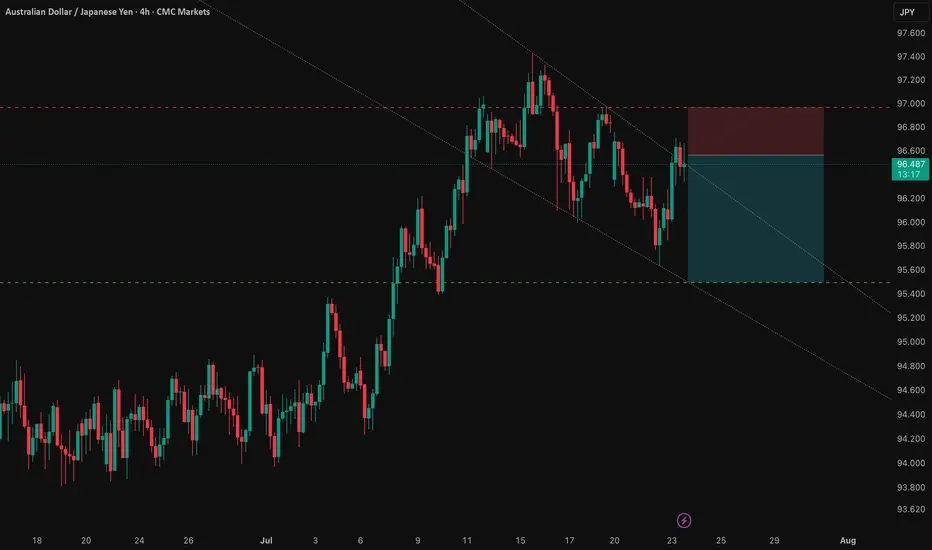
AUD/JPY: Capitalizing on the RBA-BoJ Monetary Policy GapThis analysis outlines a compelling short opportunity in AUD/JPY, driven by a powerful confluence of fundamental and technical factors. The trade is strategically positioned ahead of a key catalyst that could unlock significant downside potential.
1️⃣ The Core Thesis: A Clear Policy Divergence
The primary driver behind this trade is the stark and widening gap in monetary policy between the Reserve Bank of Australia (RBA) and the Bank of Japan (BoJ). The RBA is signaling a clear dovish pivot amid a weakening labor market, making an interest rate cut imminent. Conversely, the BoJ is in a tightening phase, creating a fundamental headwind for the AUD relative to the JPY. This divergence underpins the strategic bearish bias.
2️⃣ The Confirmation: Technical Alignment
This fundamental view is supported by a clear technical picture. The pair is in a well-defined downtrend and is currently testing a critical support level. This alignment of fundamental and technical factors presents a clear short opportunity, with the entry positioned for a breakdown below this key juncture.
3️⃣ The Catalyst: The RBA Bulletin
The immediate catalyst for this trade is the upcoming RBA Bulletin on July 24, 2025. Any dovish language from the RBA concerning Australia's economic outlook will likely reinforce expectations for a rate cut and accelerate the downward move in AUD/JPY.
The Trade Setup ✅
Here is the recommended trade setup:
📉 Trade: SHORT AUD/JPY
👉 Entry: 96.56200
⛔️ Stop Loss: 96.96386
🎯 Take Profit: 95.49900
🧠 Risk/Reward Ratio: 2.65
This setup offers a compelling risk-reward profile, capitalizing on a clear and powerful macroeconomic theme. The trade is designed to perform should the expected catalyst confirm the underlying bearish fundamentals.
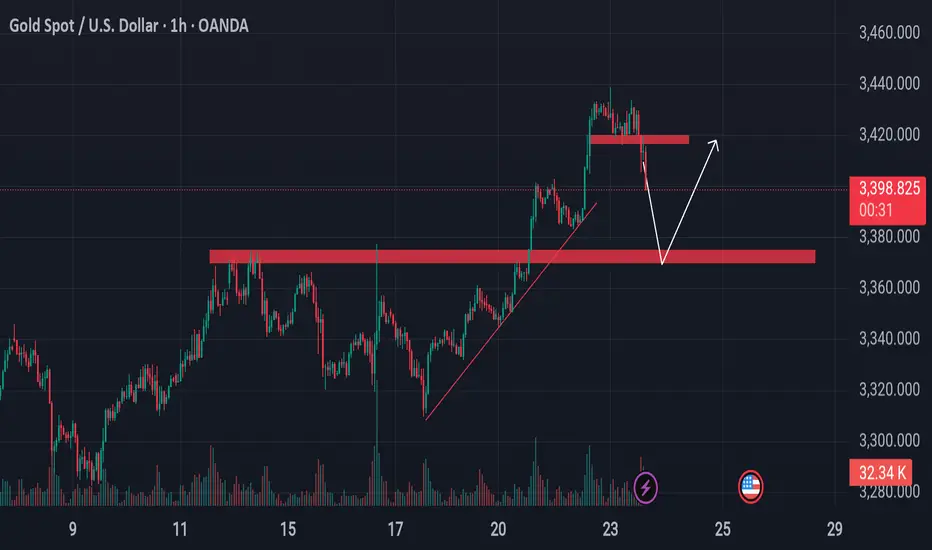
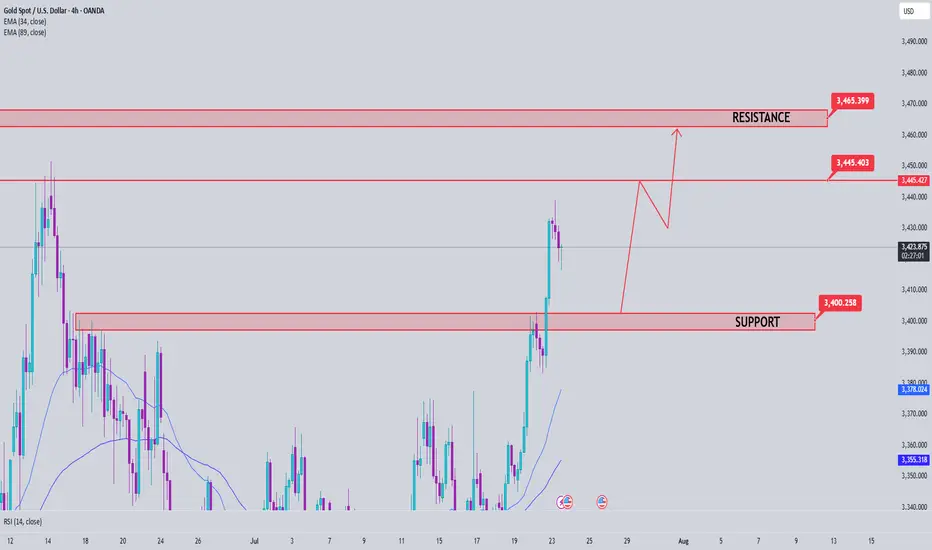
Gold Takes Flight, But Will Support Hold? Watch This Zone!Gold has broken its key resistance level in the New York session and, at the same time, has taken support from the trend line, which is pushing it upward. Currently, however, gold has also broken through another minor support level, and we can now observe that it is pulling back and moving downward.
It is advisable to remain patient at this stage. Wait for the market to come down to the zone where the previous resistance has now turned into support. If the price reacts positively at that level and shows signs of holding, we could potentially see a good buying opportunity from there.
As always, please conduct your own research (DYOR) before making any trading decisions. This is not financial advice.
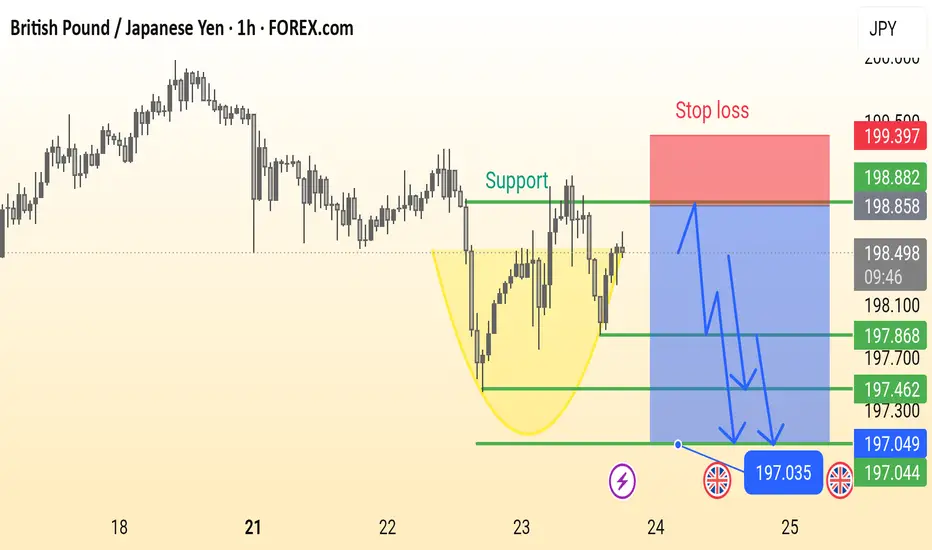
GBP/JPY Analysis is Ready This is a 1-hour chart of the GBP/JPY currency pair showing a potential bearish setup. Key elements include:
Support Zone: Around 198.000, previously tested multiple times.
Bearish Cup Pattern: Highlighted in yellow, suggesting a reversal.
Stop Loss: Marked above 199.397.
Sell Entry Zone: Near the support break at ~198.000.
Bearish Targets: 197.868 → 197.462 → 197.035 (with final support near 197.044).
Bearish Projection Arrows: Indicate expected price movement after breakdown.
This chart suggests a sell setup on breakdown, with well-defined risk and reward levels.
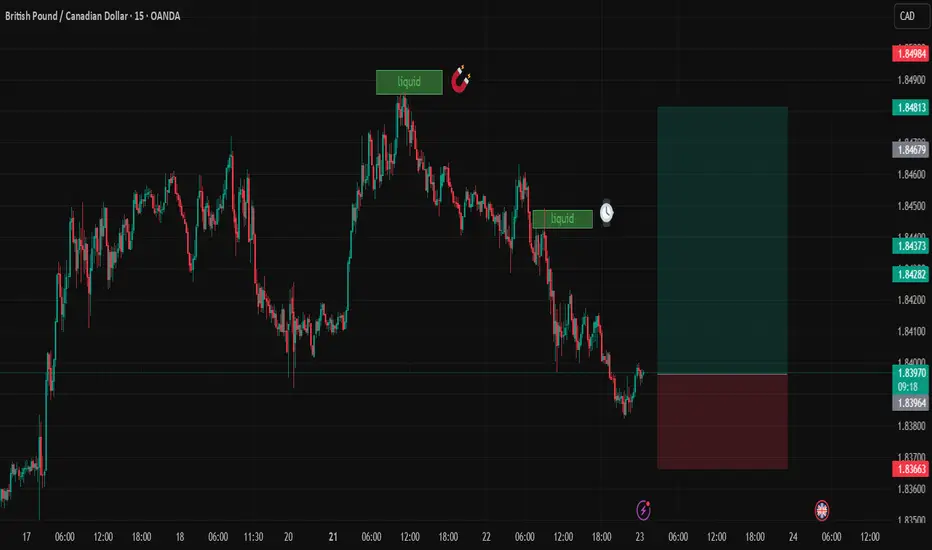
GBPCADDate:
July 23,2025
Session:
Tokyo and London session
Pair:
GBPCAD
Bias:
Long
2 liquidity pools that are waiting to be swept this week. Looks like price is gonna be magnetized towards these levels during London and Tokyo. The trade may even stretch into NYC.
Entry: 1.83970
Stop Loss: 1.83674
Target: 1.84811
RR: 2.82
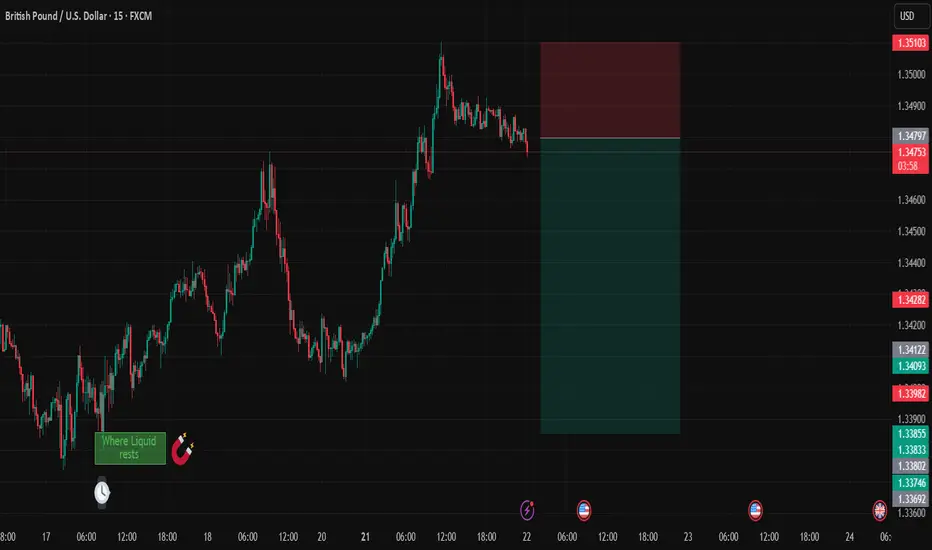
GBPUSDDate:
July 22,2025
Session:
Tokyo and London session
Pair:
GBPUSD
Bias:
Short
Price is setting up to target where liquid rests from last weeks London open on Thursday. Price action shows exhaustion after NYC and London liquidity grab.
Entry:1.34795
Stop Loss:1.35103
Target:1.33853
RR:3.08
Gold Price Analysis July 23📈 Gold Trend Analysis – Strong Uptrend but Signs of Slowdown
Gold continued to set a new peak for the week when closing the day above 3430 – confirming that the uptrend is still dominant. However, buying power is starting to slow down as the market formed a fairly wide range, around 50 prices in today's session.
Profit-taking pressure at high prices can create a short-term correction, opening up two-way trading opportunities for flexible investors.
🔑 Important technical levels (Key Levels):
🔻 Resistance zone & Sell zone:
3445: Price rejection zone – can consider selling if price fails to break through.
3463: Strong Sell zone – expect increased supply here.
🎯 Sell target:
3405: Nearest support, target for short-term sell orders.
🟢 Buy Setup:
3402: Breakout zone in US session – if price breaks strongly through this support with good volume, consider buying on the next uptrend.
USD/JPY Is Ready Move Will Be Fly USD/JPY 30-min chart shows a potential buy setup from the 146.18 support zone, targeting 148.10 with stop loss at 145.82. Price is expected to rise through resistance levels at 147.00 and 147.70.

USDCAD: Long Trading Opportunity
USDCAD
- Classic bullish pattern
- Our team expects retracement
SUGGESTED TRADE:
Swing Trade
Buy USDCAD
Entry - 1.3618
Stop - 1.3586
Take - 1.3685
Our Risk - 1%
Start protection of your profits from lower levels
Disclosure: I am part of Trade Nation's Influencer program and receive a monthly fee for using their TradingView charts in my analysis.
❤️ Please, support our work with like & comment! ❤️

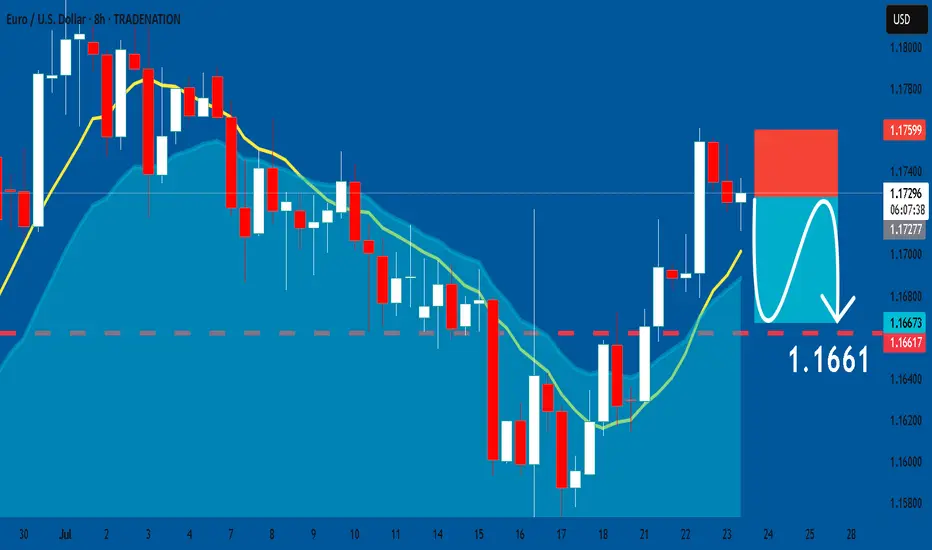
EURUSD: Short Trade Explained
EURUSD
- Classic bearish setup
- Our team expects bearish continuation
SUGGESTED TRADE:
Swing Trade
Short EURUSD
Entry Point - 1.1727
Stop Loss - 1.1759
Take Profit - 1.1661
Our Risk - 1%
Start protection of your profits from lower levels
Disclosure: I am part of Trade Nation's Influencer program and receive a monthly fee for using their TradingView charts in my analysis.
❤️ Please, support our work with like & comment! ❤️
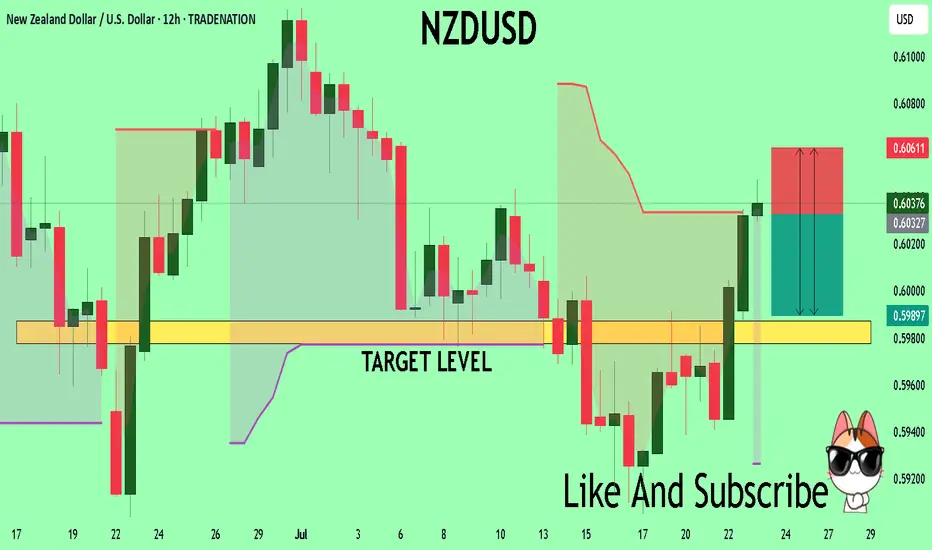
NZDUSD What Next? SELL!
My dear subscribers,
This is my opinion on the NZDUSD next move:
The instrument tests an important psychological level 0.6033
Bias - Bearish
Technical Indicators: Supper Trend gives a precise Bearish signal, while Pivot Point HL predicts price changes and potential reversals in the market.
Target - 0.5987
My Stop Loss - 0.6061
About Used Indicators:
On the subsequent day, trading above the pivot point is thought to indicate ongoing bullish sentiment, while trading below the pivot point indicates bearish sentiment.
Disclosure: I am part of Trade Nation's Influencer program and receive a monthly fee for using their TradingView charts in my analysis.
———————————
WISH YOU ALL LUCK
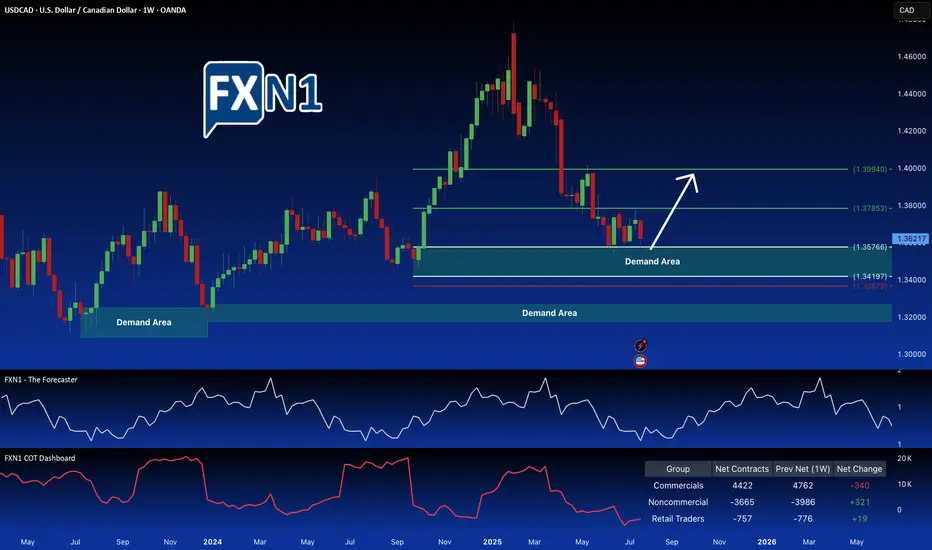
USDCAD Trade Idea: Potential for Further GainsI've initiated a long position on USDCAD at the retest of the key demand zone at 1.35766. Positive indicators support this trade: non-commercial traders are also accumulating long positions, and a notable shift is observed in the CAD futures market, with commercials moving from a bearish to a potentially bullish stance. Furthermore, seasonal trends favor a USD strengthening against the CAD. A further drop in price could present another attractive entry point at a lower demand zone.
✅ Please share your thoughts about USD/CAD in the comments section below and HIT LIKE if you appreciate my analysis. Don't forget to FOLLOW ME; you will help us a lot with this small contribution.
EURNZD: Bulls Will Push Higher
Our strategy, polished by years of trial and error has helped us identify what seems to be a great trading opportunity and we are here to share it with you as the time is ripe for us to buy EURNZD.
Disclosure: I am part of Trade Nation's Influencer program and receive a monthly fee for using their TradingView charts in my analysis.
❤️ Please, support our work with like & comment! ❤️
EURGBP: Will Keep Growing! Here is Why:
The recent price action on the EURGBP pair was keeping me on the fence, however, my bias is slowly but surely changing into the bullish one and I think we will see the price go up.
Disclosure: I am part of Trade Nation's Influencer program and receive a monthly fee for using their TradingView charts in my analysis.
❤️ Please, support our work with like & comment! ❤️

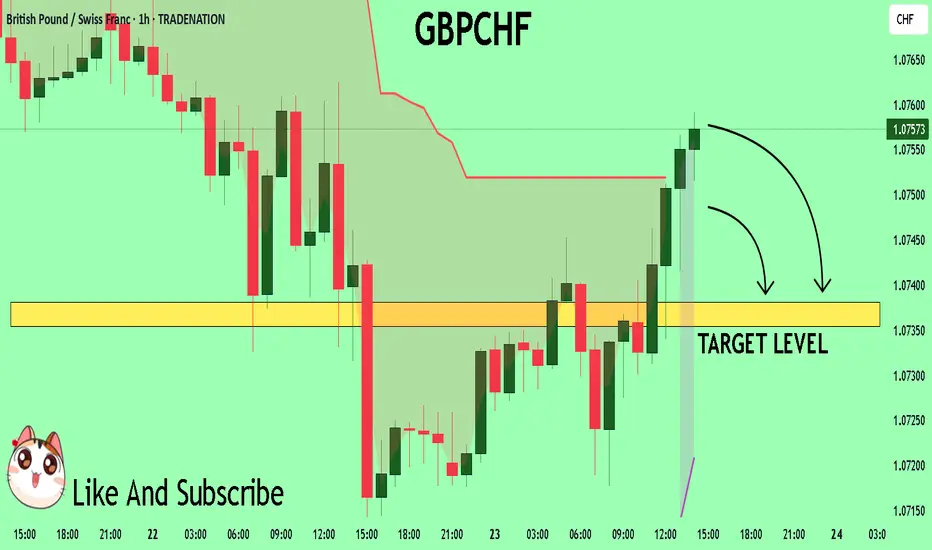
GBPCHF My Opinion! SELL!
My dear followers,
I analysed this chart on GBPCHFand concluded the following:
The market is trading on 1.0756 pivot level.
Bias - Bearish
Technical Indicators: Both Super Trend & Pivot HL indicate a highly probable Bearish continuation.
Target - 1.0738
About Used Indicators:
A super-trend indicator is plotted on either above or below the closing price to signal a buy or sell. The indicator changes color, based on whether or not you should be buying. If the super-trend indicator moves below the closing price, the indicator turns green, and it signals an entry point or points to buy.
Disclosure: I am part of Trade Nation's Influencer program and receive a monthly fee for using their TradingView charts in my analysis.
———————————
WISH YOU ALL LUCK
GOLD The Target Is UP! BUY!
My dear friends,
Please, find my technical outlook for GOLD below:
The price is coiling around a solid key level - 3414.2
Bias - Bullish
Technical Indicators: Pivot Points Low anticipates a potential price reversal.
Super trend shows a clear buy, giving a perfect indicators' convergence.
Goal - 3423.6
Safe Stop Loss - 3409.3
About Used Indicators:
The pivot point itself is simply the average of the high, low and closing prices from the previous trading day.
Disclosure: I am part of Trade Nation's Influencer program and receive a monthly fee for using their TradingView charts in my analysis.
———————————
WISH YOU ALL LUCK
