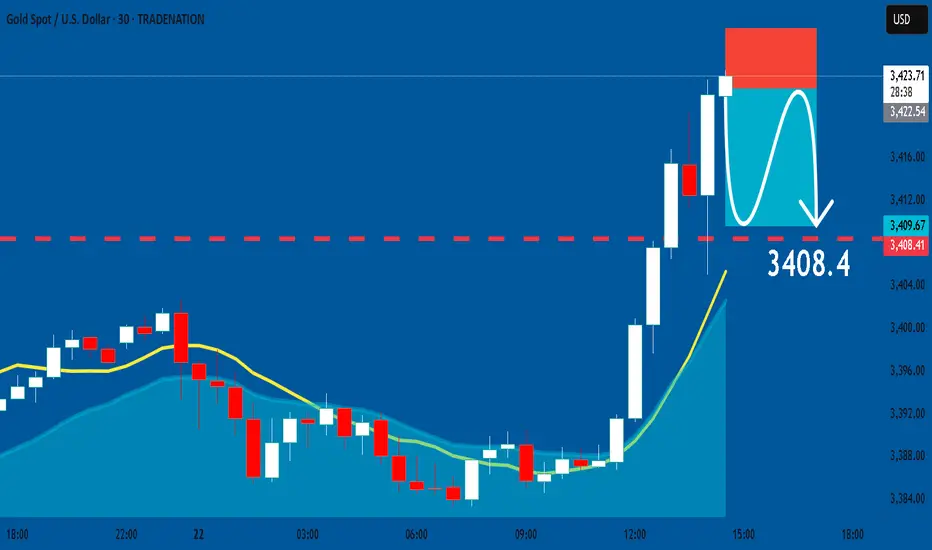
GOLD: Bearish Continuation & Short Trade
GOLD
- Classic bearish formation
- Our team expects fall
SUGGESTED TRADE:
Swing Trade
Sell GOLD
Entry Level -3422.5
Sl - 3428.1
Tp - 3408.4
Our Risk - 1%
Start protection of your profits from lower levels
Disclosure: I am part of Trade Nation's Influencer program and receive a monthly fee for using their TradingView charts in my analysis.
❤️ Please, support our work with like & comment! ❤️
Forex
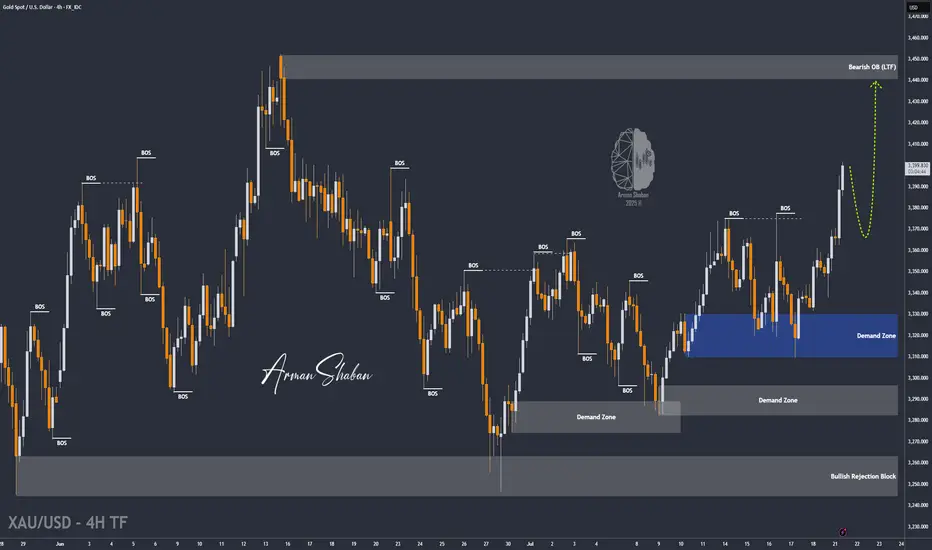
XAU/USD | Get Ready for Another Bullrun, $3500 is Coming!By analyzing the gold chart on the 4-hour timeframe, we can see that on Friday, the price finally closed at $3350. After the market opened today, we saw an initial correction down to $3339 (exactly as expected), followed by another strong bullish wave, pushing gold above $3400 just moments ago. If the price stabilizes below $3398 within the next 4 hours, I expect a potential rejection toward $3388 and $3377. However, if gold holds above $3400, the next target will be $3409. Key demand zones are $3365–$3375, and levels $3355, $3344, and $3336.
Please support me with your likes and comments to motivate me to share more analysis with you and share your opinion about the possible trend of this chart with me !
Best Regards , Arman Shaban
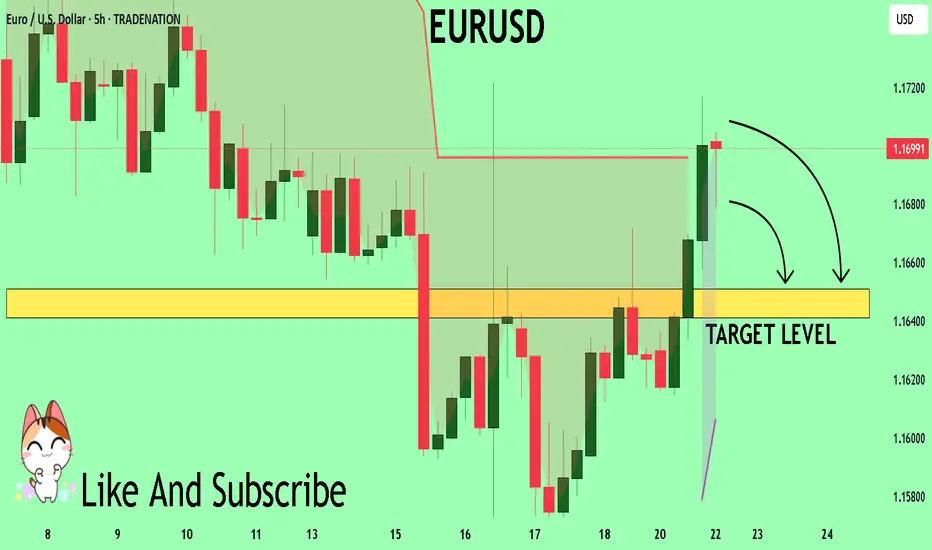
EURUSD Will Collapse! SELL!
My dear subscribers,
This is my opinion on the EURUSD next move:
The instrument tests an important psychological level 1.1696
Bias - Bearish
Technical Indicators: Supper Trend gives a precise Bearish signal, while Pivot Point HL predicts price changes and potential reversals in the market.
Target - 1.1651
About Used Indicators:
On the subsequent day, trading above the pivot point is thought to indicate ongoing bullish sentiment, while trading below the pivot point indicates bearish sentiment.
Disclosure: I am part of Trade Nation's Influencer program and receive a monthly fee for using their TradingView charts in my analysis.
———————————
WISH YOU ALL LUCK
EURGBP The Target Is DOWN! SELL!
My dear friends,
Please, find my technical outlook for EURGBP below:
The price is coiling around a solid key level - 0.8676
Bias - Bearish
Technical Indicators: Pivot Points High anticipates a potential price reversal.
Super trend shows a clear sell, giving a perfect indicators' convergence.
Goal - 0.8670
About Used Indicators:
The pivot point itself is simply the average of the high, low and closing prices from the previous trading day.
Disclosure: I am part of Trade Nation's Influencer program and receive a monthly fee for using their TradingView charts in my analysis.
———————————
WISH YOU ALL LUCK

GBPUSDHello Traders! 👋
What are your thoughts on GBPUSD?
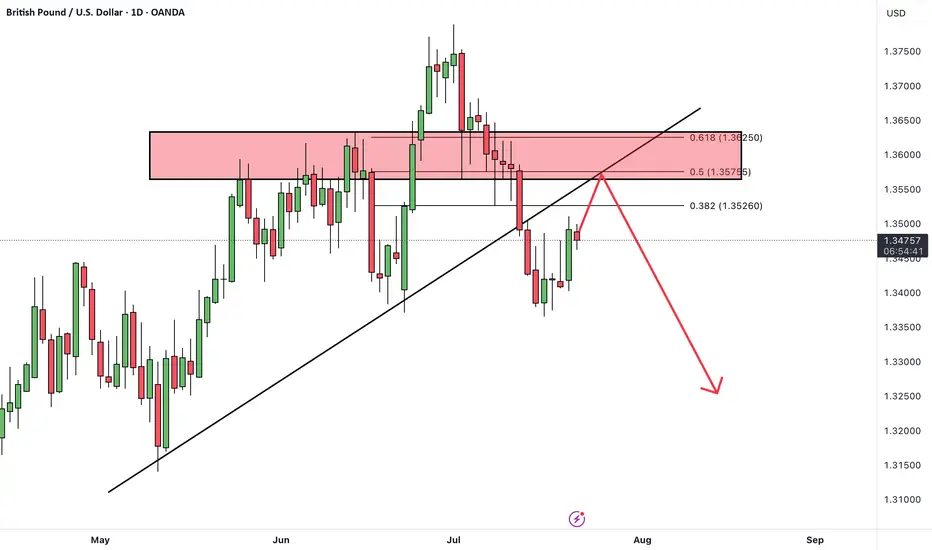
GBP/USD has broken support zone and its ascending trendline, indicating a shift in momentum.
The pair is currently in a pullback phase, retesting the broken support zone, which now acts as resistance.
Once the pullback is complete, we expect further downside toward the next identified support level.
As long as the price remains below the broken zone, the bearish outlook remains valid, and rallies may offer sell opportunities.
Don’t forget to like and share your thoughts in the comments! ❤️
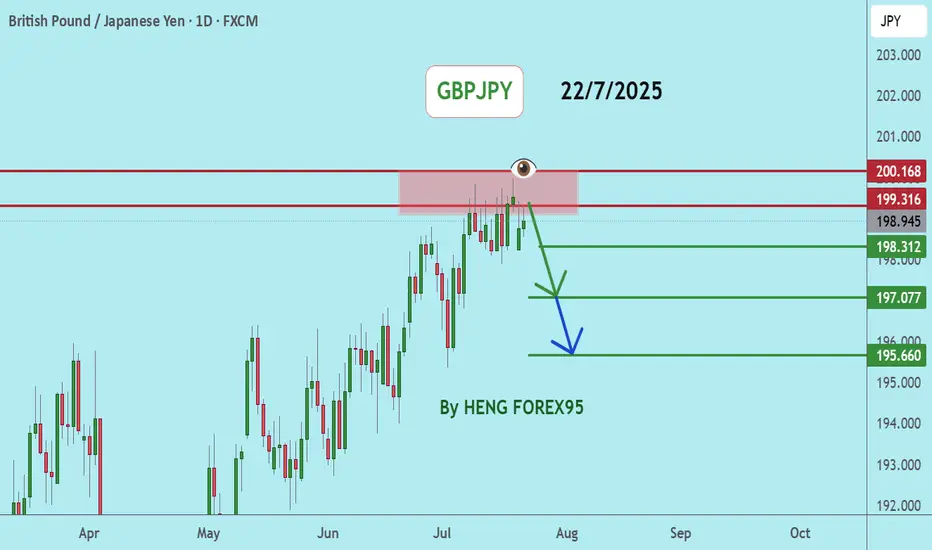
GBPJPYGBPJPY price is near the main resistance zone 200.168. If the price cannot break through the 200.186 level, it is expected that the price will go down. Consider selling the red zone.
🔥Trading futures, forex, CFDs and stocks carries a risk of loss.
Please consider carefully whether such trading is suitable for you.
>>GooD Luck 😊
❤️ Like and subscribe to never miss a new idea!
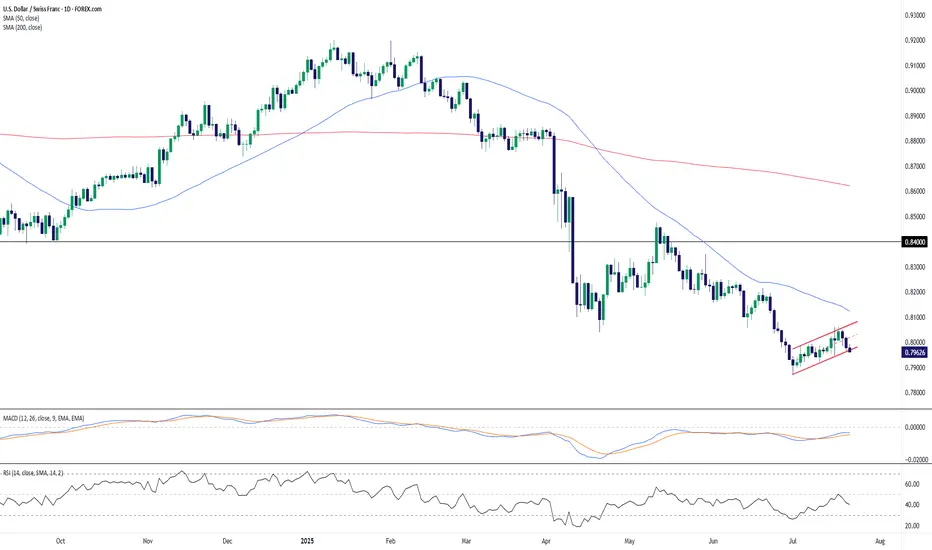
USD/CHF – Bearish Flag Forms Below Resistance, Trend Still DownUSD/CHF remains under pressure after a sustained downtrend and is currently consolidating within a potential bearish flag pattern. Price action has carved out a rising channel after the sharp June selloff, but the structure appears corrective rather than impulsive—suggesting the dominant bearish trend may soon resume.
The pair is struggling to hold the 0.7950–0.8000 zone and trades below both the 50-day (0.8124) and 200-day (0.8621) SMAs, confirming a bearish market structure. Momentum indicators also lean bearish: the MACD is below zero and has begun to curl lower again, while RSI hovers near 40, not yet oversold but lacking bullish momentum.
A breakdown below the flag’s lower boundary would confirm the continuation pattern, exposing 0.7900 initially, with scope toward fresh multi-month lows. On the upside, a close above 0.8100 would challenge the flag’s validity and place the 50-day SMA in focus as resistance.
Bias: Bearish continuation favored unless price breaks and holds above 0.8100. Flag breakdown would reconfirm downside momentum.
Time frame: Short-term (days)
-MW
AUD/USD Channel Breakdown Could Threaten Bullish StructureAUD/USD is currently holding just above the 0.6500 psychological level after retreating from the 0.6558 Fibonacci resistance (61.8% retracement of the October–April decline). Price action has recently broken beneath the lower boundary of a rising wedge pattern—a traditionally bearish signal—raising the risk of deeper downside ahead.
The 50-day SMA (0.6498) and 200-day SMA (0.6399) are converging, with the former now acting as dynamic support following today’s bounce. However, momentum indicators offer limited bullish conviction: the RSI hovers near neutral at 51.5, and the MACD is flatlining just above zero, suggesting a pause in directional bias.
If bears push price back under 0.6500, the rising wedge breakdown could accelerate toward the 200-day SMA and potentially the horizontal support zone at 0.6178. On the flip side, a recovery above 0.6558 would invalidate the wedge and open the door for a run toward the 78.6% retracement near 0.6730.
Bias: Cautiously bearish while below 0.6558, especially if daily closes begin to settle under 0.6500. A loss of the 200-day SMA would confirm a trend reversal.
Time frame: Short- to medium-term (days to weeks)
-MW

USDJPY Correction Complete, Is the Bullish Trend Back in play?After pulling back from the recent high near 149.17, USDJPY has shown signs of strength again, rebounding off the confluence support at the ascending trendline. The bullish narrative is supported by a hawkish FOMC tone and news that a U.S. federal court temporarily blocked Trump-era tariffs. The pair now awaits upcoming U.S. economic data for further directional clarity.
🔍 Technical Outlook – Structure & Momentum
✅ Primary trend: Bullish
✅ Correction phase: Completed near CP zone and trendline
✅ Key structural areas: FVG Zone, CP Zone, and trendline remain intact
Price has responded positively from the CP Zone + OBS Buy Zone around 147.438, aligning with the uptrend line. As long as this structure holds, buyers may push the market toward the next resistance zones.
🧭 Trade Scenarios
🔸 Bullish Bias (preferred scenario):
As long as price holds above 147.438, we expect continuation toward the FVG zone, with immediate targets at the GAP + OBS Sell Zone (148.703) and extended potential to the Buy-side Liquidity zone at 149.122.
A clean breakout above 149.122 opens the door to Fibonacci extensions: 149.72 and 150.05.
🔹 Bearish Scenario (if invalidated):
If price breaks below 147.438 and loses the trendline, we may see a deeper drop toward the Liquidity Buy Zone at 146.825, where strong buying interest is expected to re-enter the market.
⚠️ Macro Risk Drivers
Hawkish FOMC minutes continue to support USD strength
Paused trade tariffs reduce political headwinds, improving risk sentiment
Upcoming U.S. economic data could trigger sharp intraday moves → watch closely
📌 Key Price Zones
Liquidity Buy Zone 146.825 Major long re-entry zone
CP + OBS Buy Zone 147.438 Current active support
FVG Zone 148.20 – 148.68 Intraday bullish target
GAP + OBS Sell Zone 148.703 Short-term resistance
Buy-side Liquidity Zone 149.122 Final bullish objective
💬 Structure remains bullish unless the trendline breaks. Stay patient, wait for confirmations at key zones, and follow your plan with disciplined risk management.

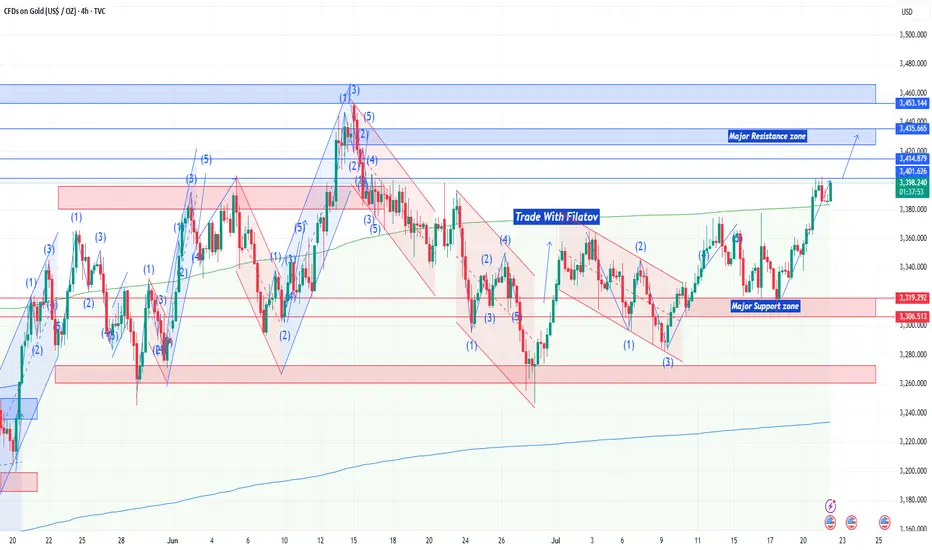
XAUUSD Trade Idea: Golden Cross Signals Bullish MomentumGold (#XAUUSD) is surging after breaking above the 61.8% Fibonacci level, confirming strong bullish momentum!
📊 Key Observations:
Price has bounced off the upper trendline, with an imbalance below, suggesting a possible small correction.
The MA50 has crossed above the MA200, forming a Golden Cross – a highly bullish signal!
🎯 Trade Strategy:
🔼 Consider buying ONLY if price consolidates above 3400 & the nearest fractal.
✅ Target: 3435 (next resistance zone)
⚠️ Watch for pullbacks – the Golden Cross supports upside, but a retest of support could offer a better entry.
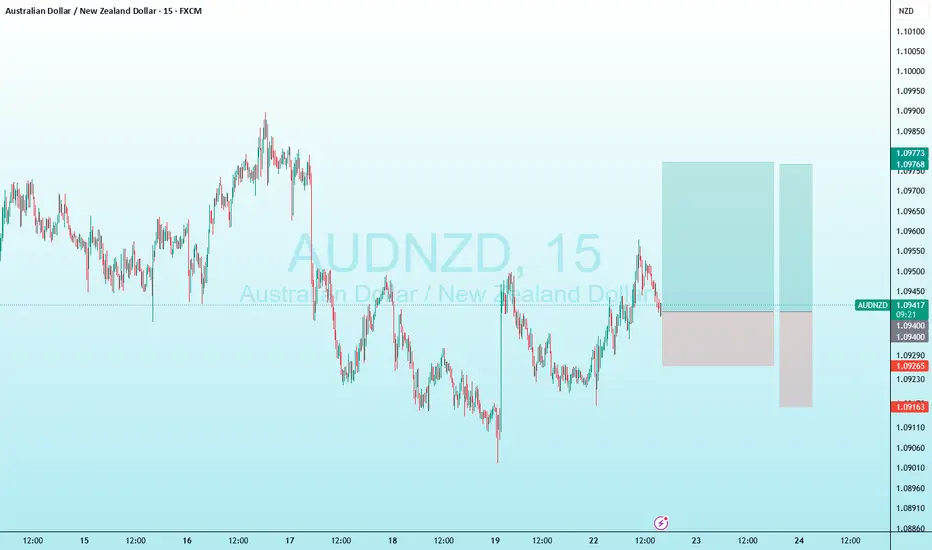
audnzd long trade in my opinion this is a good trade with a good r/r hope hit the tp consider this is my trade not your trade and i just like to share my trades with world
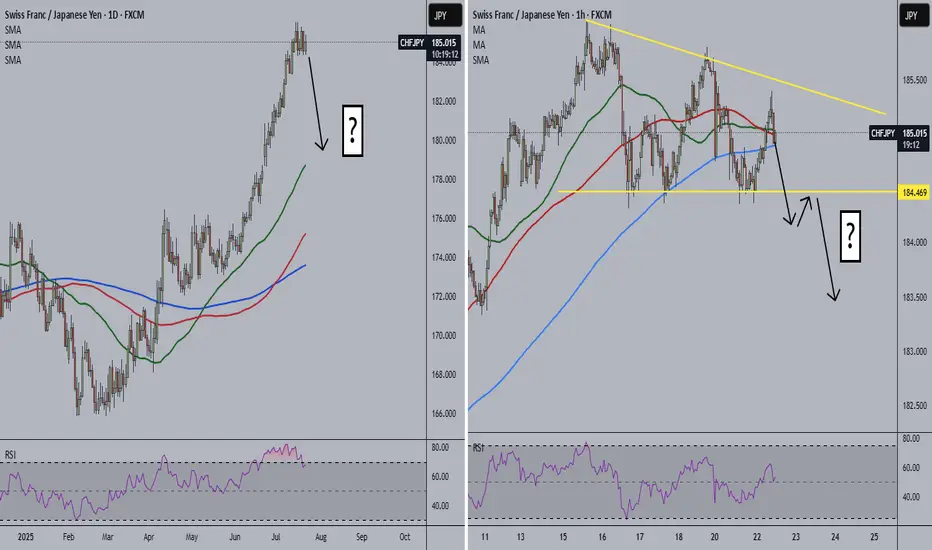
CHFJPY Alert!
🚨 CHFJPY Alert 🚨
Don't catch a falling knife... 🔪 However, price always returns to moving averages, and CHFJPY could be starting its descent.
Personally, I think price may form one last bullish move up and then come crashing down. However, the 1-hour is forming a descending triangle. A break below the triangle could be the start of the daily retracement.
Thoughts?
CMCMARKETS:CHFJPY
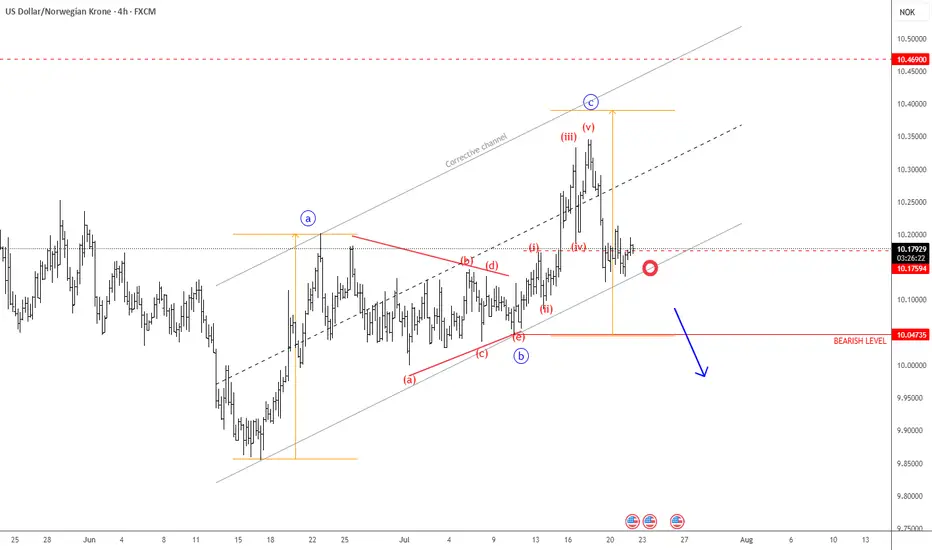
USDNOK Remains BearishUSDNOK made a three-wave rise from the recent low, indicating an abc correction within a downtrend—especially considering the triangle in wave "b" in the middle, and the current sharp decline following a completed five-wave impulse in wave "c". As long as this structure remains intact, there is still a risk of another leg lower. Therefore, we can expect further weakness toward the June lows, especially if it breaks below the channel support line. Just watch out for short-term intraday pullbacks.
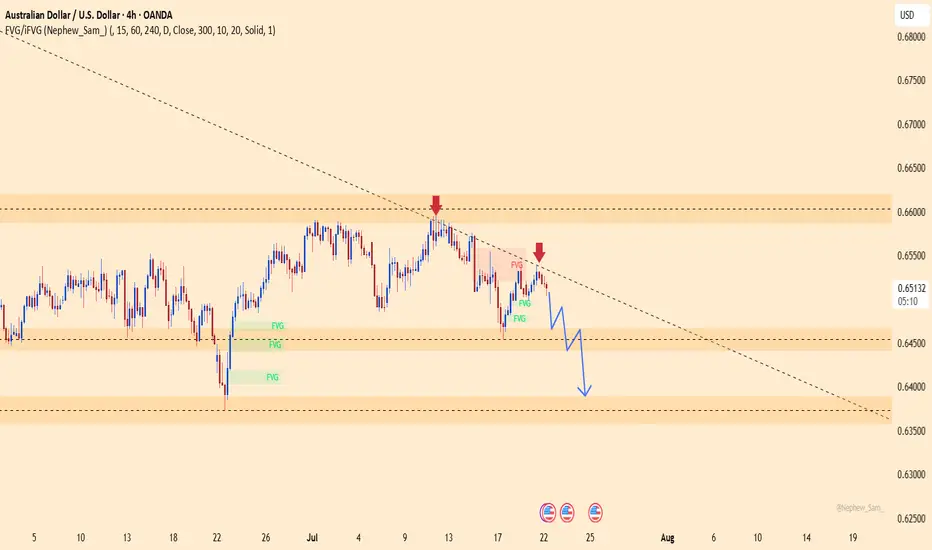
AUDUSD – Sellers taking over, the drop is on!This pair just got slapped hard at the descending trendline, right as it hit a familiar resistance zone. No more doubts – buyers are losing steam, and sellers are waiting to strike.
Market sentiment from Down Under is shaking, with weak economic signals piling up. Meanwhile, the mighty U.S. dollar is reclaiming the spotlight after gold’s flashy surge. The tide has turned!
Unless a miracle shows up, AUDUSD is set to dive deeper – and this is the perfect stage for traders who thrive on strong downtrends.
Sellers are in position – are you ready to join the ride?
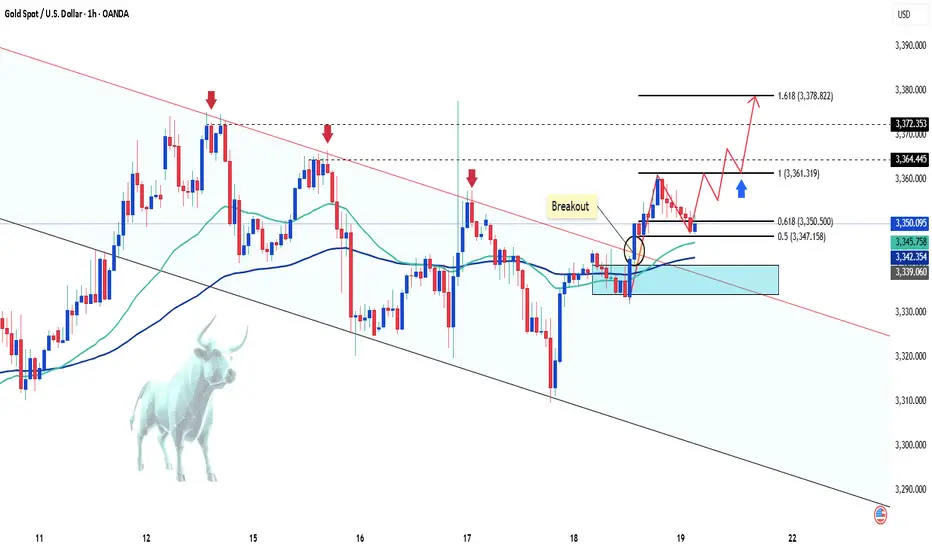
Gold Sees Mild Increase as USD WeakensGold ended Friday's session with a slight increase, regaining the 3350 USD level and recovering over 100 pips by the end of the day.
The weakening of the US Dollar (USD) allowed XAU/USD to rise modestly. Concerns about US President Donald Trump's erratic trade policies and their potential impact on the global economy further supported the precious metal.
In the short term, the technical chart shows gold breaking out of the downward channel and starting an upward wave. The price is currently adjusting at 3350 USD, which coincides with the 0.618 Fibonacci retracement level and the EMA zone, suggesting the potential for further price increases from this level, with targets towards key resistance levels.
Key resistance levels: 3160, 3172, and 3378 USD.
Support zones: 3350, 3340, 3331 USD.
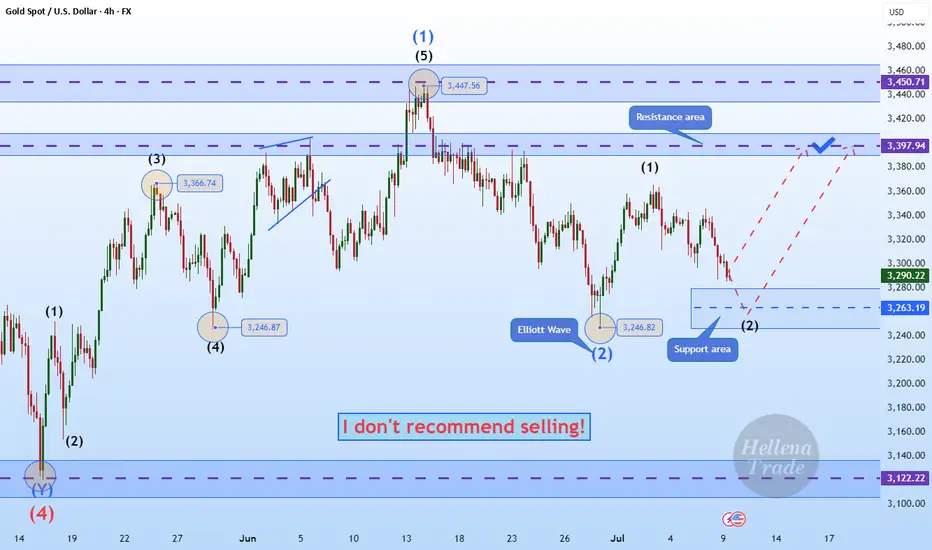
Hellena | GOLD (4H): LONG to resistance area of 3397 (Wave 3).Dear colleagues, my previous forecast remains valid, but I have decided to update it.
At the moment, I still think that wave “3” of the medium order continues its upward movement.
At the moment, I think that the small correction in wave “2” is ending and we will see a continuation of the trend. I see the resistance area of 3397.94 as the target. The main thing is to overcome the local level of the small wave “1” at 3366.37.
Manage your capital correctly and competently! Only enter trades based on reliable patterns!
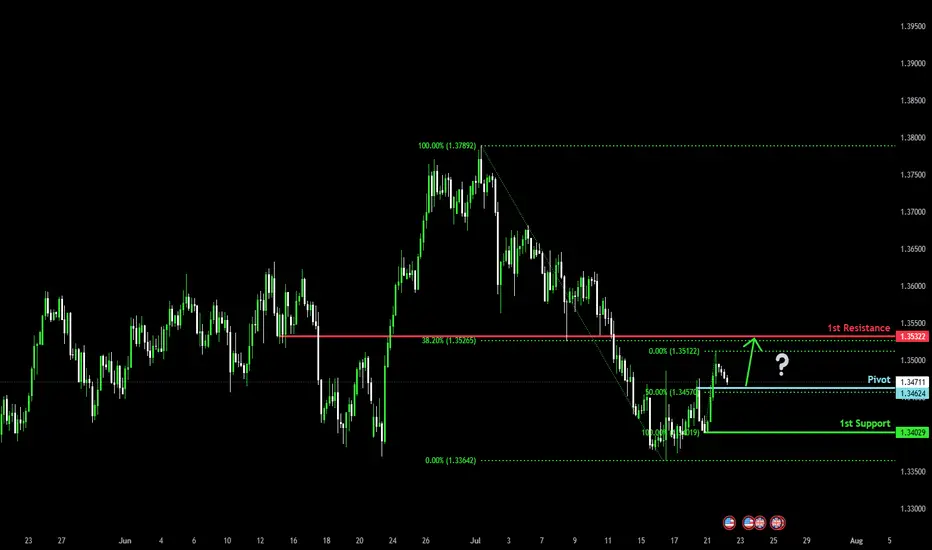
Could the Cable bounce from here?The price is falling towards the pivot, which lines up with the 50% Fibonacci retracement and could bounce to the 1st resistance.
Pivot: 1.3462
1st Support: 1.3402
1st Resistance: 1.3532
Risk Warning:
Trading Forex and CFDs carries a high level of risk to your capital and you should only trade with money you can afford to lose. Trading Forex and CFDs may not be suitable for all investors, so please ensure that you fully understand the risks involved and seek independent advice if necessary.
Disclaimer:
The above opinions given constitute general market commentary, and do not constitute the opinion or advice of IC Markets or any form of personal or investment advice.
Any opinions, news, research, analyses, prices, other information, or links to third-party sites contained on this website are provided on an "as-is" basis, are intended only to be informative, is not an advice nor a recommendation, nor research, or a record of our trading prices, or an offer of, or solicitation for a transaction in any financial instrument and thus should not be treated as such. The information provided does not involve any specific investment objectives, financial situation and needs of any specific person who may receive it. Please be aware, that past performance is not a reliable indicator of future performance and/or results. Past Performance or Forward-looking scenarios based upon the reasonable beliefs of the third-party provider are not a guarantee of future performance. Actual results may differ materially from those anticipated in forward-looking or past performance statements. IC Markets makes no representation or warranty and assumes no liability as to the accuracy or completeness of the information provided, nor any loss arising from any investment based on a recommendation, forecast or any information supplied by any third-party.
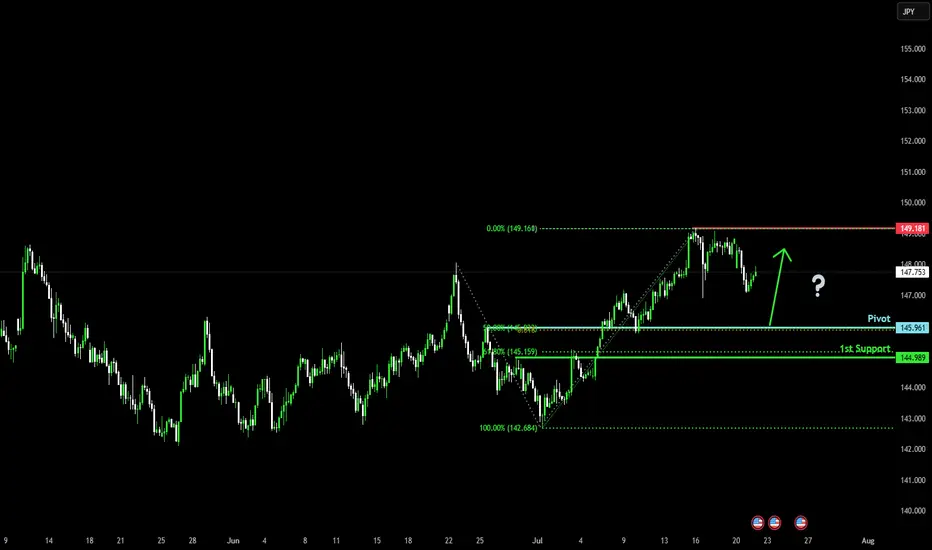
Bullish bounce off major support?USD/JPY is falling towards the pivot, which acts as an overlap support and could bounce to the 1st resistance, which is a swing high resistance.
Pivot: 145.96
1st Support: 144.98
1st Resistance: 149.18
Risk Warning:
Trading Forex and CFDs carries a high level of risk to your capital and you should only trade with money you can afford to lose. Trading Forex and CFDs may not be suitable for all investors, so please ensure that you fully understand the risks involved and seek independent advice if necessary.
Disclaimer:
The above opinions given constitute general market commentary, and do not constitute the opinion or advice of IC Markets or any form of personal or investment advice.
Any opinions, news, research, analyses, prices, other information, or links to third-party sites contained on this website are provided on an "as-is" basis, are intended only to be informative, is not an advice nor a recommendation, nor research, or a record of our trading prices, or an offer of, or solicitation for a transaction in any financial instrument and thus should not be treated as such. The information provided does not involve any specific investment objectives, financial situation and needs of any specific person who may receive it. Please be aware, that past performance is not a reliable indicator of future performance and/or results. Past Performance or Forward-looking scenarios based upon the reasonable beliefs of the third-party provider are not a guarantee of future performance. Actual results may differ materially from those anticipated in forward-looking or past performance statements. IC Markets makes no representation or warranty and assumes no liability as to the accuracy or completeness of the information provided, nor any loss arising from any investment based on a recommendation, forecast or any information supplied by any third-party.
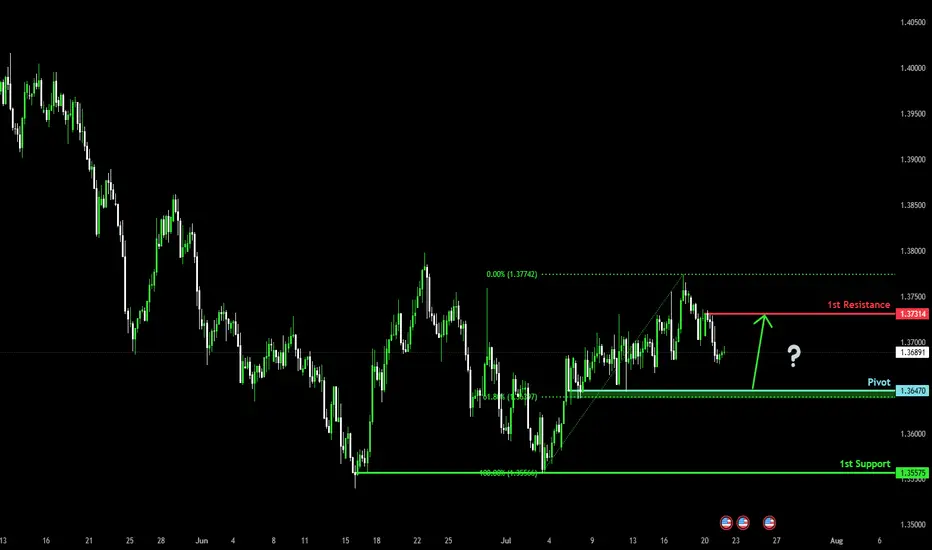
Falling towards pullback support?The Loonie (USD/CAD is falling towards the pivot, which has been identified as a pullback support that aligns with the 61.8% Fibonacci retracement and could bounce to the 1st resistance.
Pivot: 1.3647
1st Support: 1.3557
1st Resistance: 1.3731
Risk Warning:
Trading Forex and CFDs carries a high level of risk to your capital and you should only trade with money you can afford to lose. Trading Forex and CFDs may not be suitable for all investors, so please ensure that you fully understand the risks involved and seek independent advice if necessary.
Disclaimer:
The above opinions given constitute general market commentary, and do not constitute the opinion or advice of IC Markets or any form of personal or investment advice.
Any opinions, news, research, analyses, prices, other information, or links to third-party sites contained on this website are provided on an "as-is" basis, are intended only to be informative, is not an advice nor a recommendation, nor research, or a record of our trading prices, or an offer of, or solicitation for a transaction in any financial instrument and thus should not be treated as such. The information provided does not involve any specific investment objectives, financial situation and needs of any specific person who may receive it. Please be aware, that past performance is not a reliable indicator of future performance and/or results. Past Performance or Forward-looking scenarios based upon the reasonable beliefs of the third-party provider are not a guarantee of future performance. Actual results may differ materially from those anticipated in forward-looking or past performance statements. IC Markets makes no representation or warranty and assumes no liability as to the accuracy or completeness of the information provided, nor any loss arising from any investment based on a recommendation, forecast or any information supplied by any third-party.
Bearish reversal off 61.8% Fibonacci resistance?AUD/USD is rising towards the pivot and could reverse to the 1st support, which acts as a pullback support.
Pivot: 0.6543
1st Support: 0.6469
1st Resistance: 0.6590
Risk Warning:
Trading Forex and CFDs carries a high level of risk to your capital and you should only trade with money you can afford to lose. Trading Forex and CFDs may not be suitable for all investors, so please ensure that you fully understand the risks involved and seek independent advice if necessary.
Disclaimer:
The above opinions given constitute general market commentary, and do not constitute the opinion or advice of IC Markets or any form of personal or investment advice.
Any opinions, news, research, analyses, prices, other information, or links to third-party sites contained on this website are provided on an "as-is" basis, are intended only to be informative, is not an advice nor a recommendation, nor research, or a record of our trading prices, or an offer of, or solicitation for a transaction in any financial instrument and thus should not be treated as such. The information provided does not involve any specific investment objectives, financial situation and needs of any specific person who may receive it. Please be aware, that past performance is not a reliable indicator of future performance and/or results. Past Performance or Forward-looking scenarios based upon the reasonable beliefs of the third-party provider are not a guarantee of future performance. Actual results may differ materially from those anticipated in forward-looking or past performance statements. IC Markets makes no representation or warranty and assumes no liability as to the accuracy or completeness of the information provided, nor any loss arising from any investment based on a recommendation, forecast or any information supplied by any third-party.

Bearish reversal?The Kiwi (NZD/USD) has rejected off the pivot, which is a pullback resistance, and could drop to the 1st support, which is also a pullback support.
Pivot: 0.5979
1st Support: 0.5918
1st Resistance: 0.6040
Risk Warning:
Trading Forex and CFDs carries a high level of risk to your capital and you should only trade with money you can afford to lose. Trading Forex and CFDs may not be suitable for all investors, so please ensure that you fully understand the risks involved and seek independent advice if necessary.
Disclaimer:
The above opinions given constitute general market commentary, and do not constitute the opinion or advice of IC Markets or any form of personal or investment advice.
Any opinions, news, research, analyses, prices, other information, or links to third-party sites contained on this website are provided on an "as-is" basis, are intended only to be informative, is not an advice nor a recommendation, nor research, or a record of our trading prices, or an offer of, or solicitation for a transaction in any financial instrument and thus should not be treated as such. The information provided does not involve any specific investment objectives, financial situation and needs of any specific person who may receive it. Please be aware, that past performance is not a reliable indicator of future performance and/or results. Past Performance or Forward-looking scenarios based upon the reasonable beliefs of the third-party provider are not a guarantee of future performance. Actual results may differ materially from those anticipated in forward-looking or past performance statements. IC Markets makes no representation or warranty and assumes no liability as to the accuracy or completeness of the information provided, nor any loss arising from any investment based on a recommendation, forecast or any information supplied by any third-party.

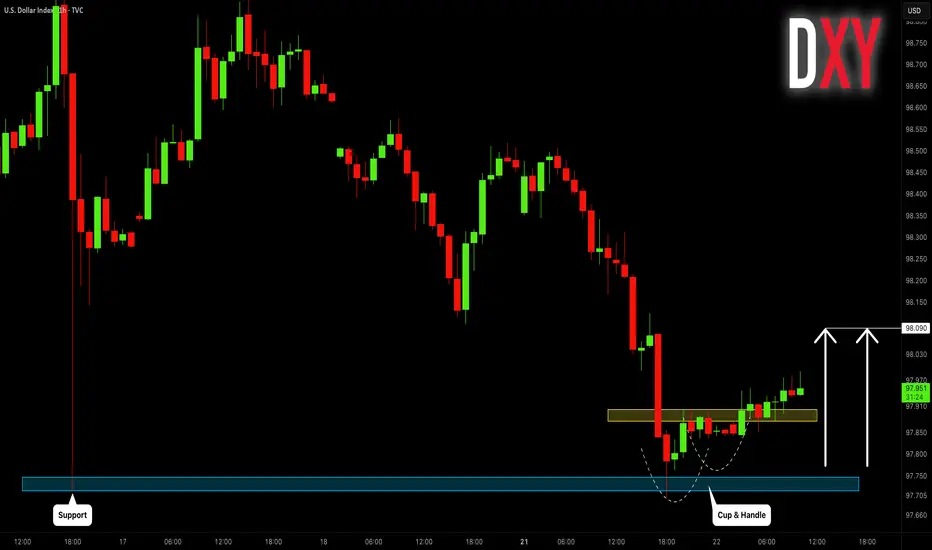
Dollar Index (DXY): Time to Recover
It looks like Dollar Index is going to recover after a yesterday's
rapid fall.
The market reached a key support and formed a cup & handle pattern on that.
We can expect a pullback at least to 98.09 level.
❤️Please, support my work with like, thank you!❤️
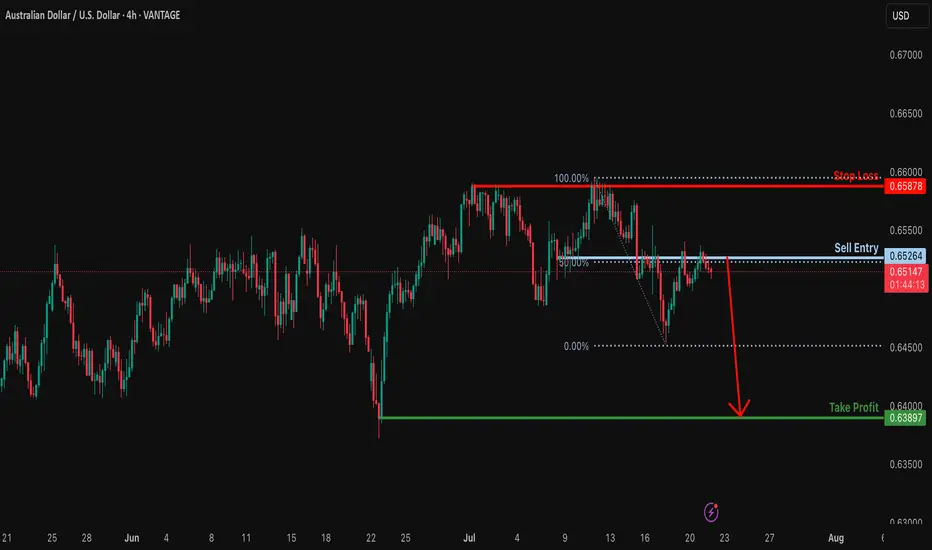
Could the Aussie drop from here?The price is reacting off the resistance level which is a pullback resistance that aligns with the 50% Fibonacci retracement and could drop from this level to our take profit.
Entry: 0.6526
Why we like it:
There is a pullback resistance that lines up with the 50% Fibonacci retracement.
Stop loss: 0.6587
Why we like it:
There is a multi swing high resistance.
Take profit: 0.6389
Why we like it:
There is a pullback support.
Enjoying your TradingView experience? Review us!
Please be advised that the information presented on TradingView is provided to Vantage (‘Vantage Global Limited’, ‘we’) by a third-party provider (‘Everest Fortune Group’). Please be reminded that you are solely responsible for the trading decisions on your account. There is a very high degree of risk involved in trading. Any information and/or content is intended entirely for research, educational and informational purposes only and does not constitute investment or consultation advice or investment strategy. The information is not tailored to the investment needs of any specific person and therefore does not involve a consideration of any of the investment objectives, financial situation or needs of any viewer that may receive it. Kindly also note that past performance is not a reliable indicator of future results. Actual results may differ materially from those anticipated in forward-looking or past performance statements. We assume no liability as to the accuracy or completeness of any of the information and/or content provided herein and the Company cannot be held responsible for any omission, mistake nor for any loss or damage including without limitation to any loss of profit which may arise from reliance on any information supplied by Everest Fortune Group.