Gold rallies to 4-week high as dollar and yields tumbleHello traders, what are your thoughts on gold today?
Gold prices are heating up again in the global market as the US dollar weakens and Treasury yields drop. At the time of writing, gold has surged by 50 dollars, reaching 3,390 USD per ounce — its highest level in four weeks.
The sharp decline in the US dollar is one of the main drivers behind gold’s impressive rally. The USD Index, which had risen significantly last week, lost momentum and fell sharply in overnight trading. Meanwhile, the yield on 10-year US Treasury bonds has dropped to around 4.3%, down from recent highs, increasing gold's appeal as a non-yielding asset.
Market sentiment is also being shaped by broader macroeconomic factors. Crude oil futures have dipped slightly, trading around 67 USD per barrel, reflecting investor caution amid global economic uncertainty. These combined forces have created a favorable environment for gold's strong upward movement.
If the dollar continues to weaken and bond yields remain low, gold could sustain its bullish trend. However, traders should remain alert to potential volatility driven by upcoming US Federal Reserve policy moves and key economic data releases, such as inflation reports and GDP growth figures, which may impact gold's trajectory.
Forex

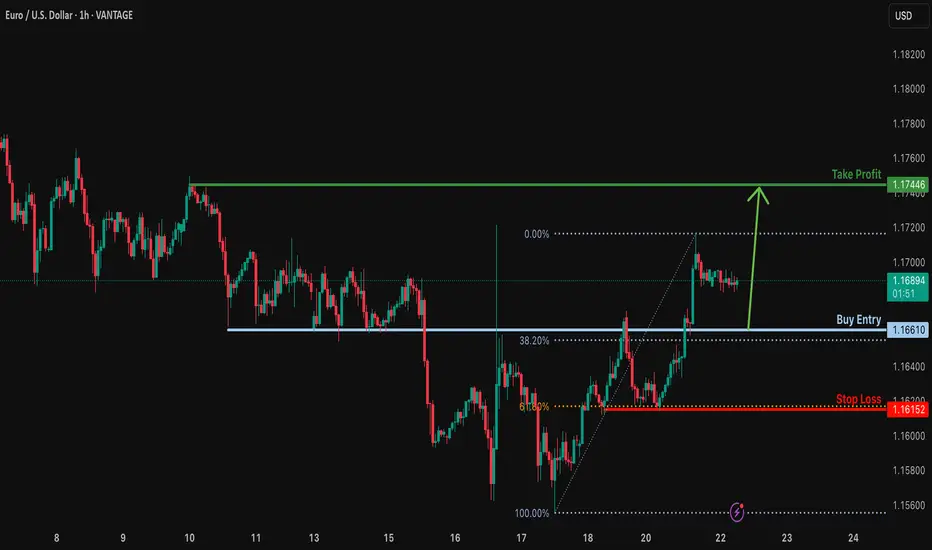
Bullish bounce off overlap support?EUR/USD is falling towards the support level which is an overlap support that aligns with the 38.2% Fibonacci retracement and could bounce from this level to our take profit.
Entry: 1.1661
Why we like it:
There is an overlap support that lines up with the 38.2% Fibonacci retracement.
Stop loss: 1.1615
Why we like it:
There is a pullback support that aligns with the 61.8% Fibonacci retracement.
Take profit: 1.1744
Why we like it:
There is a pullback resistance.
Enjoying your TradingView experience? Review us!
Please be advised that the information presented on TradingView is provided to Vantage (‘Vantage Global Limited’, ‘we’) by a third-party provider (‘Everest Fortune Group’). Please be reminded that you are solely responsible for the trading decisions on your account. There is a very high degree of risk involved in trading. Any information and/or content is intended entirely for research, educational and informational purposes only and does not constitute investment or consultation advice or investment strategy. The information is not tailored to the investment needs of any specific person and therefore does not involve a consideration of any of the investment objectives, financial situation or needs of any viewer that may receive it. Kindly also note that past performance is not a reliable indicator of future results. Actual results may differ materially from those anticipated in forward-looking or past performance statements. We assume no liability as to the accuracy or completeness of any of the information and/or content provided herein and the Company cannot be held responsible for any omission, mistake nor for any loss or damage including without limitation to any loss of profit which may arise from reliance on any information supplied by Everest Fortune Group.
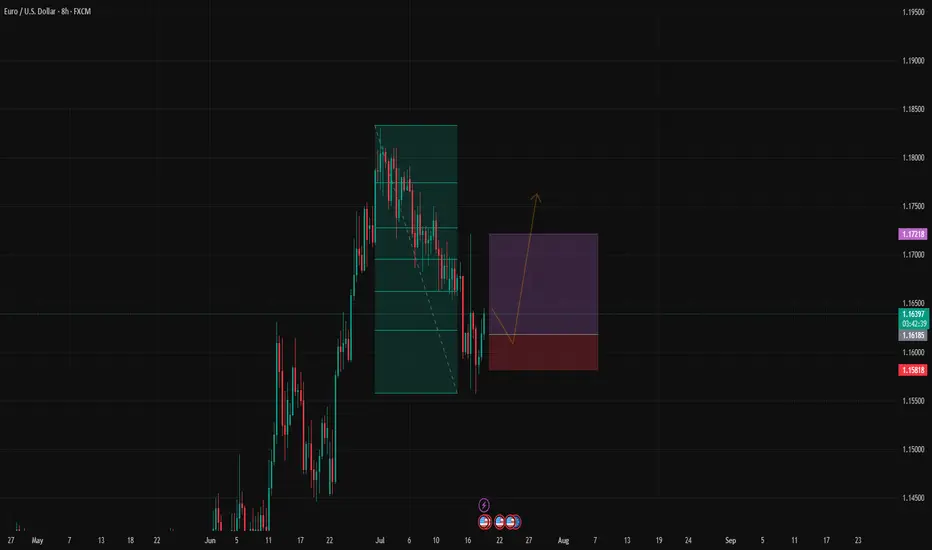
#012: LONG Investment Opportunity on EUR/USD
In this scenario, I placed a passive long order on EUR/USD at a key zone that has shown signs of accumulation and institutional defense in recent days.
The price showed bearish manipulation followed by a sharp rebound with a V-shaped pattern, often indicative of stop-loss hunting. In these phases, a direct entry is less effective than a passive strategy aimed at intercepting a possible technical pullback in the zone where abnormal volumes and algorithmic defenses have manifested.
The order was designed to be activated only if the market were to temporarily return to the previously absorbed zone, thus avoiding chasing the price after a directional candlestick.
The stop-loss placement was carefully chosen to avoid both typical retail hunting zones and areas visible to algorithms. It is positioned to ensure operational invisibility, but also consistency with the logic of institutional defense: if reached, the trade will be automatically invalidated.
The target is aligned with the superior technical structure and the normal range of movement that develops when this dynamic is respected.
This operation is designed to be left to operate completely autonomously, without the need for adjustments or active management. Either in or out. The sole objective is to align with institutional flows, with controlled risk and a favorable management structure.
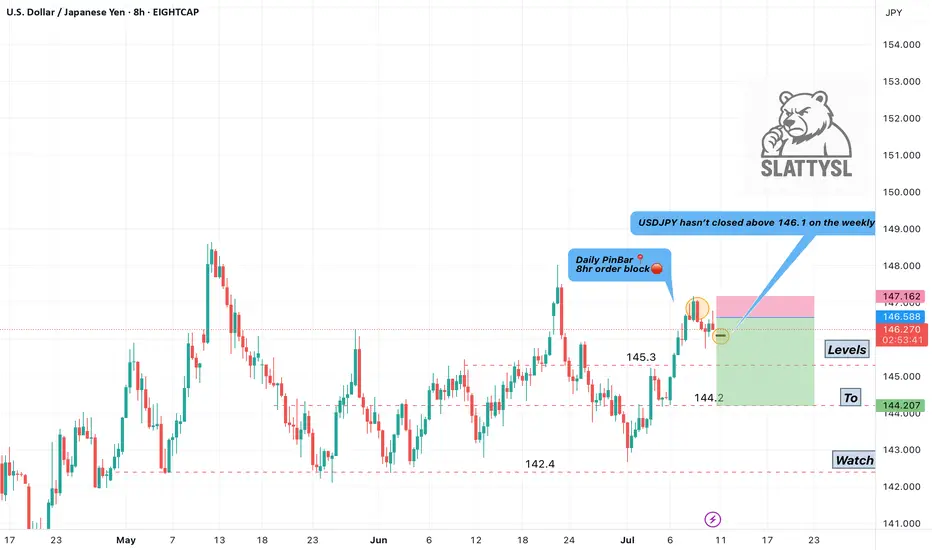
USD/JPY Possible Bear Scenario🔍 Analysis Summary:
USDJPY has failed to close above 146.1 on the weekly for the past 13 candles, showing clear signs of price exhaustion at this level. Price has also tapped into a marked 8HR bearish order block and printed a Daily Pin Bar — a strong reversal signal indicating potential downside.
📍Key Technicals:
• Resistance Holding: 146.1–146.6 zone
• Bearish Rejection: Pin Bar off resistance + order block
• Risk Area (Stop Zone): Above 147.16
• Target Zones: 144.2 (interim) → 142.4 (swing level)
🛠 Confluence:
• Order block rejection
• Multi-week resistance
• Clean structure with defined R:R
• Bearish candlestick confirmation
📊 Timeframe: 8HR
📉 Bias: Short
🔐 Risk Management: Proper stop loss in place above structure. Use personal risk limits.
⸻
⚠️ Disclaimer:
This setup is for educational and informational purposes only. It is not financial advice or a recommendation to trade. Always conduct your own analysis and use risk management based on your personal trading plan.
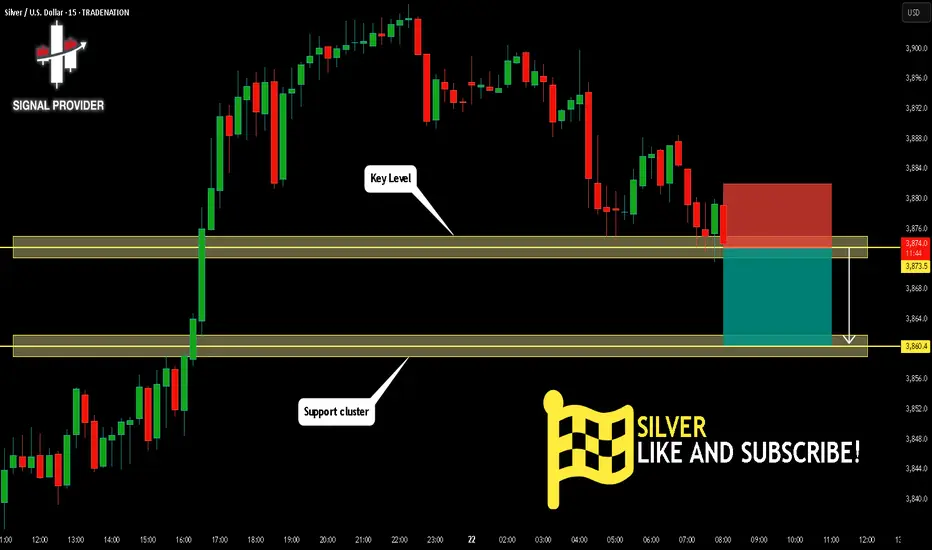
SILVER Is Going Down! Short!
Here is our detailed technical review for SILVER.
Time Frame: 15m
Current Trend: Bearish
Sentiment: Overbought (based on 7-period RSI)
Forecast: Bearish
The market is on a crucial zone of supply 3,873.5.
The above-mentioned technicals clearly indicate the dominance of sellers on the market. I recommend shorting the instrument, aiming at 3,860.4 level.
P.S
We determine oversold/overbought condition with RSI indicator.
When it drops below 30 - the market is considered to be oversold.
When it bounces above 70 - the market is considered to be overbought.
Disclosure: I am part of Trade Nation's Influencer program and receive a monthly fee for using their TradingView charts in my analysis.
Like and subscribe and comment my ideas if you enjoy them!
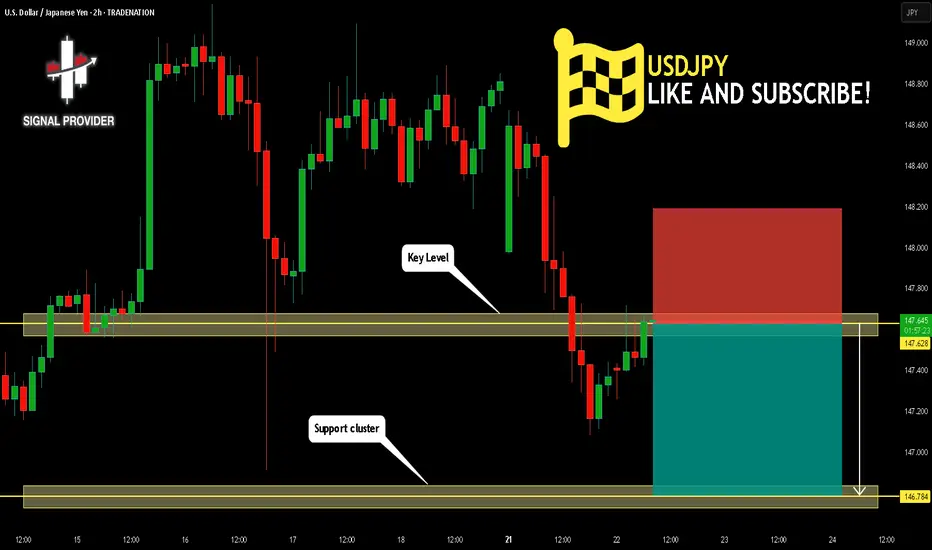
USDJPY Will Fall! Sell!
Take a look at our analysis for USDJPY.
Time Frame: 2h
Current Trend: Bearish
Sentiment: Overbought (based on 7-period RSI)
Forecast: Bearish
The price is testing a key resistance 147.628.
Taking into consideration the current market trend & overbought RSI, chances will be high to see a bearish movement to the downside at least to 146.784 level.
P.S
Overbought describes a period of time where there has been a significant and consistent upward move in price over a period of time without much pullback.
Disclosure: I am part of Trade Nation's Influencer program and receive a monthly fee for using their TradingView charts in my analysis.
Like and subscribe and comment my ideas if you enjoy them!
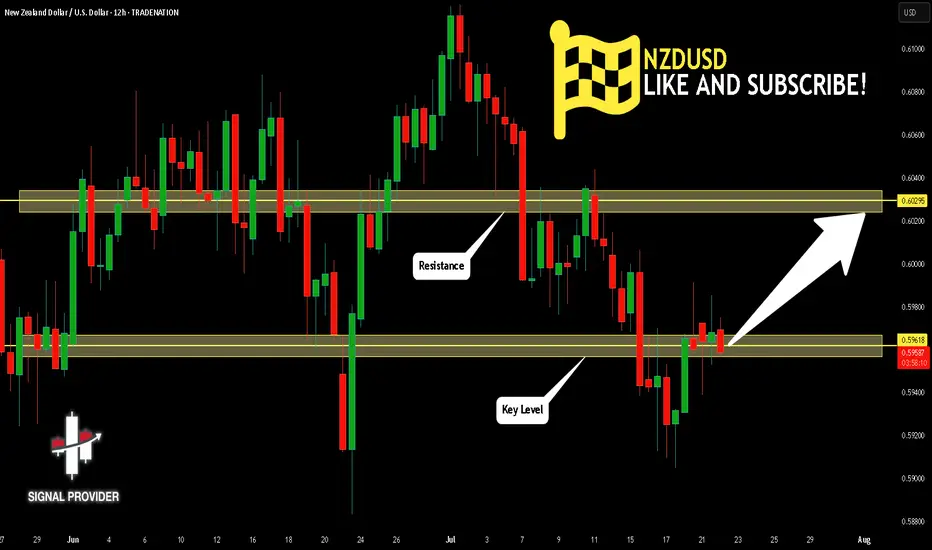
NZDUSD Will Go Higher From Support! Long!
Please, check our technical outlook for NZDUSD.
Time Frame: 12h
Current Trend: Bullish
Sentiment: Oversold (based on 7-period RSI)
Forecast: Bullish
The market is trading around a solid horizontal structure 0.596.
The above observations make me that the market will inevitably achieve 0.602 level.
P.S
Please, note that an oversold/overbought condition can last for a long time, and therefore being oversold/overbought doesn't mean a price rally will come soon, or at all.
Disclosure: I am part of Trade Nation's Influencer program and receive a monthly fee for using their TradingView charts in my analysis.
Like and subscribe and comment my ideas if you enjoy them!
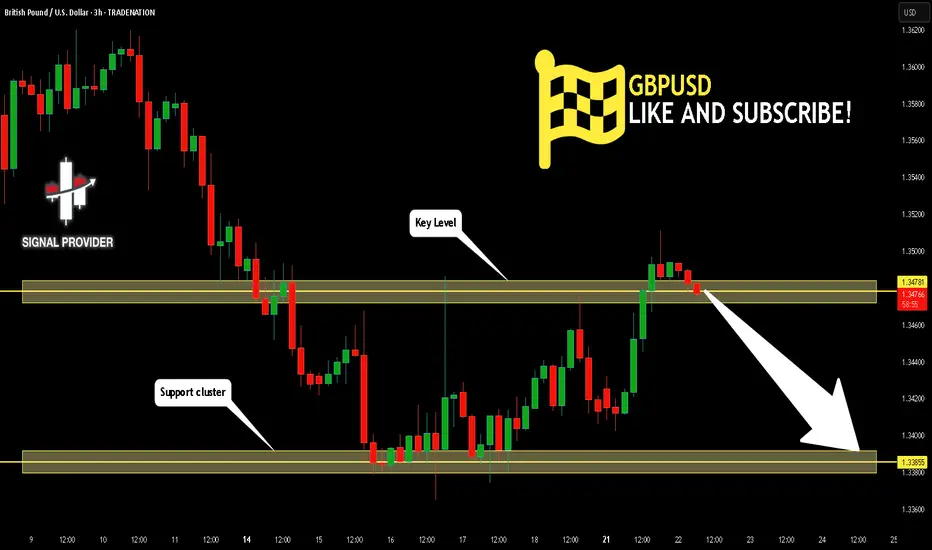
GBPUSD Will Go Down From Resistance! Short!
Here is our detailed technical review for GBPUSD.
Time Frame: 3h
Current Trend: Bearish
Sentiment: Overbought (based on 7-period RSI)
Forecast: Bearish
The market is testing a major horizontal structure 1.347.
Taking into consideration the structure & trend analysis, I believe that the market will reach 1.338 level soon.
P.S
The term oversold refers to a condition where an asset has traded lower in price and has the potential for a price bounce.
Overbought refers to market scenarios where the instrument is traded considerably higher than its fair value. Overvaluation is caused by market sentiments when there is positive news.
Disclosure: I am part of Trade Nation's Influencer program and receive a monthly fee for using their TradingView charts in my analysis.
Like and subscribe and comment my ideas if you enjoy them!
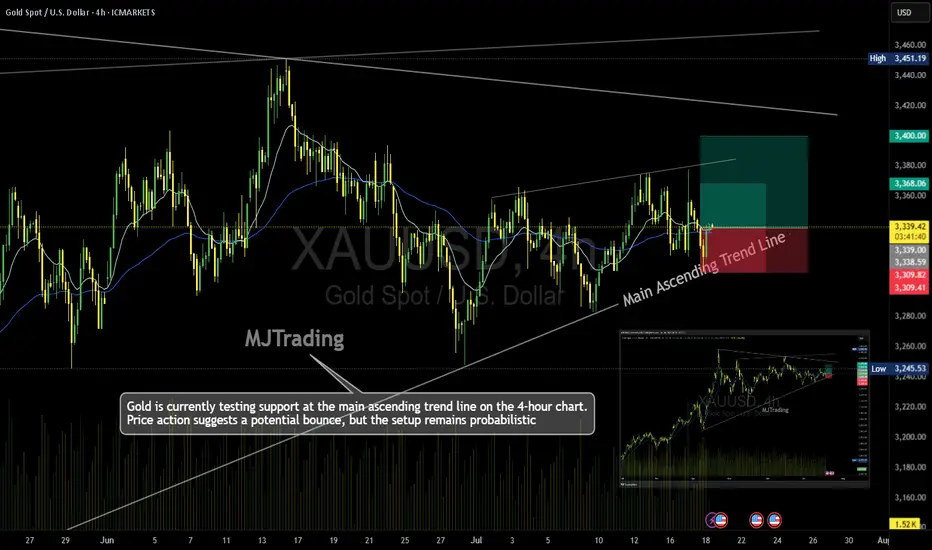
Gold (XAU/USD) – 4H Time Frame Trade Idea📈MJTrading:
Gold is currently testing support at the main ascending trend line on the 4-hour chart. Price action suggests a potential bounce, but the setup remains probabilistic—ideal for traders who operate on higher time frames and manage risk with discipline.
🔹 Trade Setup
Entry: 3340
Stop Loss: 3309
Take Profit 1: 3368
Take Profit 2: 3400
🔍 Technical Context
Price is respecting the long-standing trend line, hinting at bullish continuation.
Risk-reward ratio is favorable, especially for swing traders.
A break below the trend line invalidates the setup—hence the tight SL.
⚠️ Note: While the trend supports upside potential, failure to hold the trend line could trigger deeper retracement. Trade the probabilities, not the certainties.
In case it's not shown properly on your monitor because of different resolutions:
Psychology Always Maters:
#MJTrading #Gold #XAUUSD #Trend #Trendline #Forex #Chart #ChartAnalysis #Buy #Long
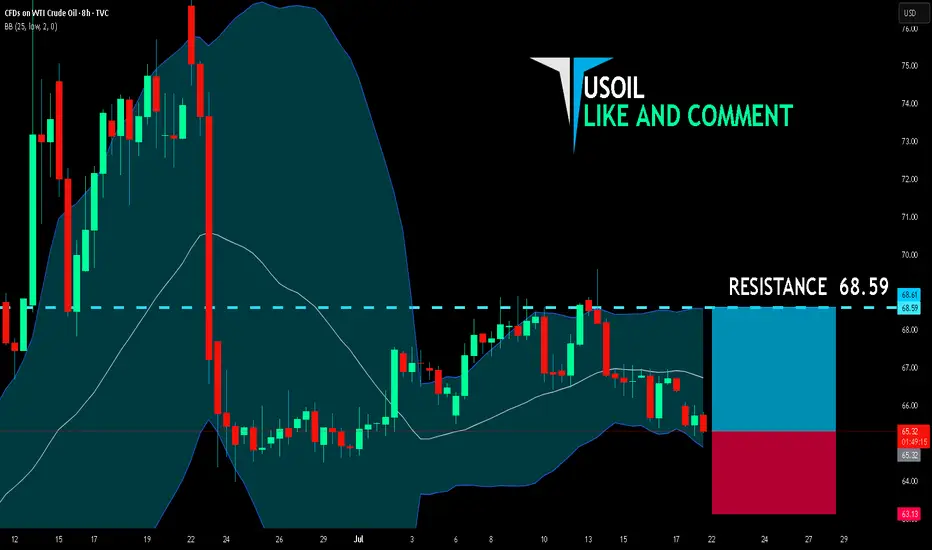
USOIL BULLS ARE STRONG HERE|LONG
USOIL SIGNAL
Trade Direction: long
Entry Level: 65.32
Target Level: 68.59
Stop Loss: 63.13
RISK PROFILE
Risk level: medium
Suggested risk: 1%
Timeframe: 8h
Disclosure: I am part of Trade Nation's Influencer program and receive a monthly fee for using their TradingView charts in my analysis.
✅LIKE AND COMMENT MY IDEAS✅
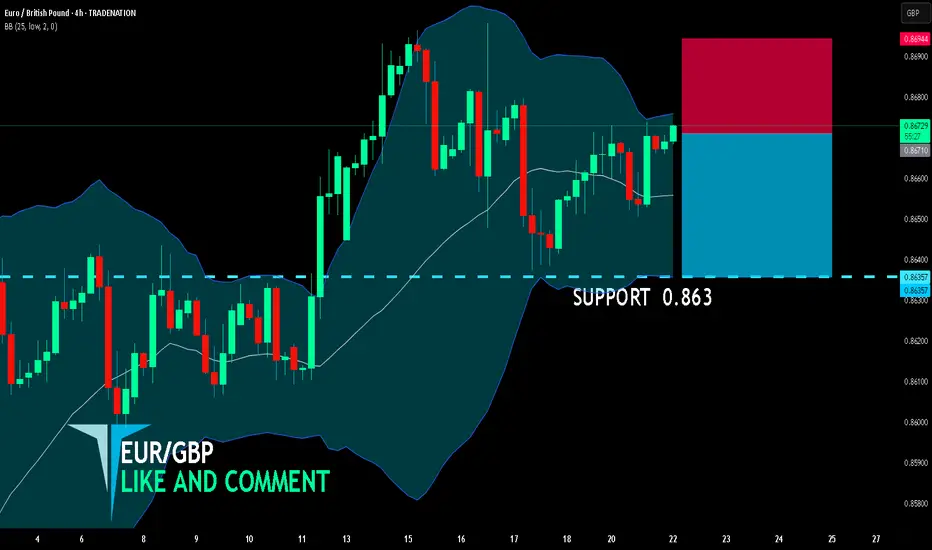
EUR/GBP SHORT FROM RESISTANCE
EUR/GBP SIGNAL
Trade Direction: short
Entry Level: 0.867
Target Level: 0.863
Stop Loss: 0.869
RISK PROFILE
Risk level: medium
Suggested risk: 1%
Timeframe: 4h
Disclosure: I am part of Trade Nation's Influencer program and receive a monthly fee for using their TradingView charts in my analysis.
✅LIKE AND COMMENT MY IDEAS✅
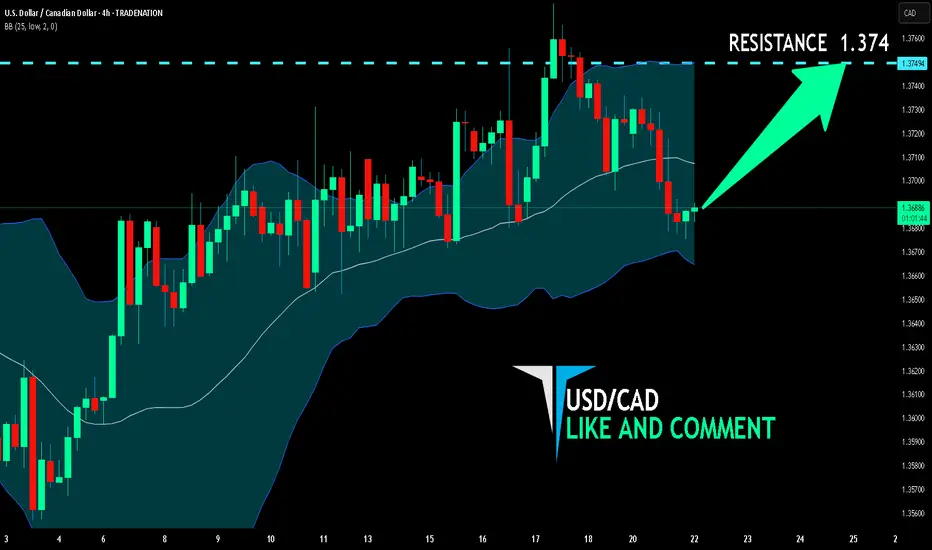
USD/CAD BULLS WILL DOMINATE THE MARKET|LONG
Hello, Friends!
USD/CAD pair is in the uptrend because previous week’s candle is green, while the price is clearly falling on the 4H timeframe. And after the retest of the support line below I believe we will see a move up towards the target above at 1.374 because the pair is oversold due to its proximity to the lower BB band and a bullish correction is likely.
Disclosure: I am part of Trade Nation's Influencer program and receive a monthly fee for using their TradingView charts in my analysis.
✅LIKE AND COMMENT MY IDEAS✅
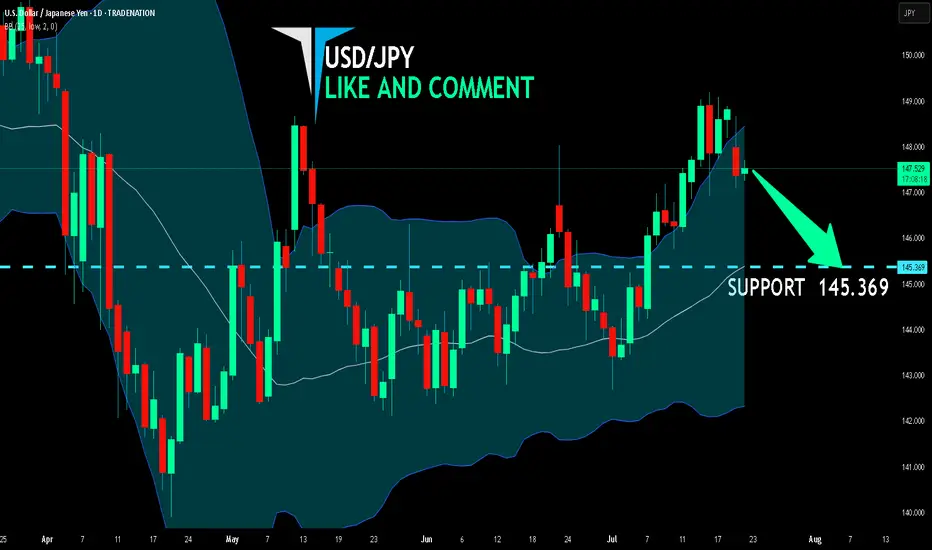
USD/JPY SENDS CLEAR BEARISH SIGNALS|SHORT
Hello, Friends!
USD/JPY pair is trading in a local uptrend which we know by looking at the previous 1W candle which is green. On the 1D timeframe the pair is going up too. The pair is overbought because the price is close to the upper band of the BB indicator. So we are looking to sell the pair with the upper BB line acting as resistance. The next target is 145.369 area.
Disclosure: I am part of Trade Nation's Influencer program and receive a monthly fee for using their TradingView charts in my analysis.
✅LIKE AND COMMENT MY IDEAS✅
EURUSD – Is the rally over? Time for a collapse?The technical picture reveals that EURUSD is losing momentum after a brief rebound. The 1.1700 level stands as a key resistance – if bulls fail to break it, the bears will take the wheel! A clear scenario is forming: lower highs, FVGs filled, and a potential drop toward the 1.1580 support zone this week.
The bad news for the euro isn’t over: yesterday’s Eurozone PMI data disappointed heavily, signaling stagnating growth. Meanwhile, the USD is gaining traction from strong labor data and hawkish Fed remarks, putting EURUSD under double pressure.
If the ascending trendline breaks, EURUSD could plunge even further – get ready for a potential breakdown!
Suggested strategy: Prioritize SELL below 1.1700, with a short-term target at 1.1580.
Stop-loss: Above 1.1720 – a breakout here would invalidate the bearish setup.

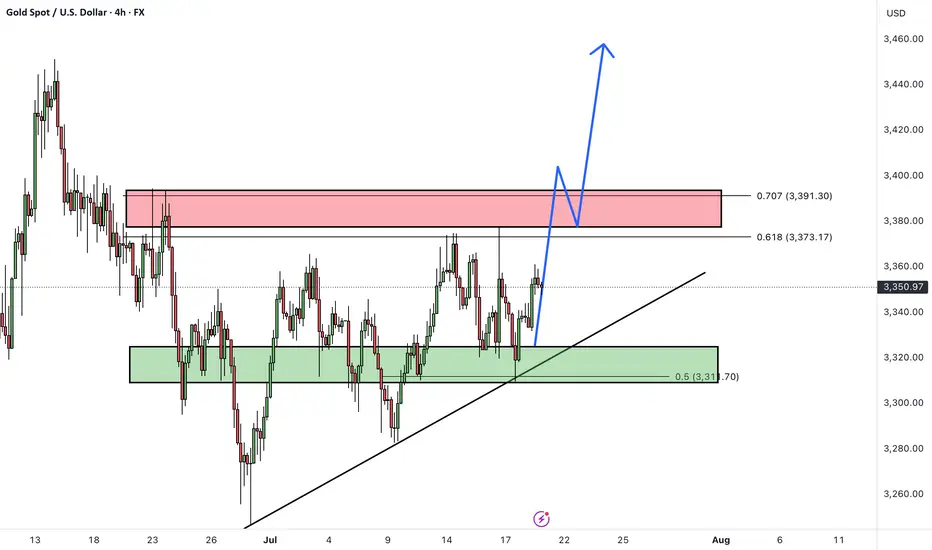
XAUUSDHello Traders! 👋
What are your thoughts on GOLD?
Over the past week, gold has been consolidating within a defined range, fluctuating between two key zones.
A break above the marked resistance zone (around $3380-3390) would confirm the start of the next bullish wave, opening the path toward higher targets.
As long as price remains above the identified support zone, our outlook stays bullish.
Key Levels to Watch:
Resistance: Breakout above $3380 needed to confirm continuation
Support: Holding this zone is essential to maintain the bullish structure
Is gold ready for a breakout after consolidation? Share your thoughts below! 🤔👇
Don’t forget to like and share your thoughts in the comments! ❤️
XAUUSD – Strong bullish structure, buyers in control!Gold is trading within a well-defined ascending channel, with each higher low being consistently respected – indicating strong buying pressure. The recent move broke through a fair value gap (FVG) and is approaching short-term resistance. High-probability scenario: a pullback toward the rising trendline, followed by a strong rebound aiming for the previous highs.
RSI remains in a positive zone, supporting the bullish bias. If the trendline support holds, the next target is the upper resistance area.
Supporting news: The US dollar has stalled after a sharp rally, while persistent inflation concerns and renewed hopes for a mild Fed rate cut are boosting gold’s appeal.

EUR/USD: Bearish Trend in FocusHello everyone, what are your thoughts on EUR/USD?
From my personal analysis, it's clear that EUR/USD is extending its downtrend. The pair is trading around 1.164 and is under pressure from sellers after breaking below both the EMA 34 and EMA 89, with EMA 34 already turning downward — a classic bearish signal.
On the macro side, the European Central Bank is set to announce its monetary policy decision on Thursday. Meanwhile, U.S. President Donald Trump's ongoing trade tensions may add further uncertainty to the market. This corrective downtrend in EUR/USD could very well continue in the weeks ahead.
What do you think — will EUR/USD keep falling?

USD/JPY Drops as Market Awaits Powell's RemarksIn today’s trading session, the USD/JPY pair is showing renewed weakness, currently trading around 147.76 — down more than 0.68% from the previous session. The decline is driven by falling U.S. Treasury yields and cautious investor sentiment ahead of an upcoming speech by Federal Reserve Chair Jerome Powell, which is weighing on the U.S. dollar.
From a technical perspective, USD/JPY has broken its short-term uptrend and is approaching a key support level at 147.60. If this level fails to hold, the bearish momentum could extend further.

Latest Gold Price Update TodayHello everyone, what do you think about the price of gold today?
As the new week begins, gold continues the upward trend started at the end of Friday’s session. As of now, the precious metal is trading around 3356 USD, with the uptrend still being supported.
From a carefully analyzed technical perspective, gold successfully broke out of the downward channel, taking advantage of the weakening USD. The price increase is convincing in the short term, especially after testing and confirming the previous breakout as a new support zone (around 3345 USD).
The upward target is expected to continue, with key levels to watch being 3372 USD and the H4 resistance at 3390 USD.
What do you think about the price of gold today? Feel free to share your thoughts in the comments!
Good luck!

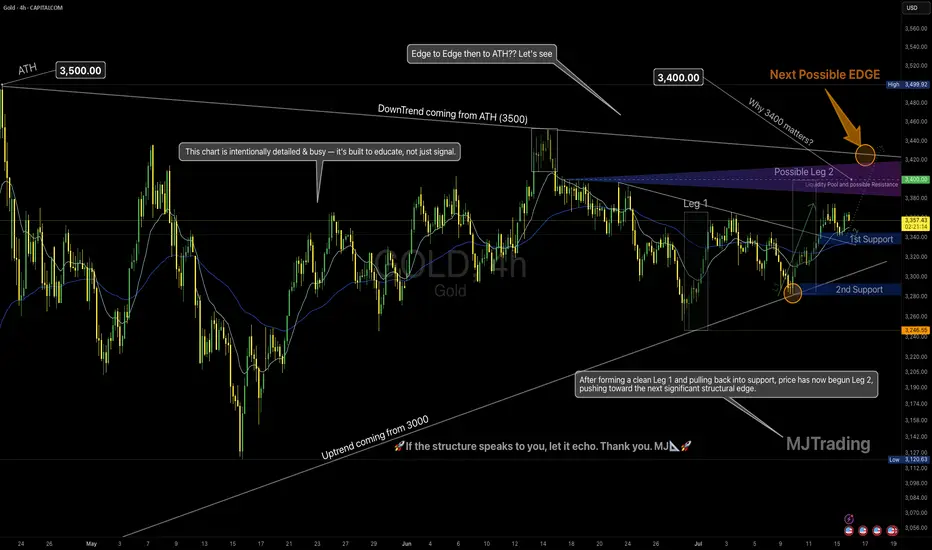
Leg 2 in Progress? | All Eyes on the Possible EDGE around 3400💡 GOLD 4H – MJTrading:
After forming a clean Leg 1 followed by a technical pullback into support, Gold has initiated Leg 2, pushing upward toward the next possible EDGE: 3400.
🟠 Why 3400 Matters
This zone is not just a round number:
It aligns with the long-term downtrend coming from the ATH (3500)
It’s the last reaction high before a deeper correction
There’s likely liquidity resting above — it’s where smart money may make decisions
This is where structure and psychology meet.
And end of 2 possible 2nd leg...
🔄 Possible Scenarios:
🟥 Scenario A – Rejection from the Edge (if could reach):
A reaction from this zone could lead to a pullback toward:
1st Support around 3340-3360
2nd Support near 3250 (also the uptrend line from 3000)
Use these zones to reassess momentum.
🟩 Scenario B – Breakout Above 3400:
A clean break above this structural edge opens the path for:
An “Edge to Edge” move back toward ATH (3500)
Possible higher timeframe trend shift — especially if retest holds
🧠 Our Strategy
We’re long-biased into the edge, not beyond it yet.
Let 3400 show its hand — we stay adaptive, not predictive.
🔍 This chart is intentionally detailed — it's built to educate, not just signal.
Focus on structure, sequence, and behavior — not just levels.
Lets Zoom in around the Breakout area...
And a Zoomout to Daily...
🧭 “If the structure speaks to you, let it echo.”
– MJTrading 🚀
📍#Gold #XAUUSD #TradingView #TechnicalAnalysis #ChartDesigner #MJTrading #MarketStructure #ForexIdeas #Edge
GBPAUD to find buyers at current support?GBPAUD - 24h expiry
The primary trend remains bullish.
Price action looks to be forming a bottom.
We look for a temporary move lower.
Preferred trade is to buy on dips.
Bespoke support is located at 2.0605.
We look to Buy at 2.0605 (stop at 2.0535)
Our profit targets will be 2.0885 and 2.0950
Resistance: 2.0750 / 2.0800 / 2.0970
Support: 2.0600 / 2.0520 / 2.0450
Risk Disclaimer
The trade ideas beyond this page are for informational purposes only and do not constitute investment advice or a solicitation to trade. This information is provided by Signal Centre, a third-party unaffiliated with OANDA, and is intended for general circulation only. OANDA does not guarantee the accuracy of this information and assumes no responsibilities for the information provided by the third party. The information does not take into account the specific investment objectives, financial situation, or particular needs of any particular person. You should take into account your specific investment objectives, financial situation, and particular needs before making a commitment to trade, including seeking advice from an independent financial adviser regarding the suitability of the investment, under a separate engagement, as you deem fit.
You accept that you assume all risks in independently viewing the contents and selecting a chosen strategy.
Where the research is distributed in Singapore to a person who is not an Accredited Investor, Expert Investor or an Institutional Investor, Oanda Asia Pacific Pte Ltd (“OAP“) accepts legal responsibility for the contents of the report to such persons only to the extent required by law. Singapore customers should contact OAP at 6579 8289 for matters arising from, or in connection with, the information/research distributed.

USDJPY
Date:
July 21,2025
Session:
New York Open
Pair:
USDJPY
Bias:
Long
1. Clean liquidity pool left unswept from last week's NYC Open (Thursday).
2. NY session typically retraces or extends from London reversal, giving directional momentum.
Entry:147.544
Stop Loss:147.250
Target:148.794
RR:4.11

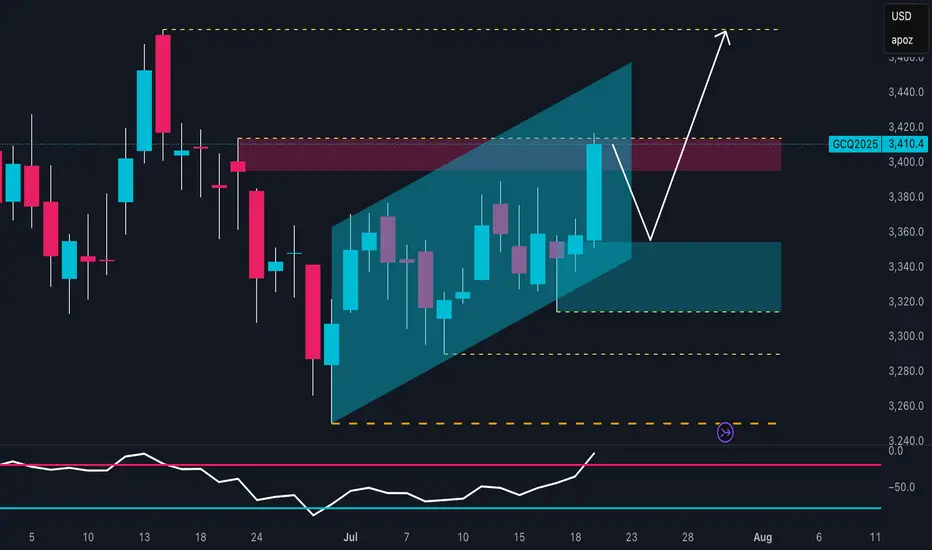
Gold Bulls Reloading? Smart Money Buys!The technical outlook on XAU/USD shows a well-defined bullish trend, developing within an ascending channel that started in late June. Price recently pushed toward the upper boundary of this channel, reaching a key resistance zone between 3,410 and 3,420 USD, which aligns with a previous supply area and significant daily structure. The reaction in this zone suggests a potential fake breakout, hinting at a short-term pullback before a continuation of the upward move.
The RSI oscillator supports this view, displaying bullish momentum with a breakout above the 60 level. However, the current slope hints at a possible minor correction before the next impulsive leg higher. The most relevant demand zone lies between 3,340 and 3,360 USD, at the base of the ascending channel—an ideal spot for buy orders to accumulate in anticipation of a move toward previous highs.
Backing this technical setup, the Commitment of Traders (COT) report as of July 15, 2025, paints a constructive picture. Non-commercial traders (institutional speculators) increased their long positions by over 8,500 contracts, while also cutting short positions by about 1,600 contracts, indicating a strong bullish bias. Commercials also increased their shorts (+16,448), a typical hedge during rallies, but not enough to invalidate the bullish structure.
From a seasonal perspective, July remains one of the historically strongest months for gold. According to MarketBulls data, over the past 2 years, gold has averaged gains of 105+ points in July, with solid returns also visible on the 5-year (+45 pts) and 10-year (+25 pts) averages. August also tends to be supportive, reinforcing the idea of a medium-term bullish extension.
Lastly, the retail sentiment is heavily skewed, with 72% of retail traders short, and only 28% long. From a contrarian standpoint, this is another strong bullish signal. When the majority of retail traders are short in a structurally bullish market, the potential for a short squeeze remains high.