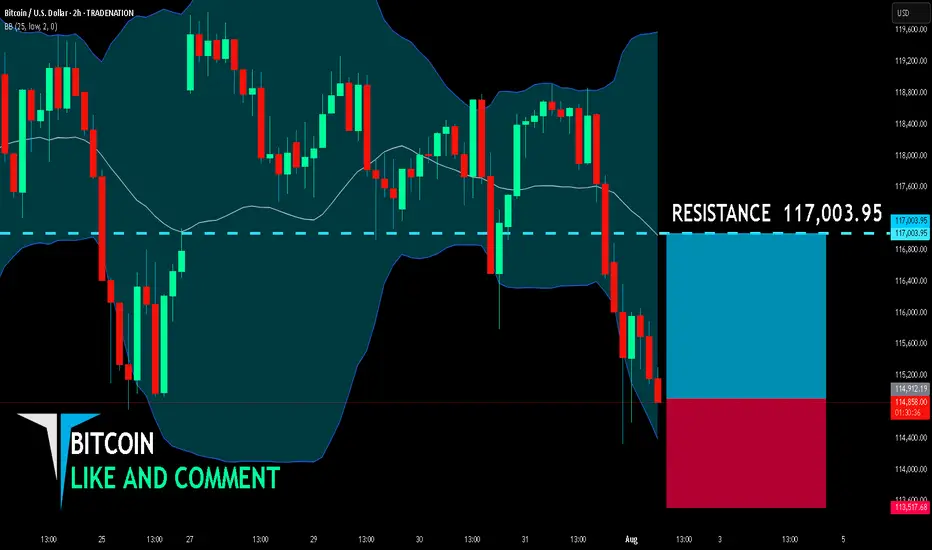
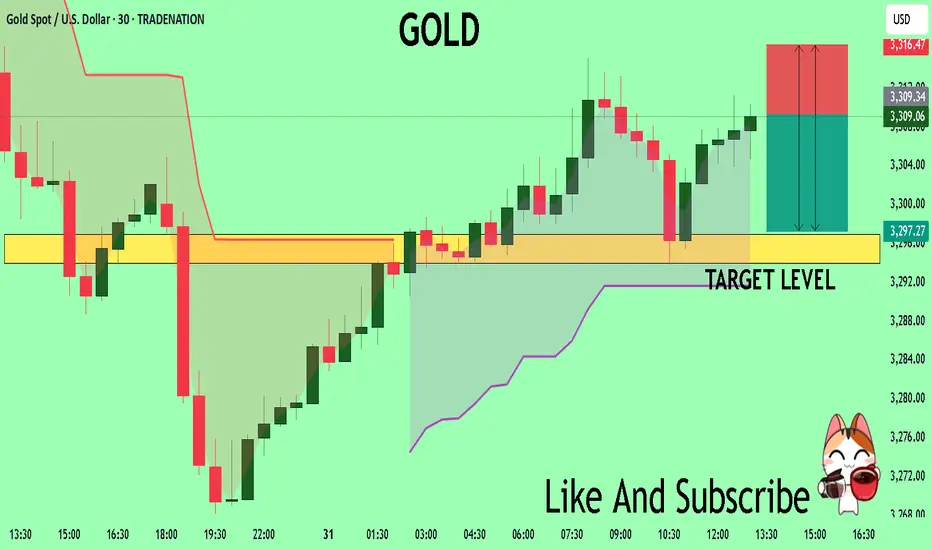
BITCOIN SENDS CLEAR BULLISH SIGNALS|LONG
BITCOIN SIGNAL
Trade Direction: long
Entry Level: 114,912.19
Target Level: 117,003.95
Stop Loss: 113,517.68
RISK PROFILE
Risk level: medium
Suggested risk: 1%
Timeframe: 2h
Disclosure: I am part of Trade Nation's Influencer program and receive a monthly fee for using their TradingView charts in my analysis.
✅LIKE AND COMMENT MY IDEAS✅
Forex
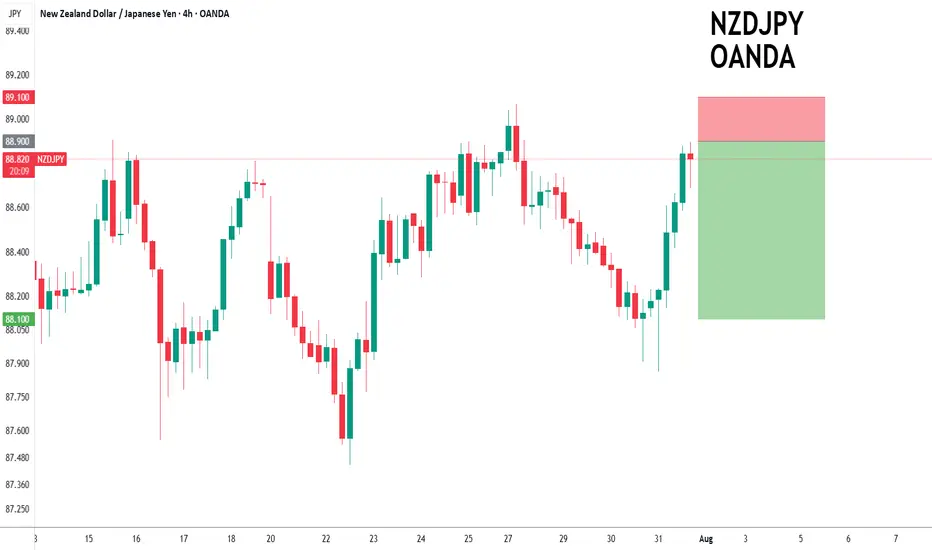
NZDJPY to find sellers at market price?NZDJPY - 24h expiry
Trading has been mixed and volatile.
Price action looks to be forming a top.
We look for a temporary move higher.
Preferred trade is to sell into rallies.
Bespoke resistance is located at 88.90.
We look to Sell at 88.90 (stop at 89.10)
Our profit targets will be 88.10 and 87.90
Resistance: 89.00 / 89.20 / 89.50
Support: 88.40 / 88.10 / 87.90
Risk Disclaimer
The trade ideas beyond this page are for informational purposes only and do not constitute investment advice or a solicitation to trade. This information is provided by Signal Centre, a third-party unaffiliated with OANDA, and is intended for general circulation only. OANDA does not guarantee the accuracy of this information and assumes no responsibilities for the information provided by the third party. The information does not take into account the specific investment objectives, financial situation, or particular needs of any particular person. You should take into account your specific investment objectives, financial situation, and particular needs before making a commitment to trade, including seeking, under a separate engagement, as you deem fit.
You accept that you assume all risks in independently viewing the contents and selecting a chosen strategy.
Where the research is distributed in Singapore to a person who is not an Accredited Investor, Expert Investor or an Institutional Investor, Oanda Asia Pacific Pte Ltd (“OAP“) accepts legal responsibility for the contents of the report to such persons only to the extent required by law. Singapore customers should contact OAP at 6579 8289 for matters arising from, or in connection with, the information/research distributed.
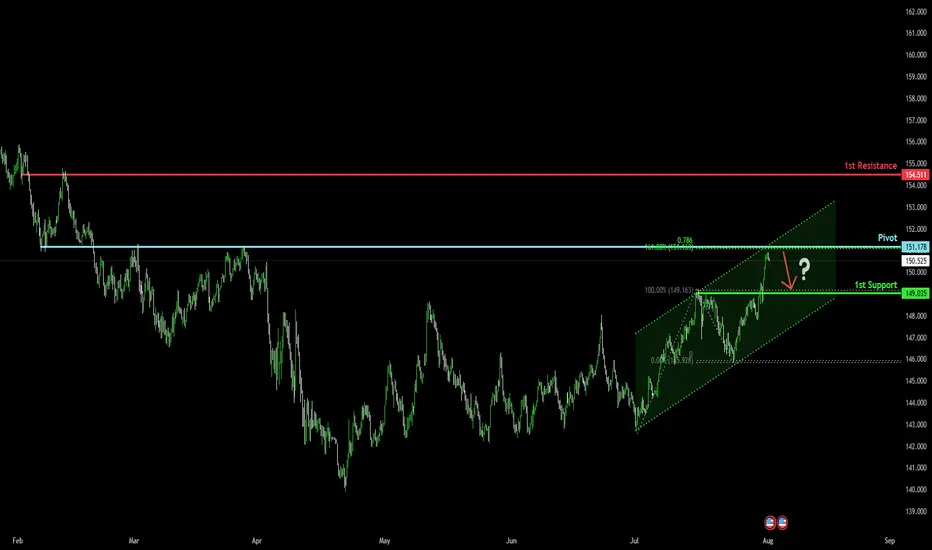
Bearish reversal off overlap resistance?USD/JPY is rising towards the pivot, which has been identified as an overlap resistance and could drop to the 1st support.
Pivot: 151.17
1st Support: 149.03
1st Resistance: 154.51
Risk Warning:
Trading Forex and CFDs carries a high level of risk to your capital and you should only trade with money you can afford to lose. Trading Forex and CFDs may not be suitable for all investors, so please ensure that you fully understand the risks involved and seek independent advice if necessary.
Disclaimer:
The above opinions given constitute general market commentary, and do not constitute the opinion or advice of IC Markets or any form of personal or investment advice.
Any opinions, news, research, analyses, prices, other information, or links to third-party sites contained on this website are provided on an "as-is" basis, are intended only to be informative, is not an advice nor a recommendation, nor research, or a record of our trading prices, or an offer of, or solicitation for a transaction in any financial instrument and thus should not be treated as such. The information provided does not involve any specific investment objectives, financial situation and needs of any specific person who may receive it. Please be aware, that past performance is not a reliable indicator of future performance and/or results. Past Performance or Forward-looking scenarios based upon the reasonable beliefs of the third-party provider are not a guarantee of future performance. Actual results may differ materially from those anticipated in forward-looking or past performance statements. IC Markets makes no representation or warranty and assumes no liability as to the accuracy or completeness of the information provided, nor any loss arising from any investment based on a recommendation, forecast or any information supplied by any third-party.
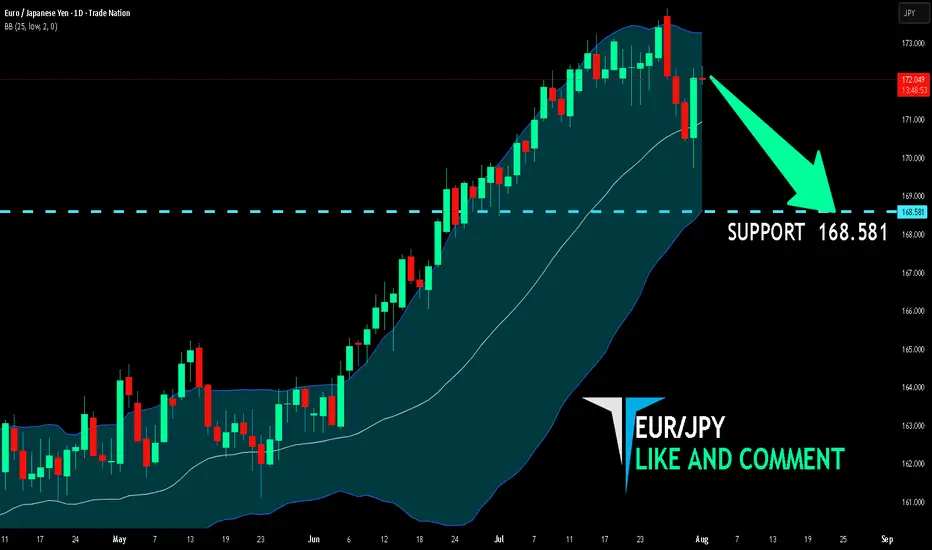
EUR/JPY BEARISH BIAS RIGHT NOW| SHORT
Hello, Friends!
We are now examining the EUR/JPY pair and we can see that the pair is going up locally while also being in a uptrend on the 1W TF. But there is also a powerful signal from the BB upper band being nearby, indicating that the pair is overbought so we can go short from the resistance line above and a target at 168.581 level.
Disclosure: I am part of Trade Nation's Influencer program and receive a monthly fee for using their TradingView charts in my analysis.
✅LIKE AND COMMENT MY IDEAS✅
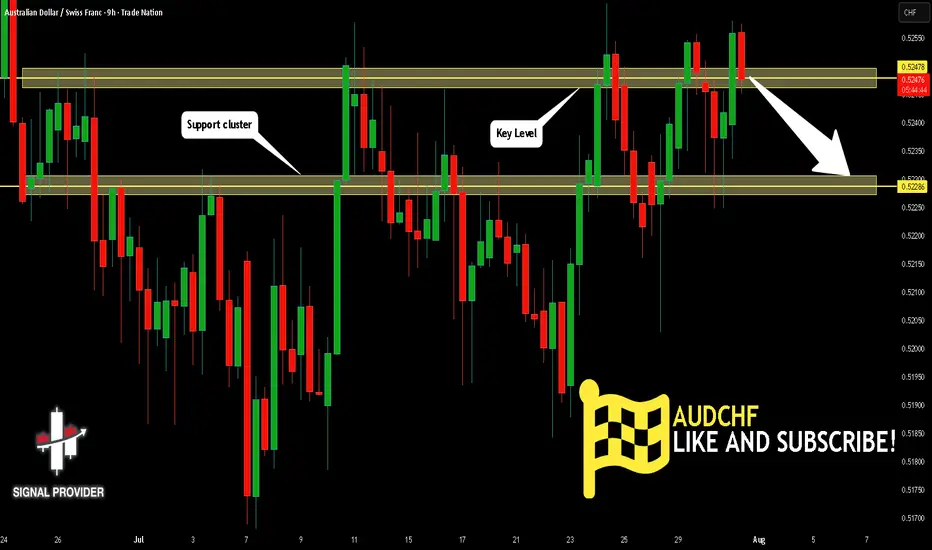
AUDCHF Will Go Down! Short!
Here is our detailed technical review for AUDCHF.
Time Frame: 9h
Current Trend: Bearish
Sentiment: Overbought (based on 7-period RSI)
Forecast: Bearish
The market is on a crucial zone of supply 0.524.
The above-mentioned technicals clearly indicate the dominance of sellers on the market. I recommend shorting the instrument, aiming at 0.522 level.
P.S
Please, note that an oversold/overbought condition can last for a long time, and therefore being oversold/overbought doesn't mean a price rally will come soon, or at all.
Disclosure: I am part of Trade Nation's Influencer program and receive a monthly fee for using their TradingView charts in my analysis.
Like and subscribe and comment my ideas if you enjoy them!
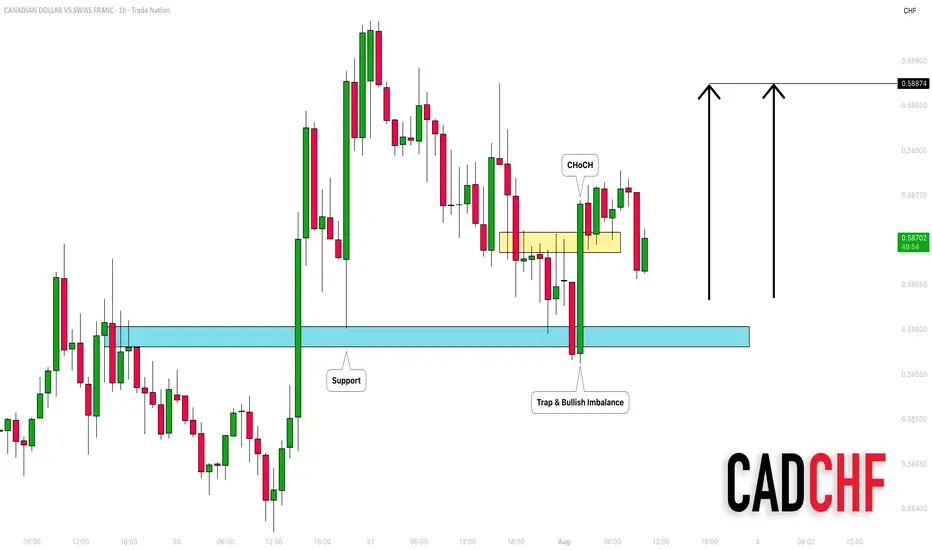
CADCHF: Bullish Move After the Trap 🇨🇦🇨🇭
There is a high chance that CADCHF will go up today.
After a test of a key horizontal support, the price formed
a liquidity grab with a consequent bullish imbalance.
We can expect growth to 0.5887
❤️Please, support my work with like, thank you!❤️
I am part of Trade Nation's Influencer program and receive a monthly fee for using their TradingView charts in my analysis.
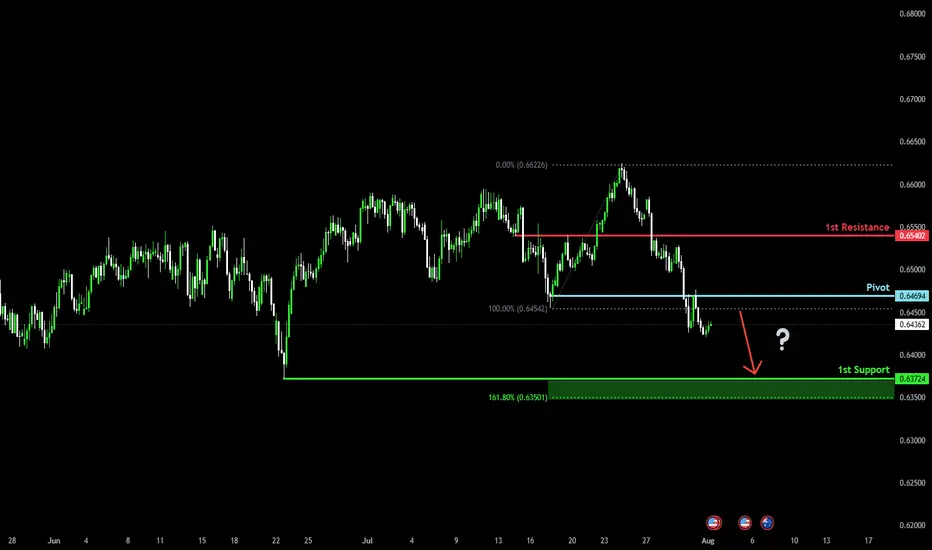
Could we see a further drop for the Aussie?The price has rejected off the pivot, which has been identified as a pullback resistance and could drop to the 1st support, which acts as a swing low support.
Pivot: 0.6469
1st Support: 0.6372
1st Resistance: 0.6540
Risk Warning:
Trading Forex and CFDs carries a high level of risk to your capital and you should only trade with money you can afford to lose. Trading Forex and CFDs may not be suitable for all investors, so please ensure that you fully understand the risks involved and seek independent advice if necessary.
Disclaimer:
The above opinions given constitute general market commentary, and do not constitute the opinion or advice of IC Markets or any form of personal or investment advice.
Any opinions, news, research, analyses, prices, other information, or links to third-party sites contained on this website are provided on an "as-is" basis, are intended only to be informative, is not an advice nor a recommendation, nor research, or a record of our trading prices, or an offer of, or solicitation for a transaction in any financial instrument and thus should not be treated as such. The information provided does not involve any specific investment objectives, financial situation and needs of any specific person who may receive it. Please be aware, that past performance is not a reliable indicator of future performance and/or results. Past Performance or Forward-looking scenarios based upon the reasonable beliefs of the third-party provider are not a guarantee of future performance. Actual results may differ materially from those anticipated in forward-looking or past performance statements. IC Markets makes no representation or warranty and assumes no liability as to the accuracy or completeness of the information provided, nor any loss arising from any investment based on a recommendation, forecast or any information supplied by any third-party.
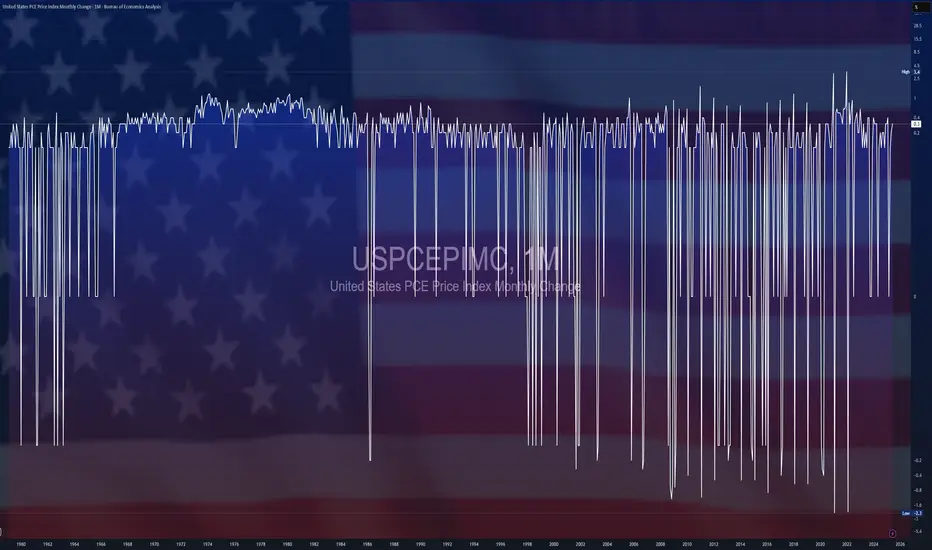
$USPCEPIMC -U.S PCE Prices Rise (June/2025)ECONOMICS:USPCEPIMC
June/2025
source: U.S. Bureau of Economic Analysis
- The US PCE price index rose by 0.3% mom in June, the largest increase in four months, and in line with expectations, led by prices for goods.
The core PCE index also went up 0.3%, aligning with forecasts.
However, both the headline and core annual inflation rates topped forecasts, reaching 2.6% and 2.8%, respectively.
Meanwhile, both personal income and spending edged up 0.3%.
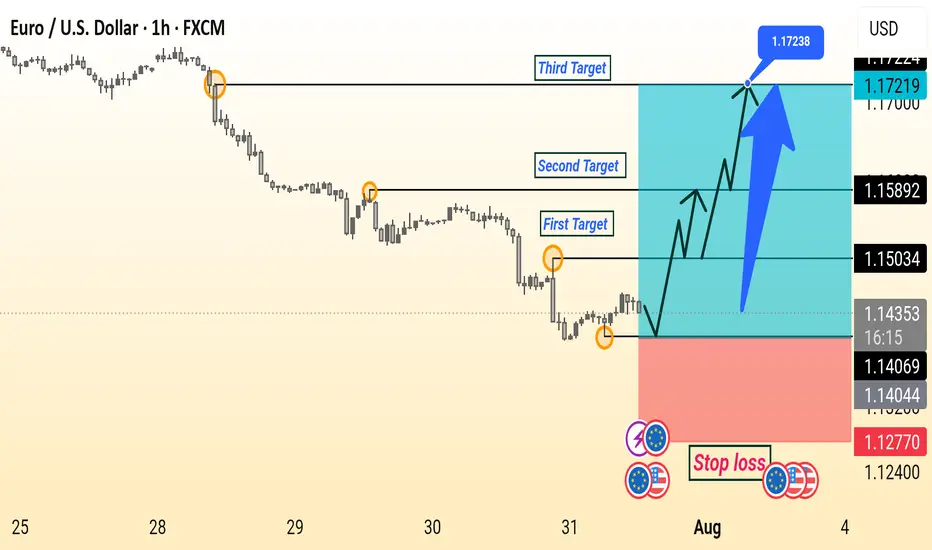
EUR/USD Setup Is Ready This is a bullish EUR/USD (Euro/US Dollar) 1-hour chart analysis. The setup indicates a potential upward reversal after a downtrend, supported by a series of higher lows.
Key elements:
Entry Point: Around 1.14044–1.14376.
Stop Loss: Placed below the recent low at 1.12770 to manage risk.
Targets:
First Target: 1.15034
Second Target: 1.15892
Third Target: 1.17238
The chart suggests a buy setup with a risk-reward strategy, aiming for a breakout and continuation towards higher resistance levels. The large upward arrow emphasizes bullish momentum expectations.
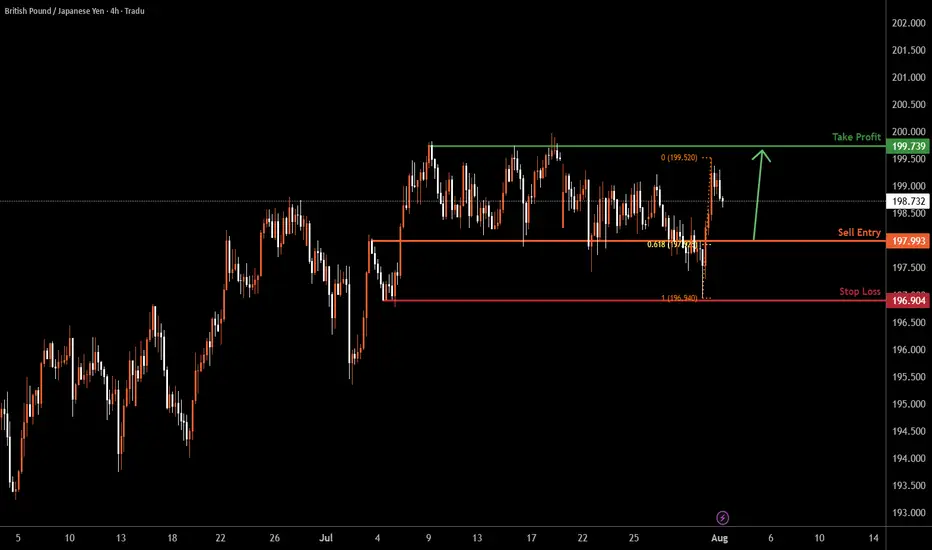
GBP/JPY H4 | Bullish bounce offGBP/JPY is falling towards the buy entry, which is an overlap support that lines up with the 61.8% Fibonacci retracement and could bounce to the take profit.
Buy entry is at 197.99, which is an overlap support that aligns with the 61.8% Fibonacci retracement.
Stop loss is at 196.90, which is a swing low support.
Take profit is at 199.73, which is a multi-swing high resistance.
High Risk Investment Warning
Trading Forex/CFDs on margin carries a high level of risk and may not be suitable for all investors. Leverage can work against you.
Stratos Markets Limited (tradu.com ):
CFDs are complex instruments and come with a high risk of losing money rapidly due to leverage. 65% of retail investor accounts lose money when trading CFDs with this provider. You should consider whether you understand how CFDs work and whether you can afford to take the high risk of losing your money.
Stratos Europe Ltd (tradu.com ):
CFDs are complex instruments and come with a high risk of losing money rapidly due to leverage. 66% of retail investor accounts lose money when trading CFDs with this provider. You should consider whether you understand how CFDs work and whether you can afford to take the high risk of losing your money.
Stratos Global LLC (tradu.com ):
Losses can exceed deposits.
Please be advised that the information presented on TradingView is provided to Tradu (‘Company’, ‘we’) by a third-party provider (‘TFA Global Pte Ltd’). Please be reminded that you are solely responsible for the trading decisions on your account. There is a very high degree of risk involved in trading. Any information and/or content is intended entirely for research, educational and informational purposes only and does not constitute investment or consultation advice or investment strategy. The information is not tailored to the investment needs of any specific person and therefore does not involve a consideration of any of the investment objectives, financial situation or needs of any viewer that may receive it. Kindly also note that past performance is not a reliable indicator of future results. Actual results may differ materially from those anticipated in forward-looking or past performance statements. We assume no liability as to the accuracy or completeness of any of the information and/or content provided herein and the Company cannot be held responsible for any omission, mistake nor for any loss or damage including without limitation to any loss of profit which may arise from reliance on any information supplied by TFA Global Pte Ltd.
The speaker(s) is neither an employee, agent nor representative of Tradu and is therefore acting independently. The opinions given are their own, constitute general market commentary, and do not constitute the opinion or advice of Tradu or any form of personal or investment advice. Tradu neither endorses nor guarantees offerings of third-party speakers, nor is Tradu responsible for the content, veracity or opinions of third-party speakers, presenters or participants.
GOLD falls sharply, fundamental analysis and technical positionOANDA:XAUUSD fell sharply below the $3,300/oz price level as Chairman Jerome Powell did not signal any rate cuts at his next press conference on September 16-17. He only said that “no decision has been made on September” and that “more data will be evaluated in the coming months.” Economic data undermined the case for a rate cut, while geopolitical play remained a potential support.
The Fed and Interest Rates
The Federal Reserve kept interest rates unchanged for a fifth straight meeting on Wednesday, defying persistent pressure from President Donald Trump and White House officials.
However, two members of the central bank's board dissented, a rare move in three decades that underscored growing divisions within the central bank over the impact of Trump's tariff policies.
At the meeting, the Fed kept its benchmark federal funds rate in a range of 4.25% to 4.5%, in line with policy through 2025. Last fall, the Fed cut rates by a total of 100 basis points.
However, Federal Reserve Board Governors Christopher Waller and Michelle Bowman opposed cutting interest rates by another 25 basis points, marking the first time since Alan Greenspan in 1993 that two board members have opposed a majority resolution at a meeting.
At the press conference, Chairman Jerome Powell did not signal a rate cut at the next interest rate meeting on September 16-17, saying only that “no decision has been made about September” and that “more data will be evaluated in the coming months.” Powell also noted that despite Trump’s call for a sharp 3% rate cut to reduce interest costs on US debt and stimulate the housing market, the Fed will continue to monitor the longer-term impact of tariffs on the path of inflation and economic recovery.
Market expectations for a Fed rate cut in September fell to 47% in Powell's speech.
Economic data
ADP jobs data beats expectations and is bearish
US ADP payrolls jumped 104,000 in July, beating market expectations of 75,000 and marking the biggest gain since March. The data showed continued strength in the labor market, reinforcing the Federal Reserve’s stance on keeping interest rates high. Meanwhile, the preliminary estimate of annual GDP growth in the second quarter came in at 3% (2.4% expected), and the core personal consumption expenditures price index rose 2.5% year-on-year (2.3% expected), indicating both economic resilience and inflation stability, further weakening expectations for a rate cut.
Keep an eye on the ISM manufacturing PMI and non-farm payrolls data on August 1. If the jobs numbers continue to be strong, this could reinforce the Fed’s dovish stance.
Geopolitical and Policy Plays
News of a 90-day extension of the US-China tariff deal has eased some safe-haven demand, but Trump’s August 8 deadline for a new Russia-Ukraine deal, coupled with tensions in the Middle East, continue to provide potential support for gold.
Continued purchases by central banks (such as China and India) are a positive signal in the medium to long term, but are unlikely to offset short-term pressure from the Federal Reserve’s policies.
Technical outlook for OANDA:XAUUSD
On the daily chart, gold has been sold below the $3,300 level and now the $3,300 level has become the nearest resistance at present. For now, gold will be limited by the area of the 0.382% Fibonacci retracement with the original price point of $3,300, along with that it has formed a short-term downtrend with the price channel, the next target will be around $3,246 in the short term followed by the Fibonacci retracement level noted with readers in previous publications.
On the momentum front, the Relative Strength Index is operating below 50 and is far from the oversold zone (20-0), indicating that there is still plenty of room for downside ahead.
In addition, the gold trend will also be pressured by the EMA21, as long as gold remains below the EMA21, the current technical conditions continue to favor the downside.
For the day, the technical outlook for gold is bearish with notable positions listed as follows.
Support: 3,246 – 3,228 USD
Resistance: 3,300 USD
SELL XAUUSD PRICE 3345 - 3343⚡️
↠↠ Stop Loss 3349
→Take Profit 1 3337
↨
→Take Profit 2 3331
BUY XAUUSD PRICE 3240 - 3242⚡️
↠↠ Stop Loss 3236
→Take Profit 1 3248
↨
→Take Profit 2 3254

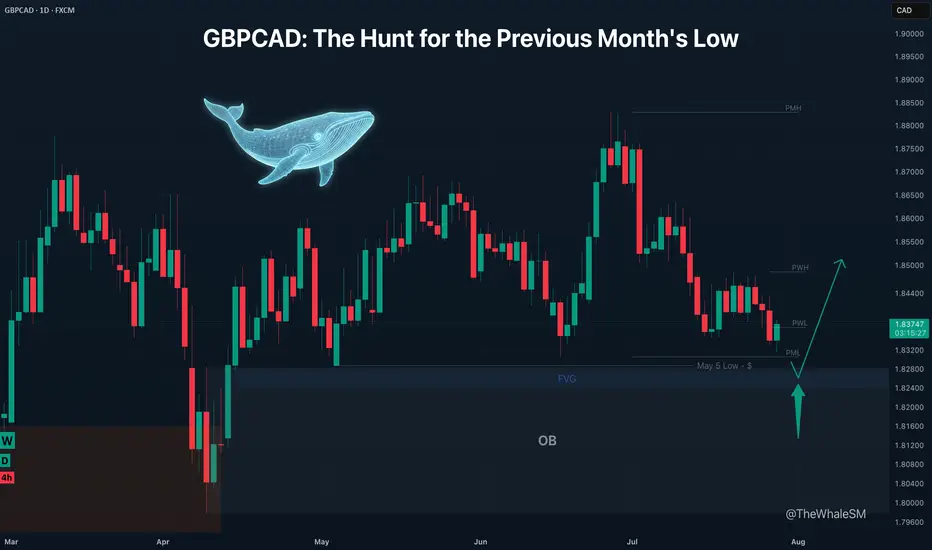
GBPCAD: The Hunt for the Previous Month's LowLike a predator stalking its prey, the market often moves with a clear objective. For GBPCAD, the primary target is now the massive pool of liquidity resting below the Previous Month's Low. This isn't a random drop; it's a calculated hunt. This analysis lays out the plan to join the reversal after the hunt is complete.
The price of GBPCAD is approaching a large pool of liquidity in the form of the Previous Month's Low (PML) , with the May 5th low located just below it. There is a high probability that this liquidity will be swept in the near future, because with only a few days left until the end of the month, the PML will no longer act as such a strong magnet for the price as it does now.
The capture of this liquidity would be accompanied by the mitigation of a daily order block in conjunction with a daily FVG . This confluence of factors could act as strong support for a potential price bounce, with a minimum target of a liquidity sweep of the Previous Week's High (PWH) .
SETUP CONDITIONS
The condition for the long setup to form would be a sharp downside liquidity sweep with a candle wick, which mitigates the upper part of the daily order block, followed by the start of a bullish order flow on a lower timeframe .
► Invalidation: Invalidation of the long scenario would be a daily candle body closing below the May 5th low, or a sharp drop to the middle of the daily order block.
~~~~~~~~~~~~~~~~~~~~~~~~~~~~~~~~~~~~~~~~~~~~~~~~~~~~~~~~~~~~~~~~~
The principles and conditions for forming the manipulation zones I show in this trade idea are detailed in my educational publication, which was chosen by TradingView for the "Editor's Picks" category and received a huge amount of positive feedback from this insightful trading community. To better understand the logic I've used here and the general principles of price movement in most markets from the perspective of institutional capital, I highly recommend checking out this guide if you haven't already. 👇
P.S. This is not a prediction of the exact price direction. It is a description of high-probability setup that become valid only if specific conditions are met when the price reaches the marked POI. If the conditions are not met, the setup are invalid. No setup has a 100% success rate, so if you decide to use this trade idea, always apply a stop-loss and proper risk management. Trade smart.
~~~~~~~~~~~~~~~~~~~~~~~~~~~~~~~~~~~~~~~~~~~~~~~~~~~~~~~~~~~~~~~~~
If you found this analysis helpful, support it with a Boost! 🚀
Have a question or your own view on this idea? Share it in the comments. 💬
► Follow me on TradingView to get real-time updates on THIS idea (entry, targets & live trade management) and not to miss my next detailed breakdown.
~~~~~~~~~~~~~~~~~~~~~~~~~~~~~~~~~~~~~~~~~~~~~~~~~~~~~~~~~~~~~~~~~
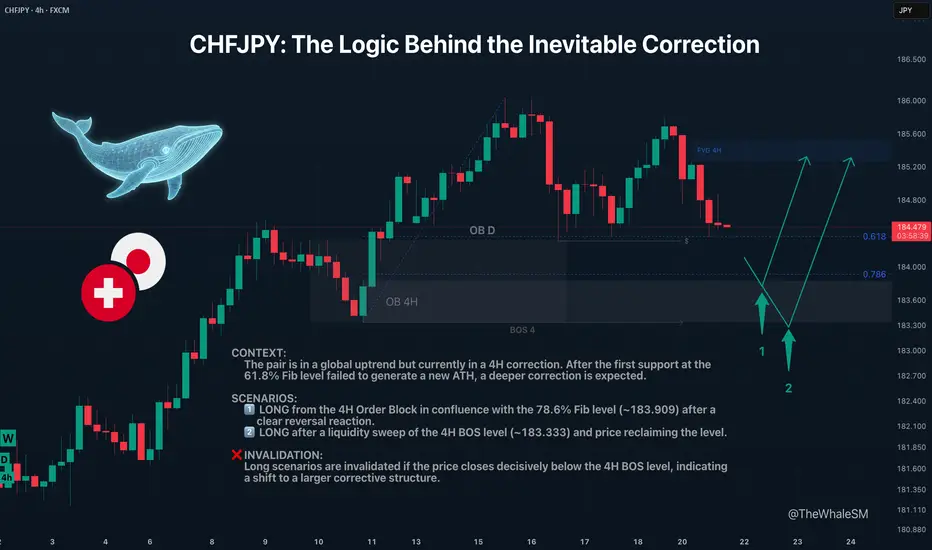
CHFJPY: The Logic Behind the Inevitable CorrectionCHFJPY recently bounced from what seemed like a perfect support level. Many likely saw this as a buy signal. But when the price failed to make a new high, it sent a clear warning: the correction isn't over yet.
This analysis dives into why that first bounce was a trap and where the next institutional levels are waiting below—the ones with the real fuel for the next major move up.
The CHFJPY pair continues its long and strong global uptrend . However, the market cannot move in one direction indefinitely without pullbacks; sooner or later, corrections occur. Large capital, or "Whales," who are the most important market participants, need to refuel with liquidity to continue their advance and to shake off piggybacking competitors. Right now, CHFJPY is in a 4H structure correction .
The first target for this correction was the 61.8% Fib level and a daily order block. The price did show a reversal reaction from them, but it lacked enough liquidity to create a new ATH, and the price continued its corrective movement. The next target for the correction will be the 78.6% Fibonacci retracement level at ~183.909, in conjunction with a 4H order block . This move will also sweep liquidity from the low of July 16th.
Two Potential Long Scenarios
SCENARIO 1: Entry from the 78.6% Fib Level & 4H Order Block
The first long entry scenario will be triggered by a clear reversal reaction from this support confluence.
► Setup Condition: Price must reach this zone, mitigate the order block, and close decisively above the 78.6% level, showing strength. An entry will require LTF confirmation (a BOS or the beginning of LTF order flow).
► Invalidation: If the 78.6% level is broken and the price closes below it, this scenario is invalid. In this case, the 4H order block itself will act as liquidity, and an attack on the 4H structure's break level (BOS 4) will likely occur.
SCENARIO 2: Entry After a Deeper Liquidity Sweep
This path becomes active if the first scenario fails.
► Setup Condition: A liquidity sweep with a candle wick below the 4H BOS level (183.333), with the price then closing back above this level. The final confirmation would be the start of a new order flow on a lower timeframe.
► Invalidation: A decisive close below the 4H BOS level will invalidate all long scenarios and will signal that the correction is shifting to a higher timeframe structure.
~~~~~~~~~~~~~~~~~~~~~~~~~~~~~~~~~~~~~~~~~~~~~~~~~~~~~~~~~~~~~~~~~
The principles and conditions for forming the manipulation zones I show in this trade idea are detailed in my educational publication, which was chosen by TradingView for the "Editor's Picks" category and received a huge amount of positive feedback from this wonderful, advanced TV community. To better understand the logic I've used here and the general principles of price movement in most markets from the perspective of institutional capital, I highly recommend checking out this guide if you haven't already. 👇
P.S. This is not a prediction of the exact price direction. It is a description of high-probability setups that become valid only if specific conditions are met when the price reaches the marked POI. If the conditions are not met, the setups are invalid. No setup has a 100% success rate, so if you decide to use this trade idea, always use a stop-loss and proper risk management. Trade smart.
~~~~~~~~~~~~~~~~~~~~~~~~~~~~~~~~~~~~~~~~~~~~~~~~~~~~~~~~~~~~~~~~~
If you found this analysis helpful, support it with a Boost! 🚀
Have a question or your own view on this idea? Share it in the comments. 💬
► Follow me on TradingView to get real-time updates on THIS idea (entry, targets & live trade management) and not to miss my next detailed breakdown.
~~~~~~~~~~~~~~~~~~~~~~~~~~~~~~~~~~~~~~~~~~~~~~~~~~~~~~~~~~~~~~~~~
GOLD Buyers In Panic! SELL!
My dear friends,
Please, find my technical outlook for GOLD below:
The instrument tests an important psychological level 3309.2
Technical Indicators: Supper Trend gives a precise Bearish signal, while Pivot Point HL predicts price changes and potential reversals in the market.
Target - 3296.9
Recommended Stop Loss - 3316.4
About Used Indicators:
Super-trend indicator is more useful in trending markets where there are clear uptrends and downtrends in price.
Disclosure: I am part of Trade Nation's Influencer program and receive a monthly fee for using their TradingView charts in my analysis.
———————————
WISH YOU ALL LUCK
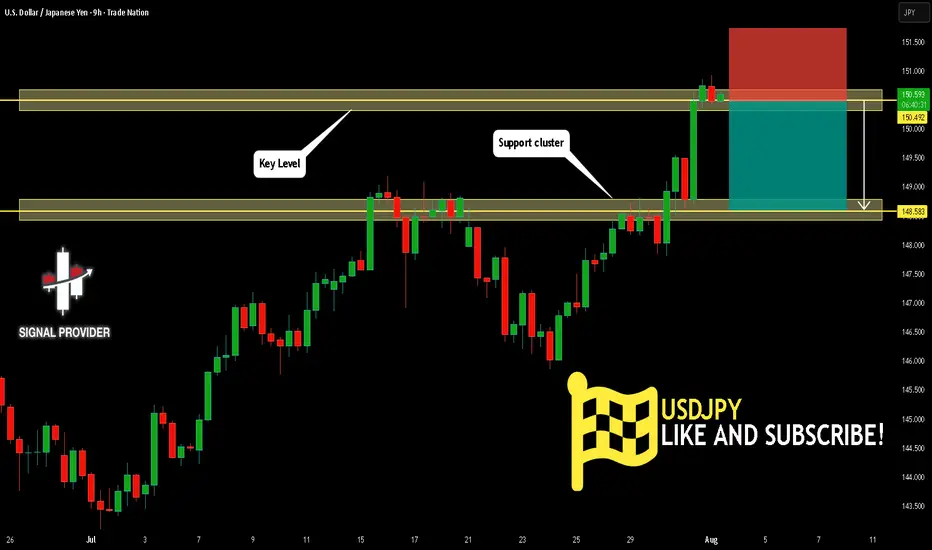
USDJPY Is Very Bearish! Sell!
Here is our detailed technical review for USDJPY.
Time Frame: 9h
Current Trend: Bearish
Sentiment: Overbought (based on 7-period RSI)
Forecast: Bearish
The market is on a crucial zone of supply 150.492.
The above-mentioned technicals clearly indicate the dominance of sellers on the market. I recommend shorting the instrument, aiming at 148.583 level.
P.S
We determine oversold/overbought condition with RSI indicator.
When it drops below 30 - the market is considered to be oversold.
When it bounces above 70 - the market is considered to be overbought.
Disclosure: I am part of Trade Nation's Influencer program and receive a monthly fee for using their TradingView charts in my analysis.
Like and subscribe and comment my ideas if you enjoy them!
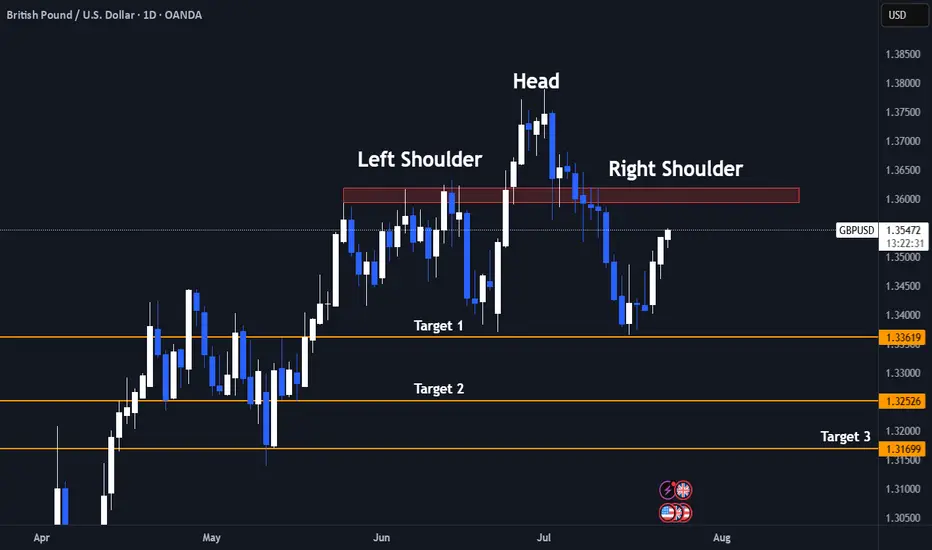
Bull Trap Confirmed: GBPUSD's 8% Rally Faces ExhaustionLets Face it we had a great 6 months already clocking 60%+ Returns already.
And after sitting ducks for almost 2 months now we finally have a trade.
- Its a very self explanatory chart
- Trading at resistance
- Head & Shoulder pattern
And the best part the right shoulder is still yet to be formed! My favourite type of entry.
1.It gives a better risk reward ratio (1:7 expected)
2.Better Entry (No long red candles)
3. And even if the pattern fails it we may still reach the neck line which is target 1.
Entry Criteria
- A Red candle at the entry Line Marked
- Stoploss Above the Entry Candle
Target 1- 1.3361
Target 2- 1.3252
Target 3- 1.3169
Keep Your Risk Reward Intact! Not An investment Advice
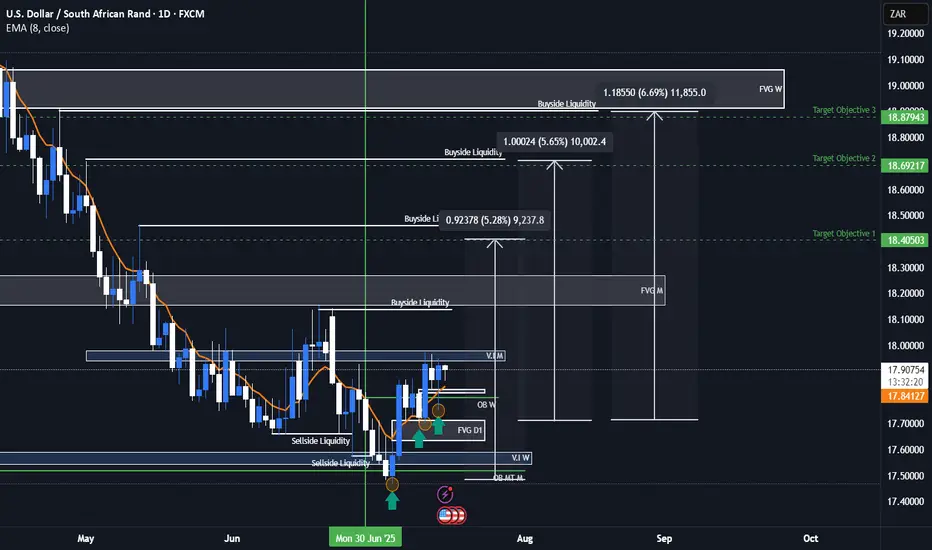
USDZAR Bullish ideaAs we can see this is our USDZAR quarterly shift idea were we are anticipating price to rally to the upside toward our draw on liquidity objectives. We had a weekly volume imbalance and monthly mean threshold order block show us support after we took out major liquidity points. We also showed more support on our daily FVG and a market shift taking place after a displacement. We are anticipating a rally for USDZAR and will be looking to see how price plays out.
USDZAR is an exotic pair that is part of the emerging markets and emerging markets/exotic pairs can usually lead ahead of major forex pair or lag between major forex pairs so this can also help us with our intermarket analysis of forex pairs when determining our dollar strength against other basket currencies.
XAUUSD – Downtrend Confirmed, Bears in ControlOn the H4 timeframe, gold has completely broken its short-term uptrend structure and formed a series of lower highs and lower lows. Every bounce is rejected at the strong resistance zone of 3,326 – 3,333 USD, confirming the clear downtrend.
Although the recently released Core PCE index was lower than expected, this is not enough to drive a recovery as other data, such as the Employment Cost Index and statements from the Fed, still show persistent inflationary pressure. Therefore, the monetary policy remains hawkish, causing money to flow out of gold.
Currently, the price is approaching the critical support zone of 3,247. If this level is broken, the scenario of further declines to 3,192 is entirely possible.

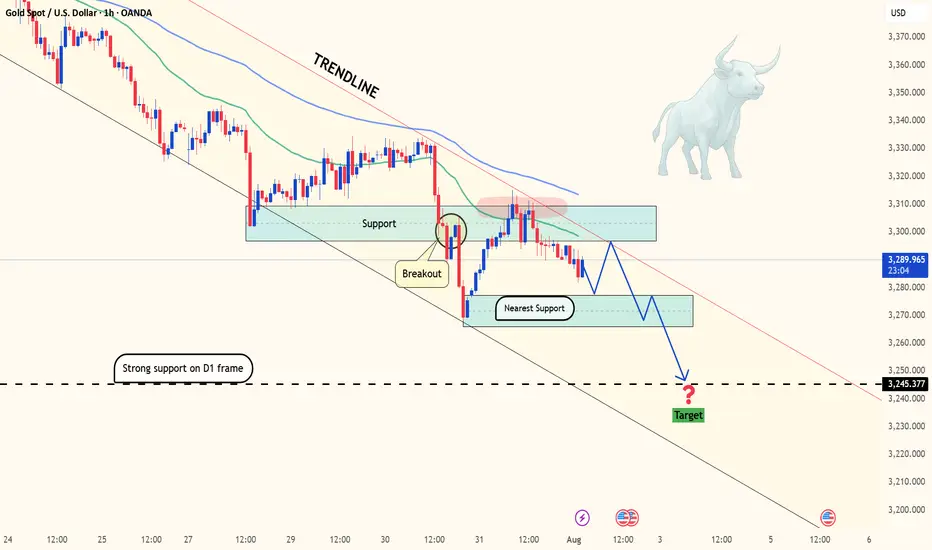
Gold on the edge: Will 3,270 break as Fed pressure builds?Hello traders, what’s your view on XAUUSD?
Yesterday, gold remained under pressure as a series of fresh U.S. economic data reinforced expectations that the Federal Reserve will keep interest rates higher for longer. As a result, U.S. Treasury yields surged, the dollar strengthened, and gold came under renewed selling pressure. Currently, XAUUSD is trading around 3,288 USD, down 0.04% on the day.
From a technical standpoint, gold is clearly trading within a well-defined downward-sloping channel, confirming the dominance of bearish momentum. Moreover, both the EMA34 and EMA89 are acting as dynamic resistance levels, repeatedly rejecting any short-term recovery attempts—highlighting the strength of the current downtrend.
If a pullback occurs before the next leg lower, the confluence of resistance and the EMA zone will be crucial to watch. It could offer ideal conditions for potential short setups in line with the trend.
Looking ahead, the next key support lies at 3,270 USD. A break below this level could open the door for a deeper move toward the 32XX area.
What do you think? Will gold continue to drop further?
Good luck and trade safe!
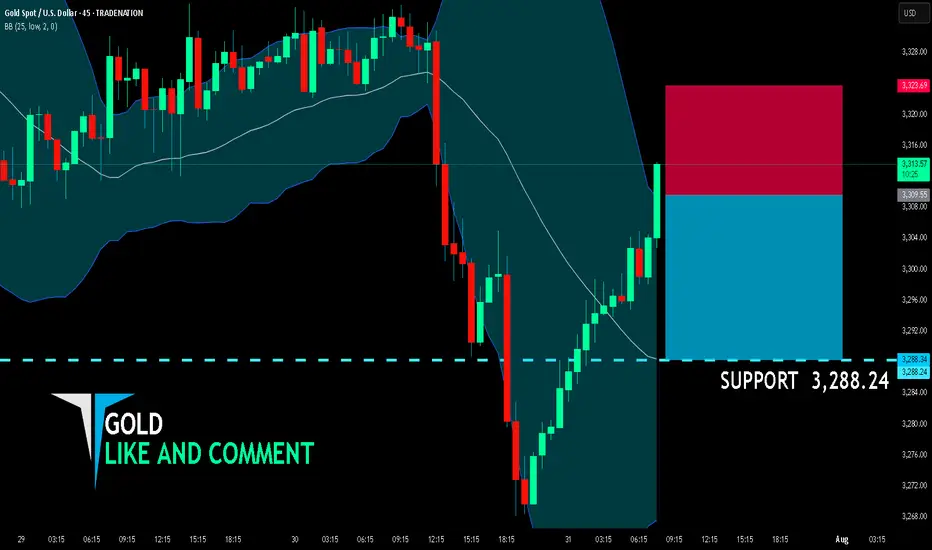
GOLD BEST PLACE TO SELL FROM|SHORT
GOLD SIGNAL
Trade Direction: short
Entry Level: 3,309.55
Target Level: 3,288.24
Stop Loss: 3,323.69
RISK PROFILE
Risk level: medium
Suggested risk: 1%
Timeframe: 45m
Disclosure: I am part of Trade Nation's Influencer program and receive a monthly fee for using their TradingView charts in my analysis.
✅LIKE AND COMMENT MY IDEAS✅
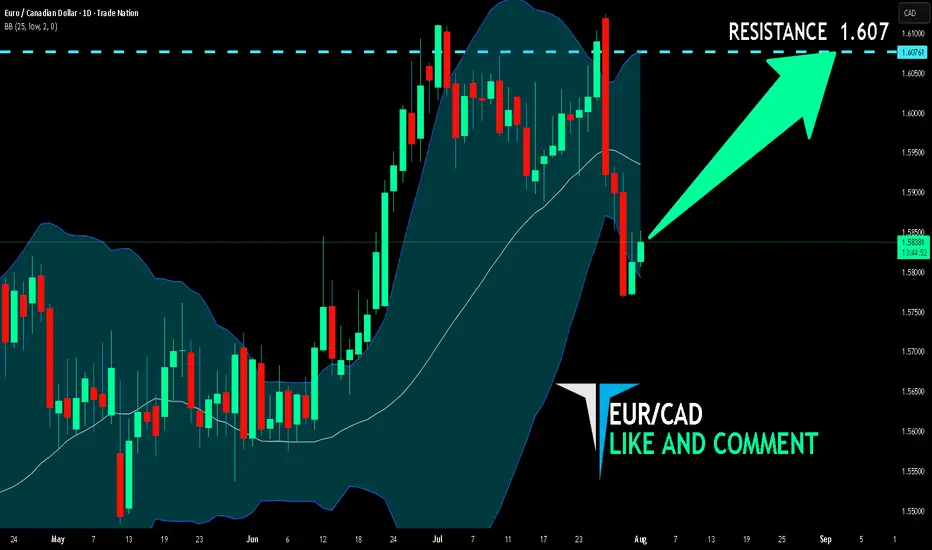
EUR/CAD BUYERS WILL DOMINATE THE MARKET|LONG
Hello, Friends!
We are going long on the EUR/CAD with the target of 1.607 level, because the pair is oversold and will soon hit the support line below. We deduced the oversold condition from the price being near to the lower BB band. However, we should use low risk here because the 1W TF is red and gives us a counter-signal.
Disclosure: I am part of Trade Nation's Influencer program and receive a monthly fee for using their TradingView charts in my analysis.
✅LIKE AND COMMENT MY IDEAS✅
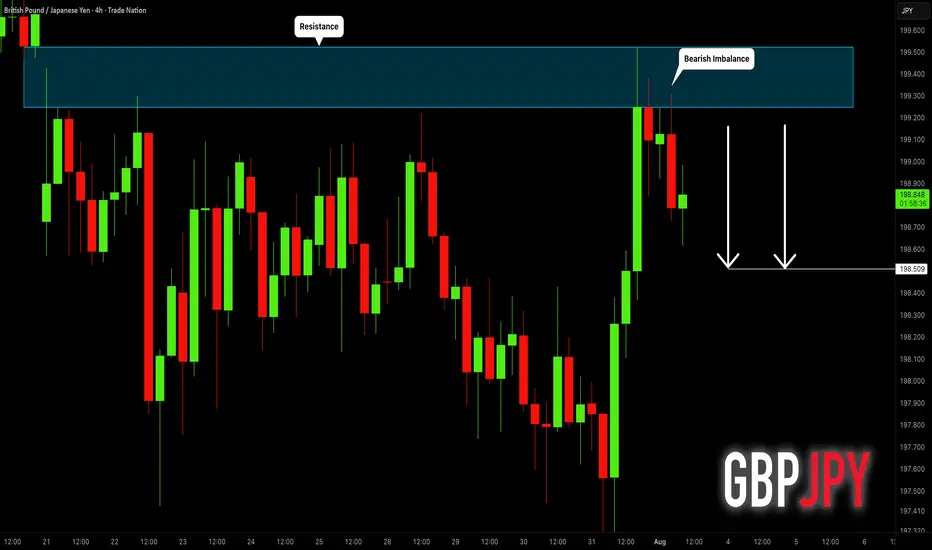
GBPJPY: Pullback From Resistance 🇬🇧🇯🇵
I think that GBPJPY will pull back from a wide
intraday supply area.
As a confirmation, I see a bearish imbalance candle that
is formed after its test.
Goal - 198.51
❤️Please, support my work with like, thank you!❤️
I am part of Trade Nation's Influencer program and receive a monthly fee for using their TradingView charts in my analysis.
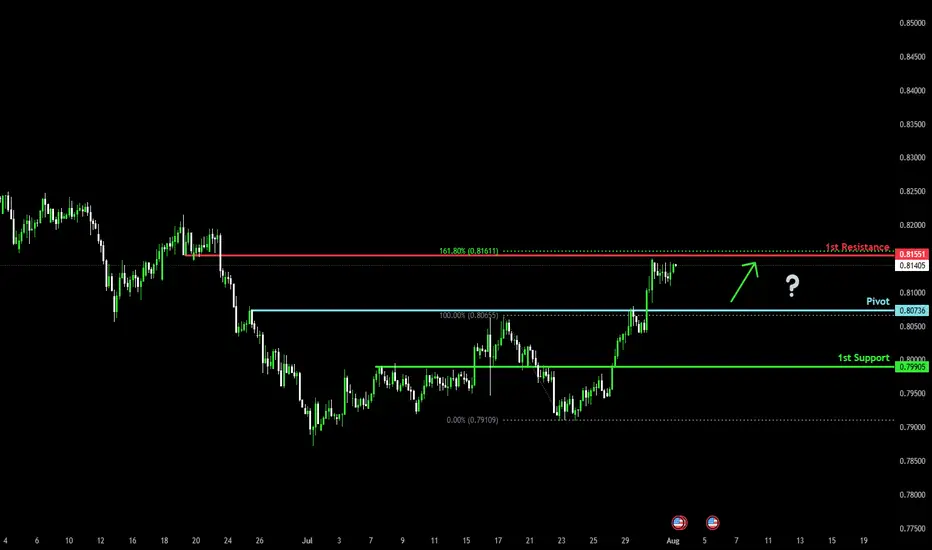
Bullish bounce off pullback support?The Swissie (USD/CHF) is falling towards the pivot, which acts as a pullback support and could bounce to the 1st resistance, which lines up with the 161.8% Fibonacci extension.
Pivot: 0.8073
1st Support: 0.7990
1st Resistance: 0.8155
Risk Warning:
Trading Forex and CFDs carries a high level of risk to your capital and you should only trade with money you can afford to lose. Trading Forex and CFDs may not be suitable for all investors, so please ensure that you fully understand the risks involved and seek independent advice if necessary.
Disclaimer:
The above opinions given constitute general market commentary, and do not constitute the opinion or advice of IC Markets or any form of personal or investment advice.
Any opinions, news, research, analyses, prices, other information, or links to third-party sites contained on this website are provided on an "as-is" basis, are intended only to be informative, is not an advice nor a recommendation, nor research, or a record of our trading prices, or an offer of, or solicitation for a transaction in any financial instrument and thus should not be treated as such. The information provided does not involve any specific investment objectives, financial situation and needs of any specific person who may receive it. Please be aware, that past performance is not a reliable indicator of future performance and/or results. Past Performance or Forward-looking scenarios based upon the reasonable beliefs of the third-party provider are not a guarantee of future performance. Actual results may differ materially from those anticipated in forward-looking or past performance statements. IC Markets makes no representation or warranty and assumes no liability as to the accuracy or completeness of the information provided, nor any loss arising from any investment based on a recommendation, forecast or any information supplied by any third-party.