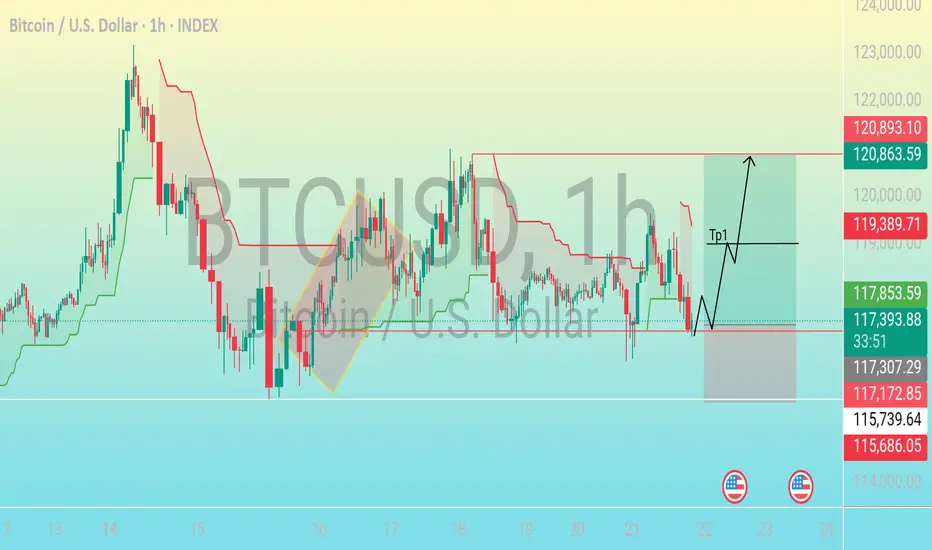
Precision Entry Zone📊 Chart Breakdown: BTC/USD (1H Timeframe)
As of July 21, 2025
---
1. Support Zone Identified (117,172 – 117,307)
The blue shaded box near the bottom of the range marks a strong demand/support zone.
Price action has tested this area multiple times and bounced, indicating buyers are stepping in.
The recent wick rejections in this zone suggest it's a key level to watch for potential reversals.
---
2. Entry Area (Near 117,359)
Current price sits around 117,359, just above the support.
The horizontal trend line indicates a possible early long entry as price respects this level.
It's a low-risk entry point because the stop loss can be placed just below the support box.
---
3. Bullish Structure Anticipated
The drawn path shows an expected bullish breakout, with price climbing after retesting the support.
This implies a "break–retest–continue" pattern — price pushes up, retests support or broken resistance, then continues higher.
---
4. First Take Profit (TP1 at ~119,389)
The first target zone is marked as TP1.
This coincides with a previous resistance level, making it a logical area for partial profits or full exit if trading conservatively.
It's also the mid-point of the projected range, providing a 1:1 to 1:2 risk-to-reward ratio, depending on entry.
---
5. Final Target Area (120,863 – 120,893)
The green zone above TP1 is the major resistance zone, where price may slow or reverse.
This area also aligns with the upper boundary of the previous sideways consolidation.
If bullish momentum is strong and TP1 is broken with volume, this zone becomes the final destination for the move.
---
6. Stop-Loss Placement
A smart SL (stop-loss) would be set just below the support zone, around 115,739 – 115,686.
This keeps downside limited and avoids being stopped out by noise, while preserving a solid R:R (risk-to-reward) structure.
---
7. Indicators Used (Likely Ichimoku or Trend Bands)
The red and green lines on the chart resemble Kijun-Sen / Tenkan-Sen or dynamic S/R levels like trend-following bands.
These are providing visual dynamic resistance and support, further confirming the horizontal zones.
BITSTAMP:BTCUSD
Forex
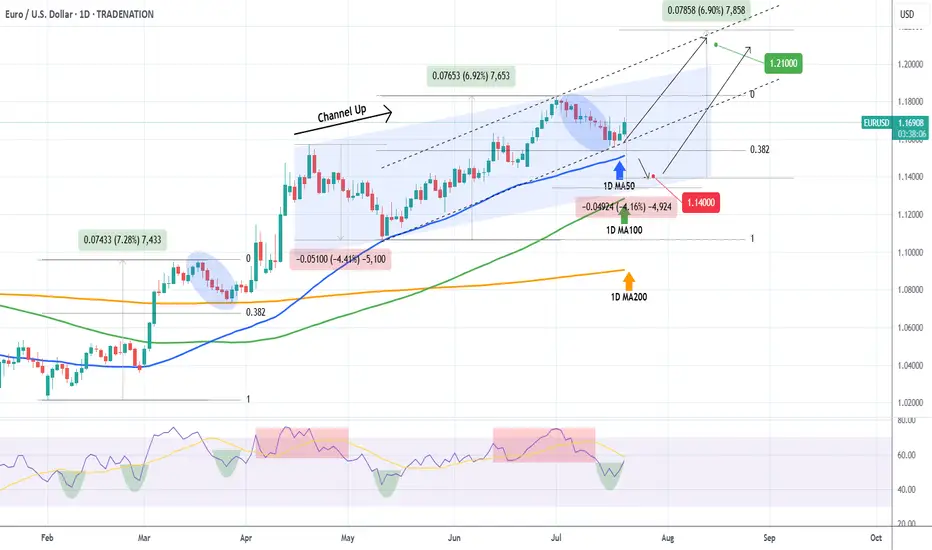
EURUSD Will the 1D MA50 hold?The EURUSD pair seems to be rebounding just before a 1D MA50 (blue trend-line) test, which is its short-term Support. At the same time it bounced off the 0.382 Fibonacci retracement level, which after a +6.92% rise, it resembles the March 27 rebound.
The 1D RSI is printing a standard bullish reversal setup, seen already 4 times since February, and a break above its MA will confirm it.
As long as the 1D MA50 holds, it may extend the uptrend to a new Channel Up (dashed), outside the blue one that may look for a new +6.92% rise. In that case our Target will be 1.21000.
If the 1D MA50 breaks, we will add one last buy at 1.14000, near the 1D MA100 (green trend-line).
-------------------------------------------------------------------------------
** Please LIKE 👍, FOLLOW ✅, SHARE 🙌 and COMMENT ✍ if you enjoy this idea! Also share your ideas and charts in the comments section below! This is best way to keep it relevant, support us, keep the content here free and allow the idea to reach as many people as possible. **
-------------------------------------------------------------------------------
Disclosure: I am part of Trade Nation's Influencer program and receive a monthly fee for using their TradingView charts in my analysis.
💸💸💸💸💸💸
👇 👇 👇 👇 👇 👇
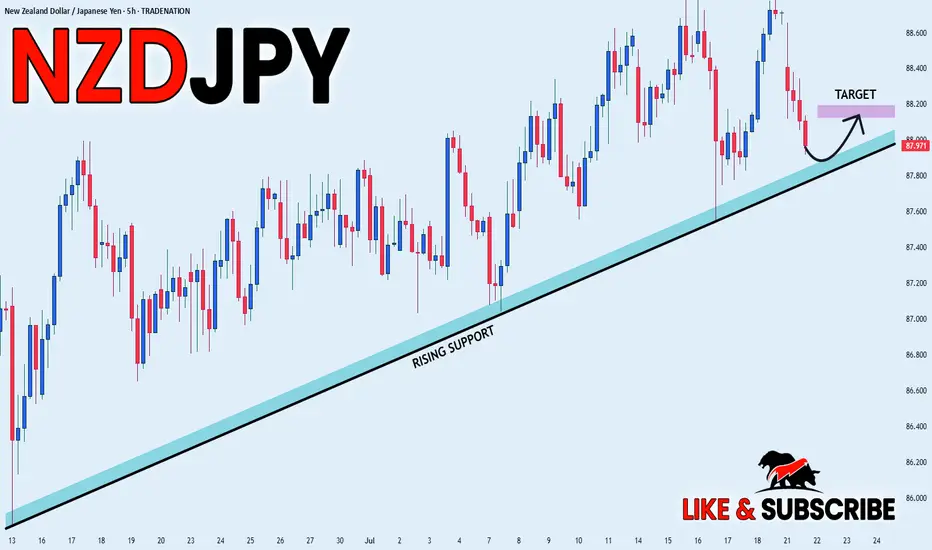
NZD_JPY RISING SUPPORT AHEAD|LONG|
✅NZD_JPY went down from
The resistance just as I predicted
In my previous analysis but now
The pair is approaching a rising
Support line from where we will
Be expecting a local bullish rebound
LONG🚀
✅Like and subscribe to never miss a new idea!✅
Disclosure: I am part of Trade Nation's Influencer program and receive a monthly fee for using their TradingView charts in my analysis.
USD-CHF Bearish Wedge! Sell!
Hello,Traders!
USD-CHF is trading in a
Downtrend and has formed
A bearish wedge pattern
So IF we see a breakout
Then we a further bearish
Continuation will be expected
Sell!
Comment and subscribe to help us grow!
Check out other forecasts below too!
Disclosure: I am part of Trade Nation's Influencer program and receive a monthly fee for using their TradingView charts in my analysis.

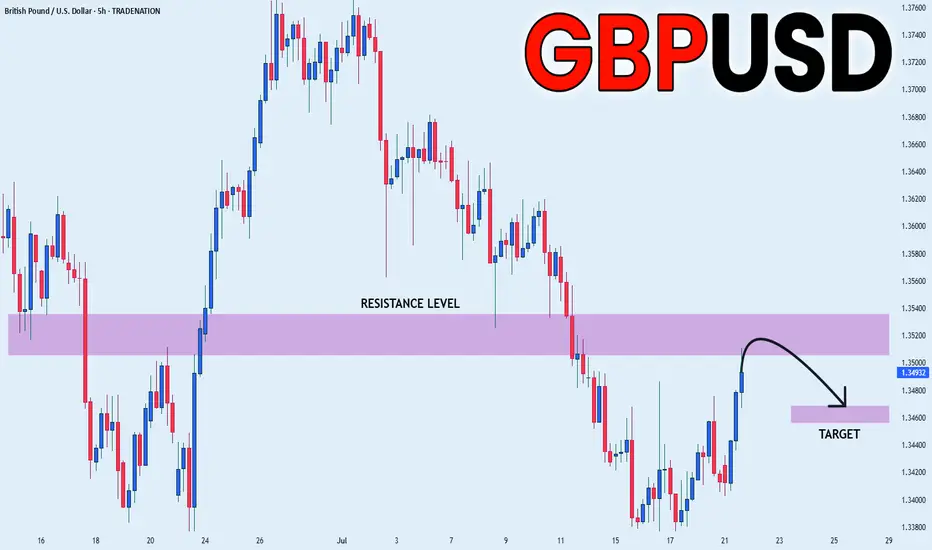
GBP_USD RESISTANCE AHEAD|SHORT|
✅GBP_USD has been growing recently
And the pair seems locally overbought
So as the pair is approaching
A horizontal resistance of 1.3520
Price decline is to be expected
SHORT🔥
✅Like and subscribe to never miss a new idea!✅
Disclosure: I am part of Trade Nation's Influencer program and receive a monthly fee for using their TradingView charts in my analysis.
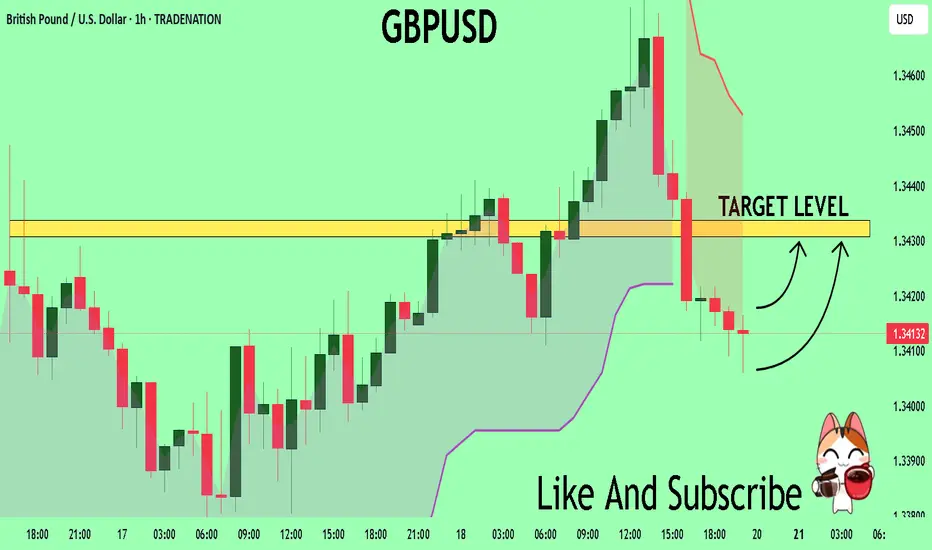
GBPUSD Expected Growth! BUY!
My dear followers,
I analysed this chart on GBPUSD and concluded the following:
The market is trading on 1.3413 pivot level.
Bias - Bullish
Technical Indicators: Both Super Trend & Pivot HL indicate a highly probable Bullish continuation.
Target - 1.3430
About Used Indicators:
A super-trend indicator is plotted on either above or below the closing price to signal a buy or sell. The indicator changes color, based on whether or not you should be buying. If the super-trend indicator moves below the closing price, the indicator turns green, and it signals an entry point or points to buy.
Disclosure: I am part of Trade Nation's Influencer program and receive a monthly fee for using their TradingView charts in my analysis.
———————————
WISH YOU ALL LUCK
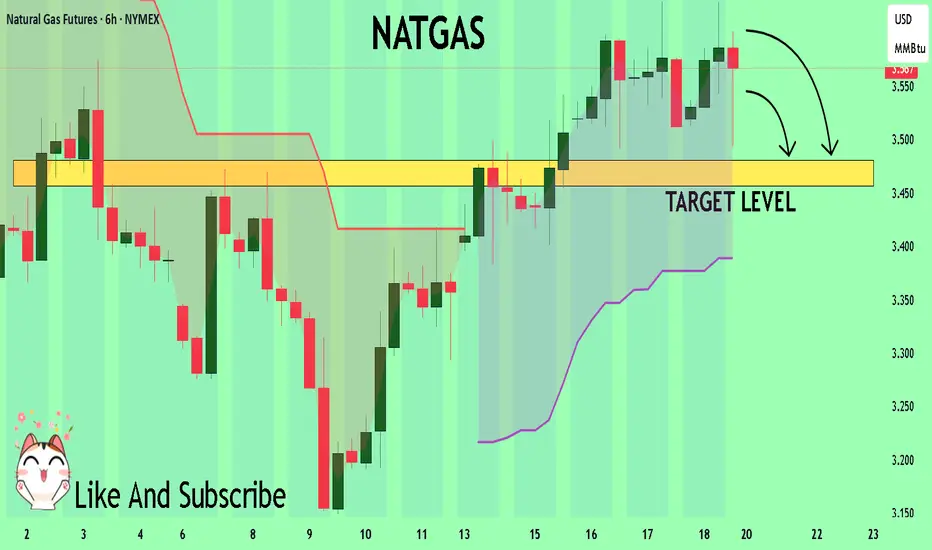
NATGAS Trading Opportunity! SELL!
My dear followers,
This is my opinion on the NATGAS next move:
The asset is approaching an important pivot point 3.567
Bias - Bearish
Technical Indicators: Supper Trend generates a clear short signal while Pivot Point HL is currently determining the overall Bearish trend of the market.
Goal - 3.480
About Used Indicators:
For more efficient signals, super-trend is used in combination with other indicators like Pivot Points.
Disclosure: I am part of Trade Nation's Influencer program and receive a monthly fee for using their TradingView charts in my analysis.
———————————
WISH YOU ALL LUCK
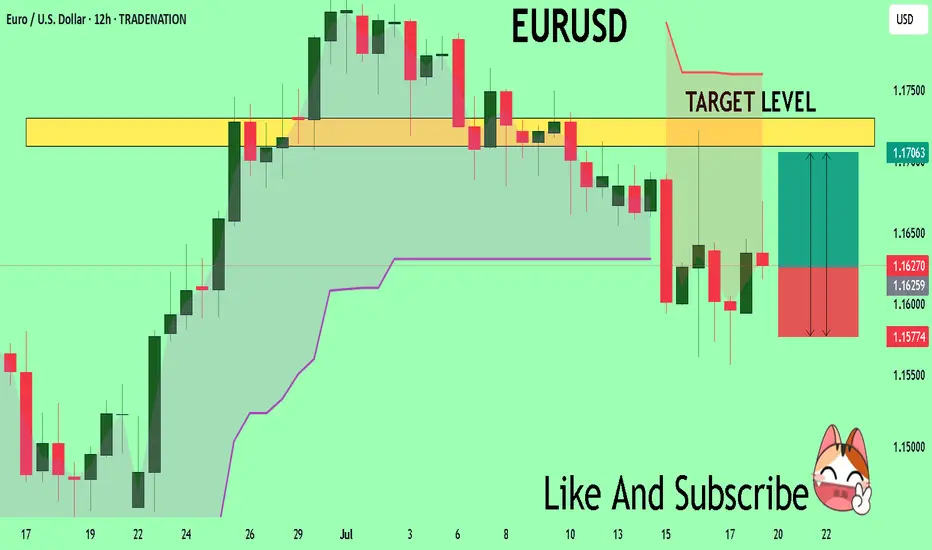
EURUSD Massive Long! BUY!
My dear friends,
Please, find my technical outlook for EURUSD below:
The price is coiling around a solid key level - 1.1627
Bias - Bullish
Technical Indicators: Pivot Points Low anticipates a potential price reversal.
Super trend shows a clear buy, giving a perfect indicators' convergence.
Goal - 1.1710
Safe Stop Loss - 1.1577
About Used Indicators:
The pivot point itself is simply the average of the high, low and closing prices from the previous trading day.
Disclosure: I am part of Trade Nation's Influencer program and receive a monthly fee for using their TradingView charts in my analysis.
———————————
WISH YOU ALL LUCK
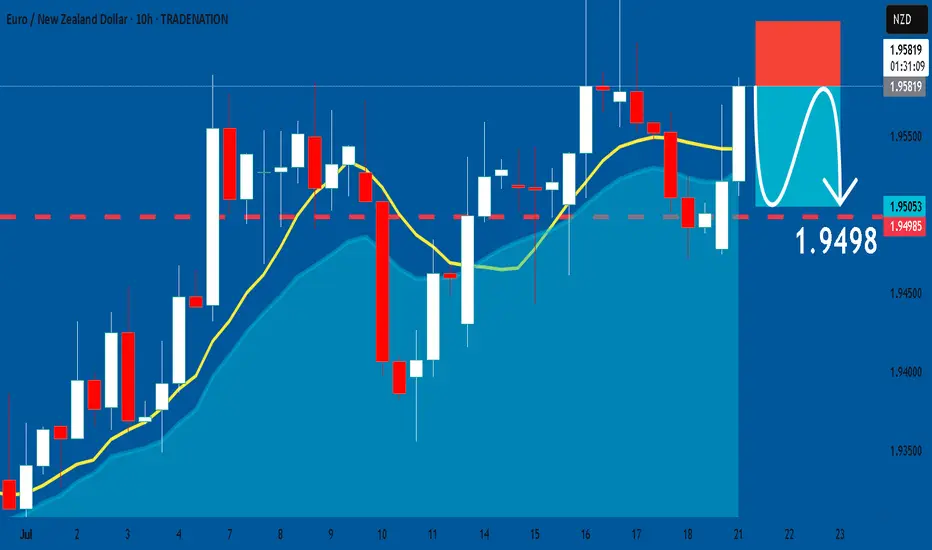
EURNZD: Short Signal with Entry/SL/TP
EURNZD
- Classic bearish formation
- Our team expects pullback
SUGGESTED TRADE:
Swing Trade
Short EURNZD
Entry - 1.9581
Sl - 1.9622
Tp - 1.9498
Our Risk - 1%
Start protection of your profits from lower levels
Disclosure: I am part of Trade Nation's Influencer program and receive a monthly fee for using their TradingView charts in my analysis.
❤️ Please, support our work with like & comment! ❤️
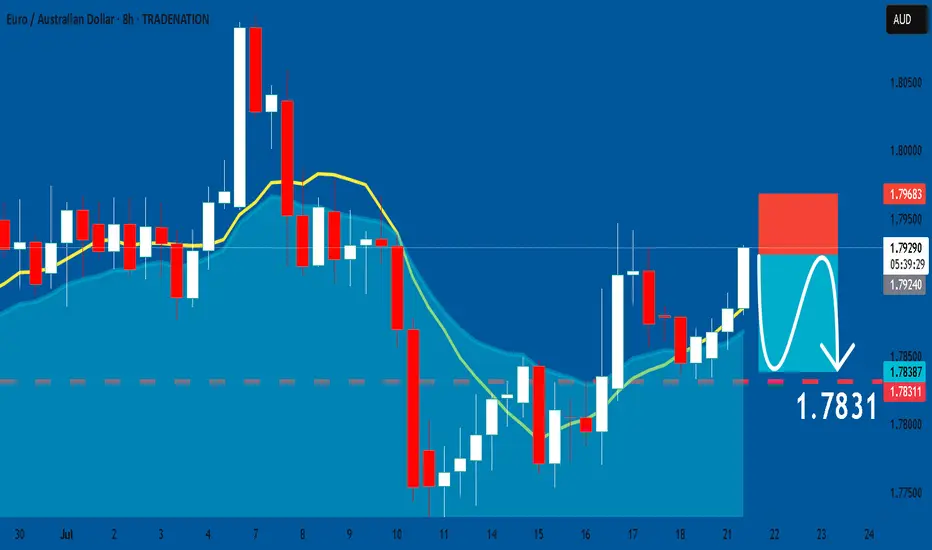
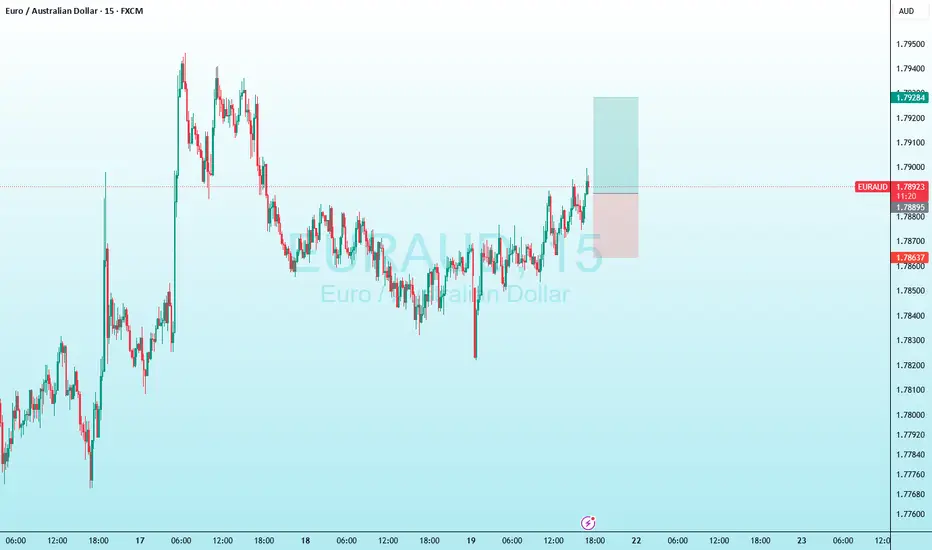
EURAUD: Short Signal Explained
EURAUD
- Classic bearish pattern
- Our team expects retracement
SUGGESTED TRADE:
Swing Trade
Sell EURAUD
Entry - 1.7924
Stop - 1.7968
Take - 1.7831
Our Risk - 1%
Start protection of your profits from lower levels
Disclosure: I am part of Trade Nation's Influencer program and receive a monthly fee for using their TradingView charts in my analysis.
❤️ Please, support our work with like & comment! ❤️
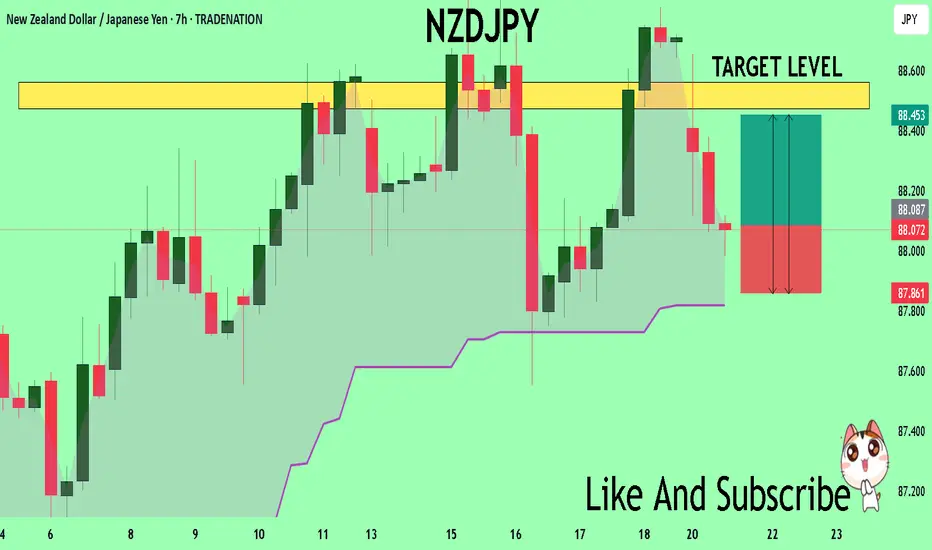
NZDJPY Set To Grow! BUY!
My dear friends,
My technical analysis for NZDJPY is below:
The market is trading on 88.079 pivot level.
Bias - Bullish
Technical Indicators: Both Super Trend & Pivot HL indicate a highly probable Bullish continuation.
Target - 88.472
Recommended Stop Loss - 87.861
About Used Indicators:
A pivot point is a technical analysis indicator, or calculations, used to determine the overall trend of the market over different time frames.
Disclosure: I am part of Trade Nation's Influencer program and receive a monthly fee for using their TradingView charts in my analysis.
———————————
WISH YOU ALL LUCK
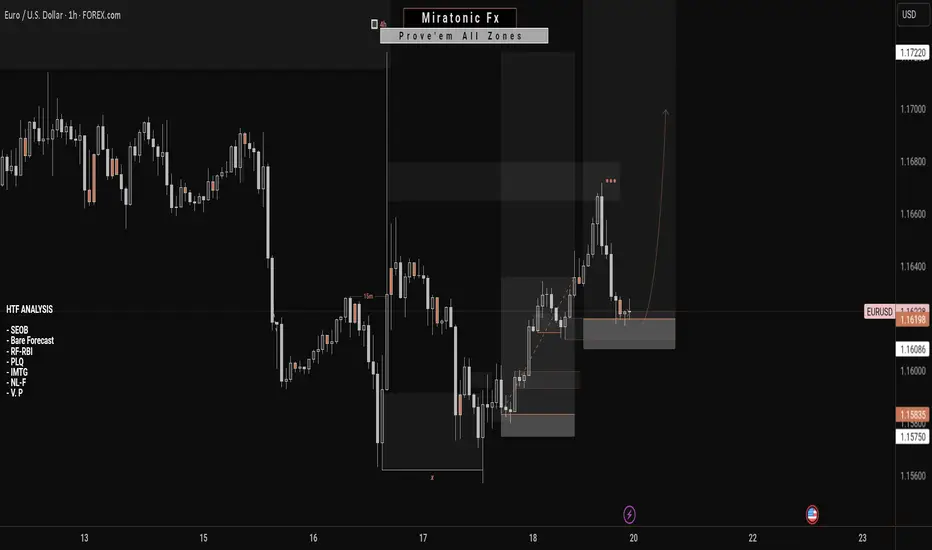
EURUSD Bullish ProjectionIt’s been a while since my last update here.
Here’s my projection and actual entry/entries on EURUSD, based on a sweep of the previous 1H swing low and mitigation of a Daily imbalance (Fair Value Gap).
We're anticipating a full Change of Character to mark the end of the ongoing Daily pullback.
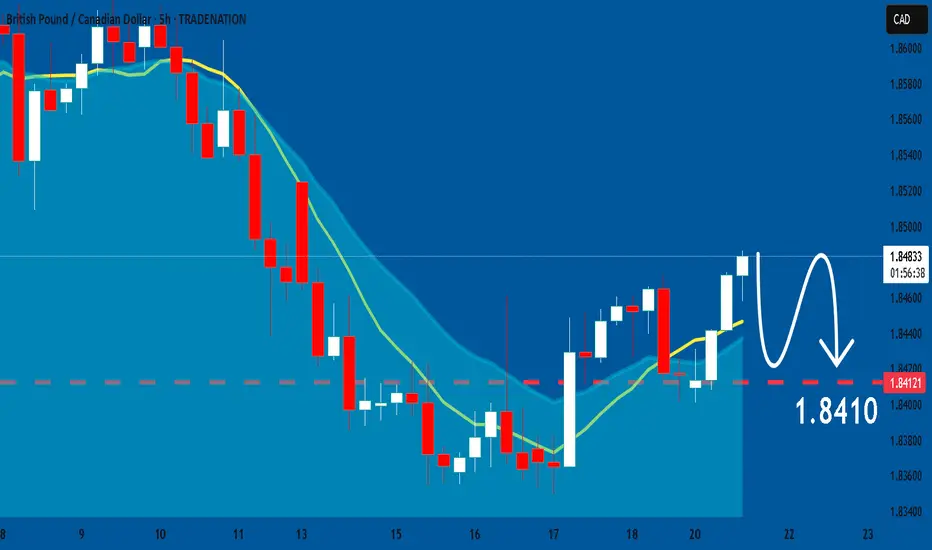
GBPCAD: Will Start Falling! Here is Why:
Remember that we can not, and should not impose our will on the market but rather listen to its whims and make profit by following it. And thus shall be done today on the GBPCAD pair which is likely to be pushed down by the bears so we will sell!
Disclosure: I am part of Trade Nation's Influencer program and receive a monthly fee for using their TradingView charts in my analysis.
❤️ Please, support our work with like & comment! ❤️
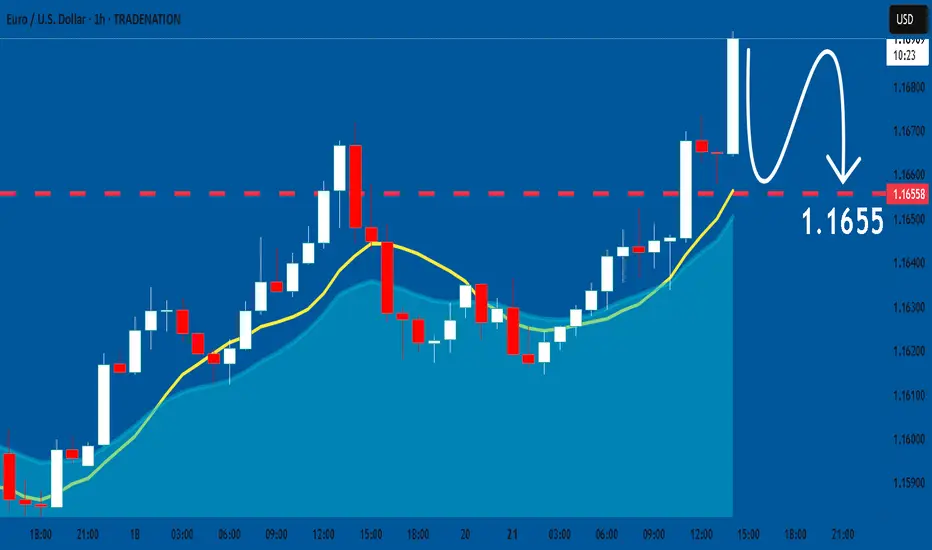
EURUSD: Expecting Bearish Movement! Here is Why:
Balance of buyers and sellers on the EURUSD pair, that is best felt when all the timeframes are analyzed properly is shifting in favor of the sellers, therefore is it only natural that we go short on the pair.
Disclosure: I am part of Trade Nation's Influencer program and receive a monthly fee for using their TradingView charts in my analysis.
❤️ Please, support our work with like & comment! ❤️
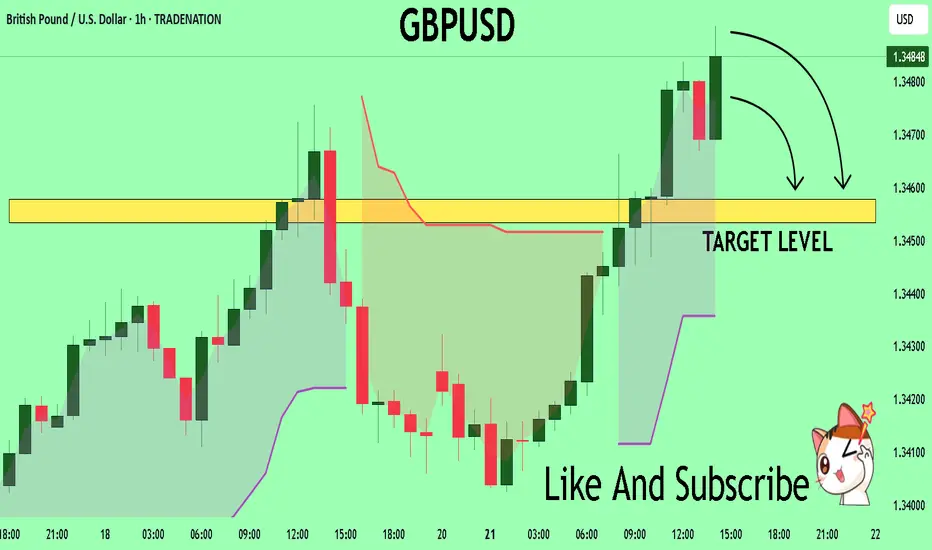
GBPUSD Under Pressure! SELL!
My dear subscribers,
GBPUSD looks like it will make a good move, and here are the details:
The market is trading on 1.3483 pivot level.
Bias - Bearish
Technical Indicators: Both Super Trend & Pivot HL indicate a highly probable Bearish continuation.
Target - 1.3457
About Used Indicators:
The average true range (ATR) plays an important role in 'Supertrend' as the indicator uses ATR to calculate its value. The ATR indicator signals the degree of price volatility.
Disclosure: I am part of Trade Nation's Influencer program and receive a monthly fee for using their TradingView charts in my analysis.
———————————
WISH YOU ALL LUCK
GOLD Technical Analysis! SELL!
My dear subscribers,
This is my opinion on the GOLD next move:
The instrument tests an important psychological level 3387.7
Bias - Bearish
Technical Indicators: Supper Trend gives a precise Bearish signal, while Pivot Point HL predicts price changes and potential reversals in the market.
Target - 3374.3
My Stop Loss - 3394.5
About Used Indicators:
On the subsequent day, trading above the pivot point is thought to indicate ongoing bullish sentiment, while trading below the pivot point indicates bearish sentiment.
Disclosure: I am part of Trade Nation's Influencer program and receive a monthly fee for using their TradingView charts in my analysis.
———————————
WISH YOU ALL LUCK

Euro may correct a little and then continue to rise in channelHello traders, I want share with you my opinion about Euro. Observing the recent price action, we can map out a clear transition in market structure. Previously, the pair was contained within a well-defined downward channel, where the seller zone around the 1.1760 resistance level consistently capped rallies, leading to multiple breakdowns and correctional movements. However, after a final push lower, the dynamic shifted, with the price action showing a clear downtrend-to-uptrend reversal. Currently, the euro has established a new upward channel, finding solid ground in the buyer zone around the 1.1660 support level. The price is now engaged in a constructive upward movement within the boundaries of this new channel. The prevailing hypothesis is that after a potential minor correction towards the channel's support line, the pair will resume its ascent. Therefore, the take-profit target for this scenario, tp 1, is strategically placed at 1.1710, as this level directly corresponds with the resistance line of the current upward channel, representing a logical point for price to react. Please share this idea with your friends and click Boost 🚀
Disclaimer: As part of ThinkMarkets’ Influencer Program, I am sponsored to share and publish their charts in my analysis.

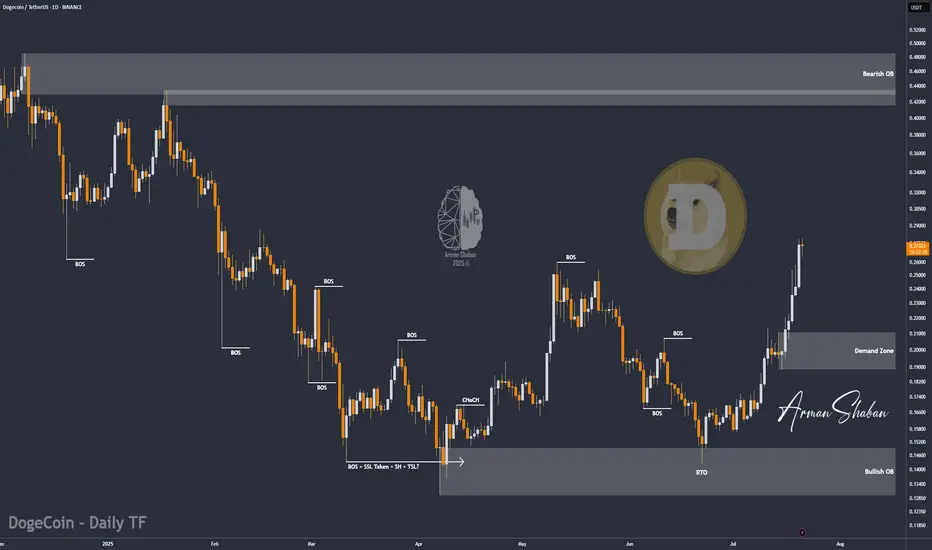
DOGE/USDT : eyes More Gains – Mid-Term Targets Up to $0.70! By analyzing the Dogecoin chart on the daily timeframe, we can see that since our last analysis around 7–8 months ago, the price started its rally from $0.10 and surged over 370% to reach $0.48. After that, it corrected back to around $0.13 and is currently trading near $0.27. If Dogecoin manages to hold above $0.25, we can expect further upside movement in the mid-term. The next targets are $0.287, $0.32, $0.41, and $0.70.
Please support me with your likes and comments to motivate me to share more analysis with you and share your opinion about the possible trend of this chart with me !
Best Regards , Arman Shaban
euraud long tradein my opinion this is a good trade with a good r/r
hope hit the tp
consider this is my trade not your trade and i just like to share my trades with world
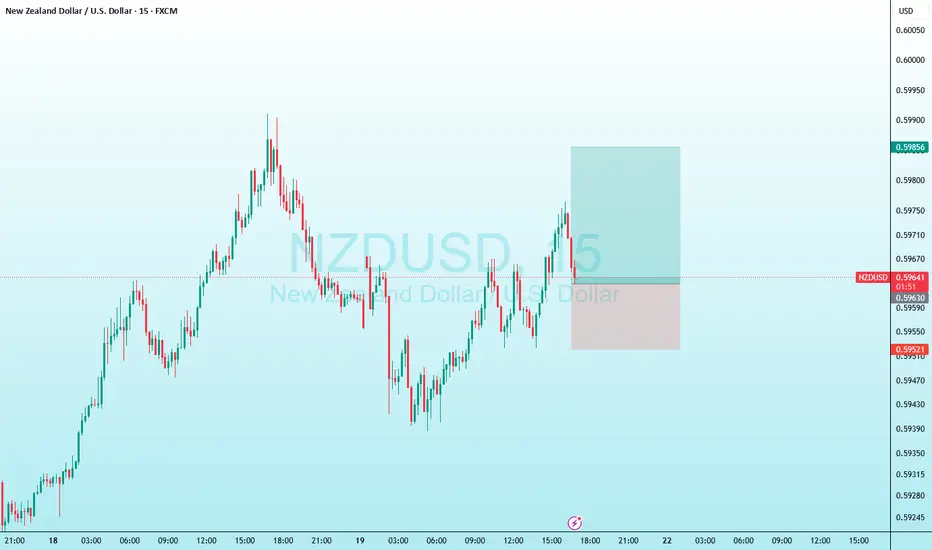
nzdusd long tradein my opinion this is a good trade with a good r/r
hope it will hit the target
consider this is my trade not your trade
i just like to share my trades with world
QUIET START TO THE WEEK, WATCH OUT FOR KEY RESISTANCE!🔔 GOLD PLAN 21/07 – QUIET START TO THE WEEK, WATCH OUT FOR KEY RESISTANCE!
🌍 Market Overview
Gold has bounced back strongly following a brief pullback late last week. The move comes as geopolitical tensions and global conflicts continue to escalate.
While this week may not feature high-impact economic data, macroeconomic risks and global uncertainty remain the primary drivers of price action.
📊 Technical Outlook
Price is currently approaching a strong resistance zone between 3377–3380, which aligns with a Buy Side Liquidity region.
💡 Sellers may step in here to push the price lower, aiming to fill FVG zones (Fair Value Gaps) left behind during the previous bullish rally.
⚠️ Entering SELL positions at this level is risky — only act upon confirmed reversal signals (candlestick rejection or volume-based confirmation).
🎯 Trade Setup
🟢 BUY ZONE: 3331 – 3329
Stop Loss: 3325
Take Profits:
3335 → 3340 → 3344 → 3348 → 3352 → 3358 → 3364 → 3370
🔴 SELL ZONE (confirmation required): 3377 – 3379
Stop Loss: 3383
Take Profits:
3372 → 3368 → 3364 → 3360 → 3350
📌 Key Notes
The 3347 zone acts as short-term support for bulls. If this level breaks, a move toward lower FVG liquidity zones becomes more likely.
Keep an eye on EU session volume for clearer short-term direction and better trade timing.
✅ Final Thoughts
Discipline is key. Stick to your TP/SL strategy to manage risk effectively during early-week volatility.
🛡️ Wishing everyone a successful start to the week. Stay patient, stay focused.
GOD BLESS ALL!

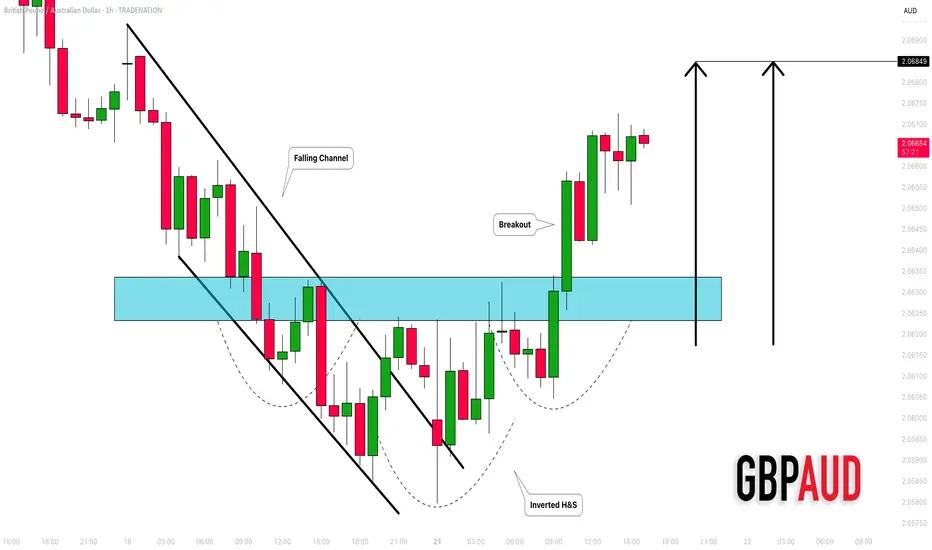
GBPAUD: Bullish Movement Continues 🇬🇧🇦🇺
GBPAUD is going to rise more, following a confirmed intraday bullish reversal:
first, the price violated a resistance line of a falling channel.
It started to consolidate within an inverted head & shoulders pattern then.
Its neckline violation is another strong bullish signal.
Next resistance - 2.0685
❤️Please, support my work with like, thank you!❤️
I am part of Trade Nation's Influencer program and receive a monthly fee for using their TradingView charts in my analysis.
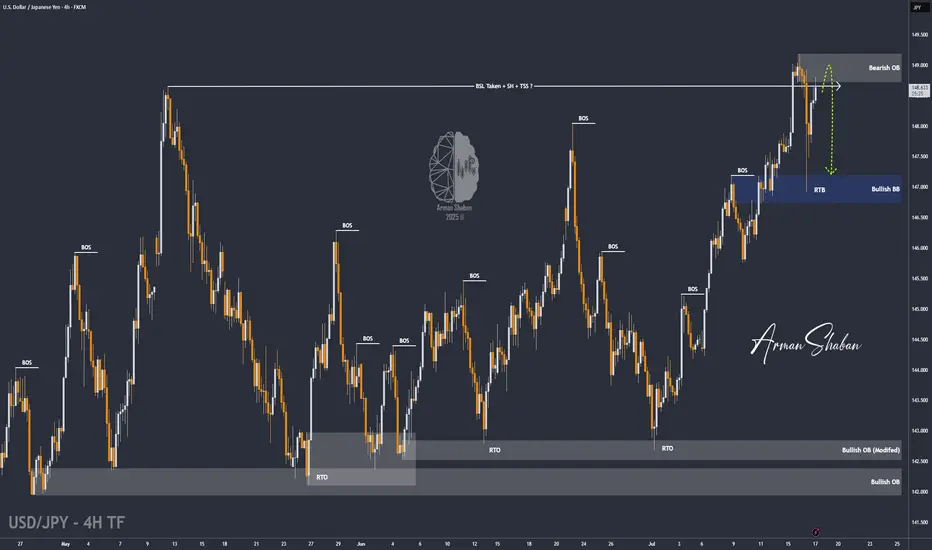
USD/JPY : Get Ready for another Fall ! (READ THE CAPTION)By analyzing the USDJPY chart on the 4-hour timeframe, we can see that after our last daily timeframe analysis, the price started its rally from the 144 zone and, as expected, hit all three targets at 145.5, 147.35, and 148.65, delivering over 500 pips in returns — even reaching as high as 149.2! Once the price broke above 148.65 and swept the liquidity above this level, it faced selling pressure and dropped to 146.9. Currently trading around 148.65, if USDJPY manages to hold below the supply zone between 148.65 and 149.2, we can expect further downside movement. This analysis will be updated with your support!
THE DAILY ANALYSIS :
Please support me with your likes and comments to motivate me to share more analysis with you and share your opinion about the possible trend of this chart with me !
Best Regards , Arman Shaban