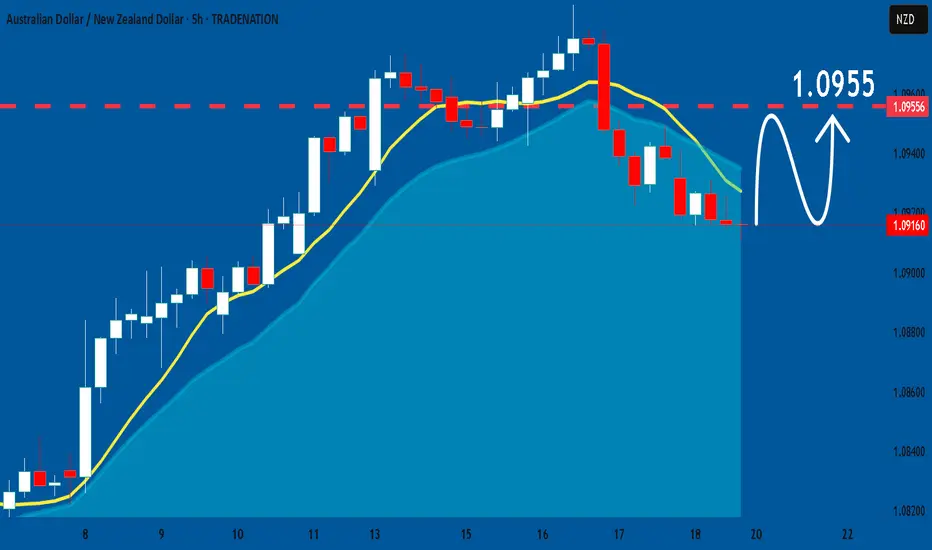
AUDNZD: Growth & Bullish Forecast
The analysis of the AUDNZD chart clearly shows us that the pair is finally about to go up due to the rising pressure from the buyers.
Disclosure: I am part of Trade Nation's Influencer program and receive a monthly fee for using their TradingView charts in my analysis.
❤️ Please, support our work with like & comment! ❤️
Forex
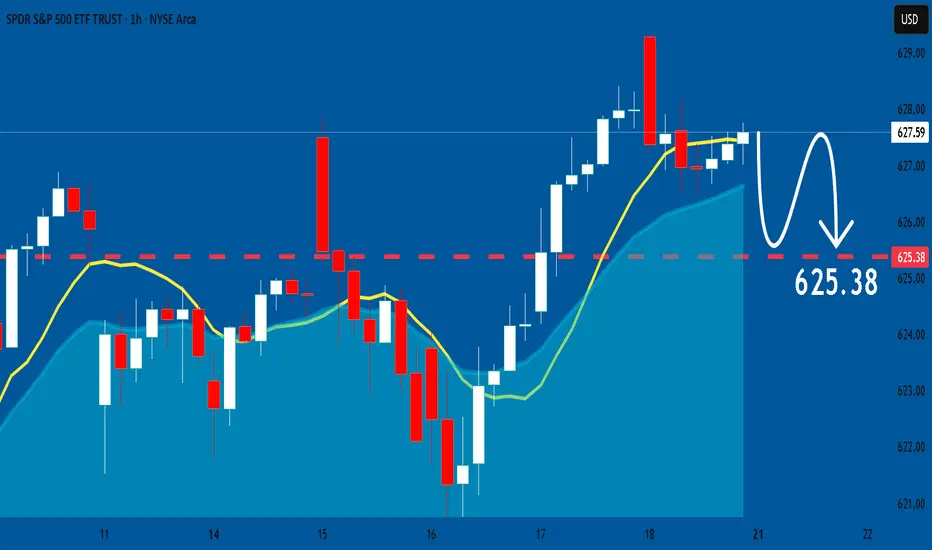
SPY: Market of Sellers
Our strategy, polished by years of trial and error has helped us identify what seems to be a great trading opportunity and we are here to share it with you as the time is ripe for us to sell SPY.
Disclosure: I am part of Trade Nation's Influencer program and receive a monthly fee for using their TradingView charts in my analysis.
❤️ Please, support our work with like & comment! ❤️
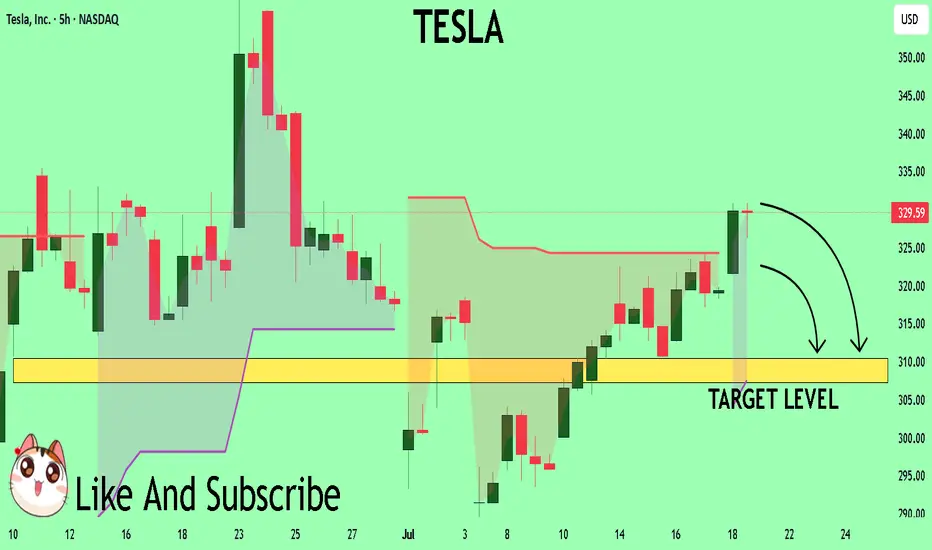
TESLA My Opinion! SELL!
My dear subscribers,
My technical analysis for TESLA is below:
The price is coiling around a solid key level -329.59
Bias - Bearish
Technical Indicators: Pivot Points High anticipates a potential price reversal.
Super trend shows a clear sell, giving a perfect indicators' convergence.
Goal - 310.44
About Used Indicators:
By the very nature of the supertrend indicator, it offers firm support and resistance levels for traders to enter and exit trades. Additionally, it also provides signals for setting stop losses
Disclosure: I am part of Trade Nation's Influencer program and receive a monthly fee for using their TradingView charts in my analysis.
———————————
WISH YOU ALL LUCK
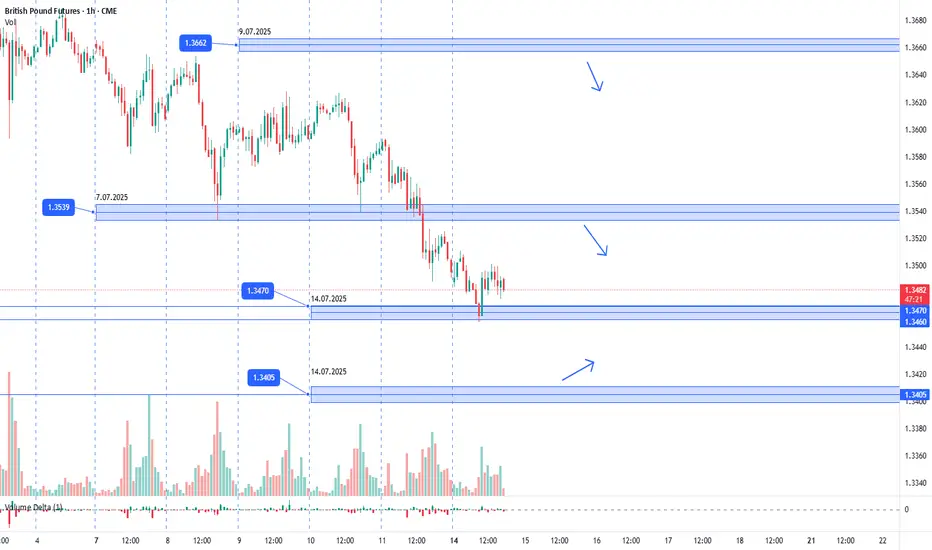
GBPUSD. 14.07.2025. The plan for the next few days.The nearest interesting resistance zone was already worked out in the morning and gave a good reaction. Let's mark the others where we can expect a reaction. It's not certain that there will be a major reversal, but I think we'll see a correction that can be monetized. We're waiting for a reaction and looking for an entry point.
The post will be adjusted based on any changes.
Don't forget to click on the Rocket! =)
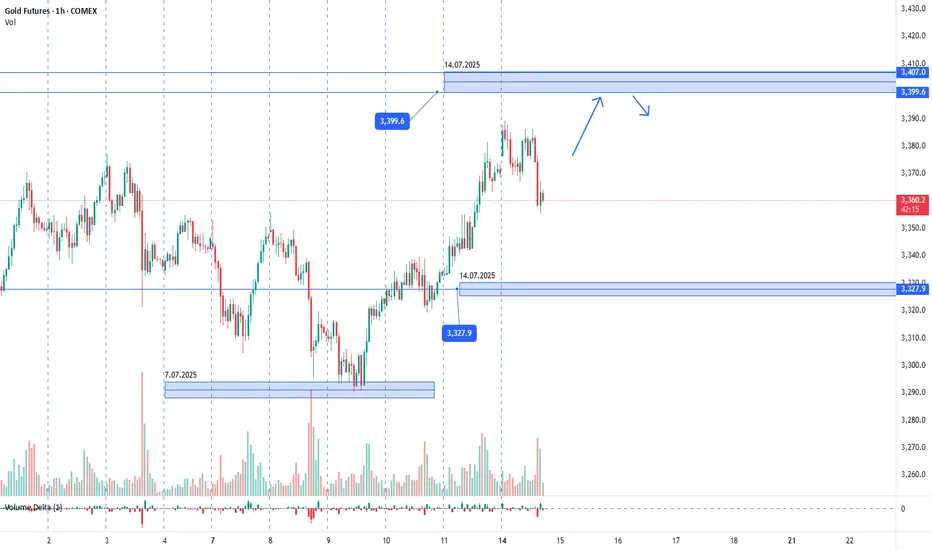
Gold. 14.07.2025. The plan for the next few days.The nearest resistance zones are where it's interesting to look for sales. It's not certain that there will be a big reversal, but I think we'll see a correction. We're waiting for a reaction and looking for an entry point.
The post will be adjusted based on any changes.
Don't forget to click on the Rocket! =)
#013: Long Investment Opportunity on GBP/USD
In this article, I want to share the complete trading logic that led me to place a long order on GBP/USD, applying my proprietary SwipeUP v9.3.1 Elite FX model.
I won't discuss specific levels, but only the logical structure, because the goal is to demonstrate how hedge funds think and why waiting is sometimes more profitable than impulsive entry.
🔍 Phase 1 – Manipulation has already occurred
GBP/USD recently formed a technical double bottom, with a long shadow that chased away the stops placed by the most reactive retail investors. This is a clear signal: the first phase of manipulation is complete.
You don't enter immediately after a shadow: you wait for the market to return to seek residual liquidity, simulating a new decline.
📉 Phase 2 – The expected institutional dump
Before the real movement begins, I expect the price to be pushed lower again. This push serves only to:
trigger the stops of longs who entered too early
raise new liquidity for the banks
test the presence of passive institutional orders near volume supports
This dump will likely be the last countermove before the final reversal.
That's exactly where I placed my order.

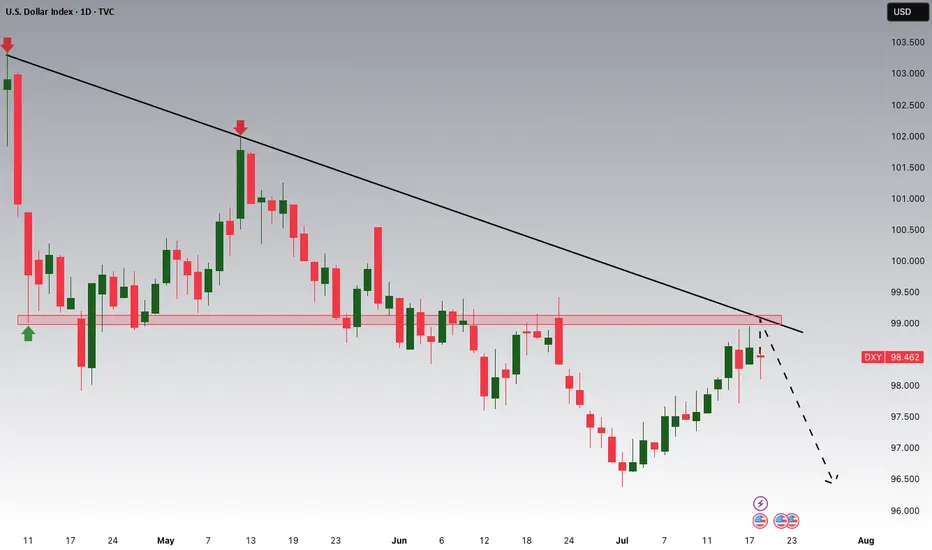
DXY Potential DownsidesHey Traders, in the coming week we are monitoring DXY for a selling opportunity around 99.000 zone, DXY is trading in a downtrend and currently is in a correction phase in which it is approaching the trend at 99.000 support and resistance area.
Trade safe, Joe.
AUDUSD – bullish momentum returns, ready for a breakout?AUDUSD is showing clear strength after rebounding from a key support zone. The bullish structure remains intact with a series of higher lows, and the ascending trendline continues to hold. The recent pullback appears to be a healthy retracement before the market gathers momentum for the next leg up.
On the news front, the pair is supported by strong Australian employment data and expectations that the Federal Reserve will keep interest rates steady. This has slightly weakened the US dollar, giving AUD room to recover.
If buying pressure holds, AUDUSD could break through the overhead resistance and enter a new bullish phase. Now is the time for traders to watch price action closely and wait for a clear confirmation signal!

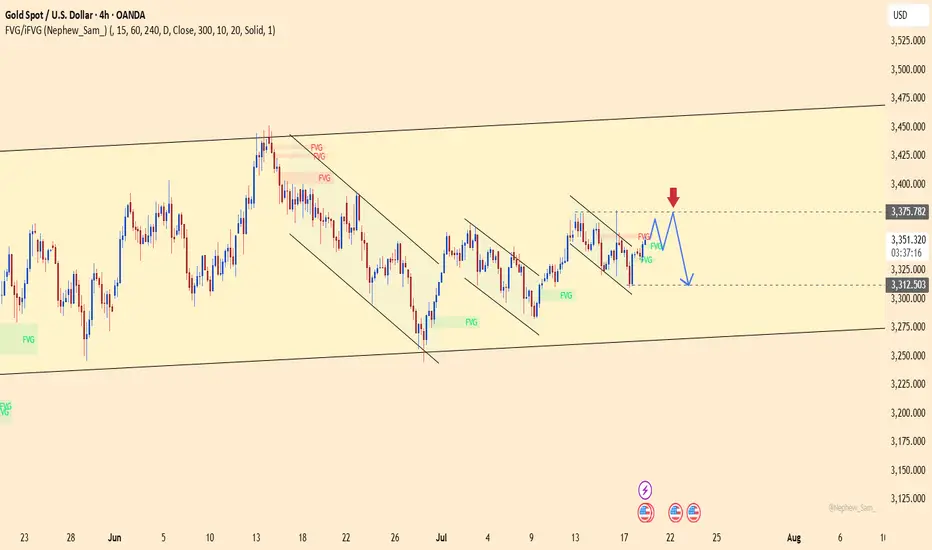
GOLD hits resistance – usd strikes back!XAUUSD is charging into the "danger zone" around 3,375 – a level where bulls have fallen before.
But this time, gold faces a heavyweight opponent:
– The US economy is revving up like a race car: consumer demand is surging, jobless claims are dropping.
– The Fed holds its hawkish stance like a loaded weapon: high interest rates aren’t going away.
– The US dollar is back in full force, and bond yields are shooting sky-high.
While gold buyers try to climb higher, pressure from the “USD fortress” is building fast.
Every uptick in XAUUSD now… might just be a setup before the fall.
If selling pressure returns near the previous highs, another sharp drop in gold could be just around the corner.
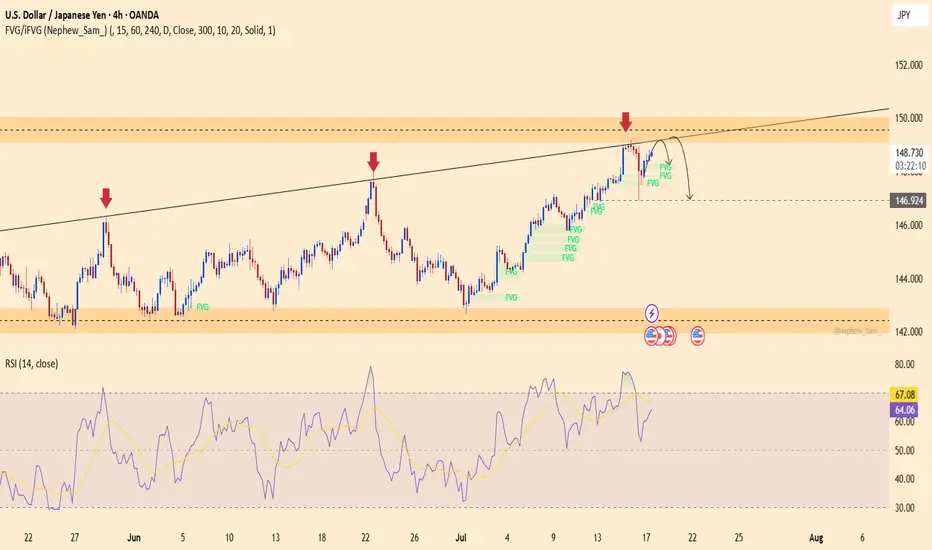
USDJPY – Rejection Pressure Builds, Is a Reversal on the HorizonUSDJPY has been rejected for the third time at the diagonal resistance line, forming a potential lower-high pattern that suggests a reversal could be underway. The RSI is dropping from the overbought zone, clearly indicating weakening bullish momentum. If the price breaks below 146.900, a bearish trend may be confirmed, with a possible move toward the lower support area.
On the news front, U.S. Treasury yields have stalled after a strong rally, and jobless claims have ticked up slightly—dampening expectations for further Fed rate hikes. This puts pressure on the USD while favoring the safe-haven JPY.
Traders should closely monitor the price action around the 149.300 level. Continued rejection could offer a prime shorting opportunity!
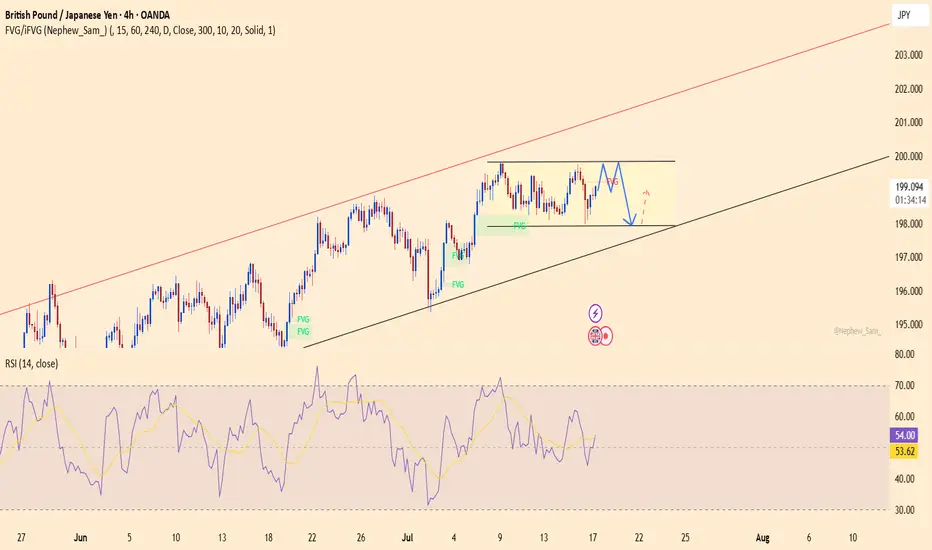
GBPJPY set for breakoutGBPJPY is currently trading in a sideways pattern within an ascending channel. The support zone around 197.900 has been respected multiple times, while price repeatedly fails to break above the 199.800 resistance – signaling that built-up pressure may soon erupt.
Recent data shows that UK inflation remains high, and the Bank of England may maintain its hawkish stance, supporting the GBP. Meanwhile, global risk-off sentiment continues to weaken the JPY.
If price breaks through the current resistance, it would confirm the continuation of the uptrend, with a target toward the upper boundary of the red channel. However, if rejection persists, buying from support remains a valid strategy.
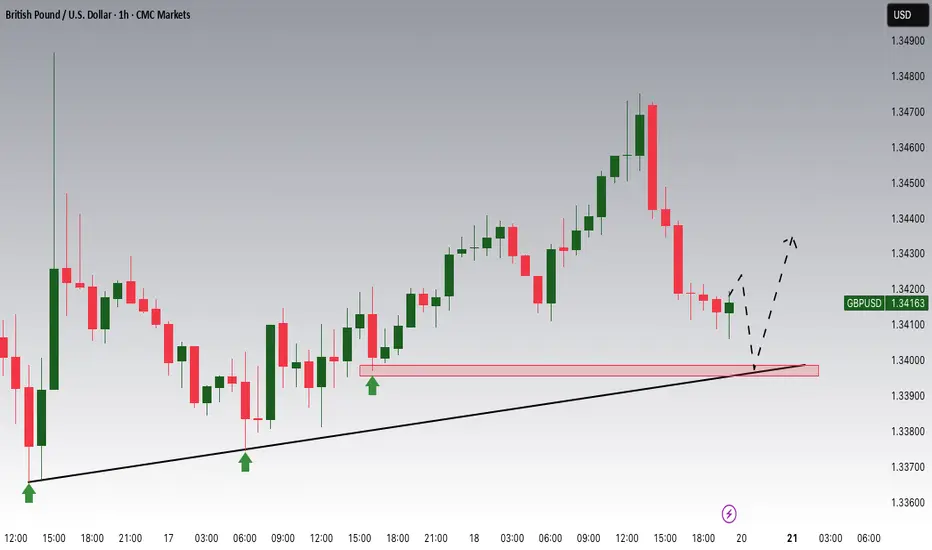
GBPUSD Potential UpsidesHey Traders, in today's trading session we are monitoring GBPUSD for a buying opportunity around 1.33900 zone, GBPUSD is trading in an uptrend and currently is in a correction phase in which it is approaching the trend at 1.33900 support and resistance area.
Trade safe, Joe.
EUR/USD Daily Chart Analysis For Week of July 18, 2025Technical Analysis and Outlook:
In the current trading session, the Euro has continued its decline, completing our Mean Support level of 1.160. Recent analyses indicate that the Euro is likely to experience a sustained downward trend, with an anticipated retest at the Mean Support level of 1.159 and a possible further decline to reach a Currency Dip of 1.152. Nevertheless, it is crucial to consider the potential for a dead-cat bounce toward the Mean Resistance level of 1.167, which could trigger a significant reversal of the downtrend and target a Currency Dip of 1.152.

Psychology Is 80% of Trading SuccessPsychology Is 80% of Trading Success – But Most Traders Still Ignore It
Have you ever followed a perfect setup… and still lost money?
You entered at the right level.
The trend was clear.
Confirmation was solid.
But you closed the trade too early.
Or held onto a losing trade far too long.
Or took a revenge trade just to “get it back.”
This isn’t a strategy problem – it’s a psychological one.
💡 Most traders don’t fail due to poor analysis – they fail because they lose control of themselves
Let’s break down three real-world scenarios that almost every trader has experienced at some point:
🎯 1. Closing profitable trades too early – fear of giving it back
Example:
You long XAUUSD from 2360, targeting 2375.
As price hits 2366, you panic and exit early, fearing a reversal.
Later, the price hits 2375 without you.
➡️ This is classic loss aversion — where the fear of losing small gains outweighs the logic of sticking to your plan.
🎯 2. Holding onto losers – hoping the market will turn
Example:
You short EURUSD expecting a pullback, but price breaks resistance and climbs.
Instead of cutting your losses, you widen your stop and hold on.
The loss grows, and you exit in frustration.
➡️ This is denial – refusing to admit you're wrong, letting hope override discipline.
🎯 3. Increasing risk after a winning streak – “I can’t lose” mindset
Example:
After two wins, confidence spikes. You double your position size, despite a weaker setup.
One loss later – your previous gains are wiped out.
➡️ This is overconfidence bias – common after wins and extremely dangerous to consistency.
📊 Technical knowledge accounts for 20% of success – the remaining 80% lies in mindset and behaviour
You can:
Understand market structure
Use advanced indicators
Develop a robust strategy
But if you:
Ignore your stop-loss
Trade out of boredom or revenge
Break rules when under pressure
Then your edge disappears.
Your system becomes irrelevant if your psychology breaks down.
🧠 5 Practical Ways to Strengthen Your Trading Psychology
✅ Keep a trading journal – especially note your emotions
Ask yourself: “Was this trade part of my plan, or based on impulse?”
✅ Never adjust SL or TP mid-trade
Stick to your original parameters. Trust your plan, not your feelings.
✅ Use demo accounts to practise discipline, not just execution
Treat them like live accounts. Emotions will surface if you're honest.
✅ Pause trading after consecutive losses
Two losses in a row? Step away for 24 hours. Protect your decision-making clarity.
✅ Learn to wait – no trade is often the best trade
Patience is a trader’s secret weapon. Pros trade less, but with precision.
🔁 Trading isn’t about predicting the market – it’s about managing yourself within it
A 55% win-rate system can make you consistent profits
If you’re disciplined, calm, and structured.
But…
A 70% win-rate system can still blow your account
If your emotions are calling the shots.
🎯 Final Thought:
Financial markets don’t reward traders with the best strategy.
They reward those who stay rational under pressure.
You don’t need to be the smartest person in the room.
You don’t need a complex system.
But you do need emotional control, patience, and trust in your process.
Knowledge helps you spot the trade. Psychology helps you survive it.
🔔 If you found value in this, follow me for more content on trading mindset, discipline, and long-term consistency – because true success begins in the mind.

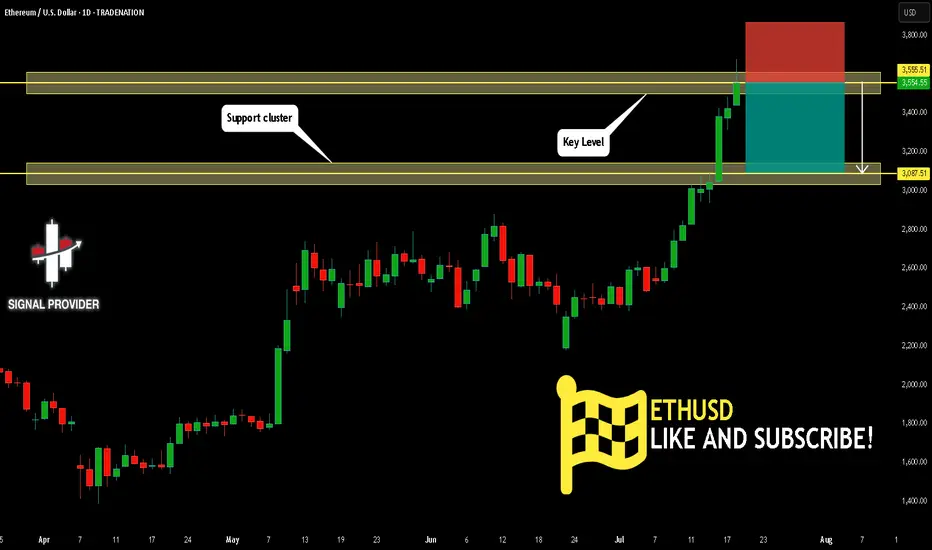
ETHUSD Will Fall! Short!
Take a look at our analysis for ETHUSD.
Time Frame: 1D
Current Trend: Bearish
Sentiment: Overbought (based on 7-period RSI)
Forecast: Bearish
The market is approaching a key horizontal level 3,555.51.
Considering the today's price action, probabilities will be high to see a movement to 3,087.51.
P.S
Please, note that an oversold/overbought condition can last for a long time, and therefore being oversold/overbought doesn't mean a price rally will come soon, or at all.
Disclosure: I am part of Trade Nation's Influencer program and receive a monthly fee for using their TradingView charts in my analysis.
Like and subscribe and comment my ideas if you enjoy them!
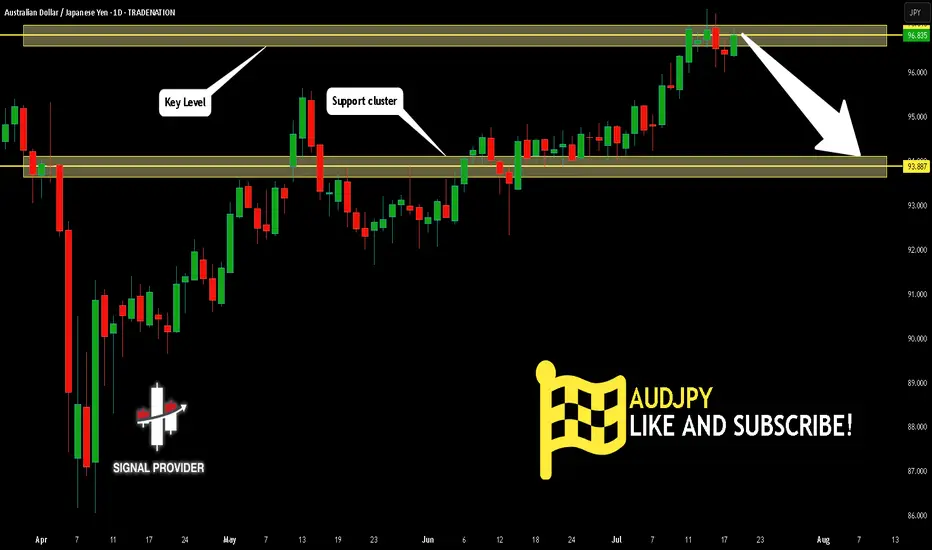
AUDJPY Will Go Lower From Resistance! Sell!
Please, check our technical outlook for AUDJPY.
Time Frame: 1D
Current Trend: Bearish
Sentiment: Overbought (based on 7-period RSI)
Forecast: Bearish
The market is approaching a significant resistance area 96.835.
Due to the fact that we see a positive bearish reaction from the underlined area, I strongly believe that sellers will manage to push the price all the way down to 93.887 level.
P.S
The term oversold refers to a condition where an asset has traded lower in price and has the potential for a price bounce.
Overbought refers to market scenarios where the instrument is traded considerably higher than its fair value. Overvaluation is caused by market sentiments when there is positive news.
Disclosure: I am part of Trade Nation's Influencer program and receive a monthly fee for using their TradingView charts in my analysis.
Like and subscribe and comment my ideas if you enjoy them!
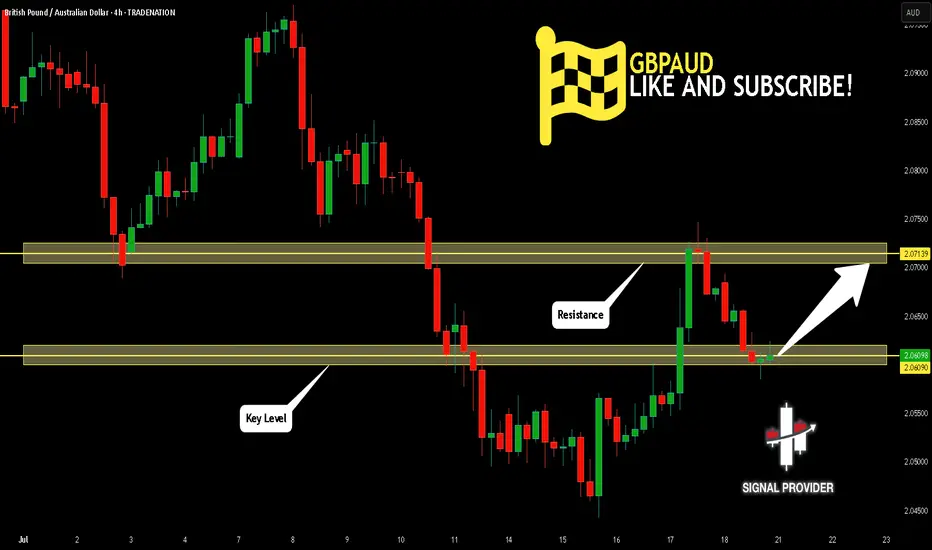
GBPAUD Will Go Up From Support! Long!
Here is our detailed technical review for GBPAUD.
Time Frame: 4h
Current Trend: Bullish
Sentiment: Oversold (based on 7-period RSI)
Forecast: Bullish
The market is on a crucial zone of demand 2.060.
The oversold market condition in a combination with key structure gives us a relatively strong bullish signal with goal 2.071 level.
P.S
We determine oversold/overbought condition with RSI indicator.
When it drops below 30 - the market is considered to be oversold.
When it bounces above 70 - the market is considered to be overbought.
Disclosure: I am part of Trade Nation's Influencer program and receive a monthly fee for using their TradingView charts in my analysis.
Like and subscribe and comment my ideas if you enjoy them!
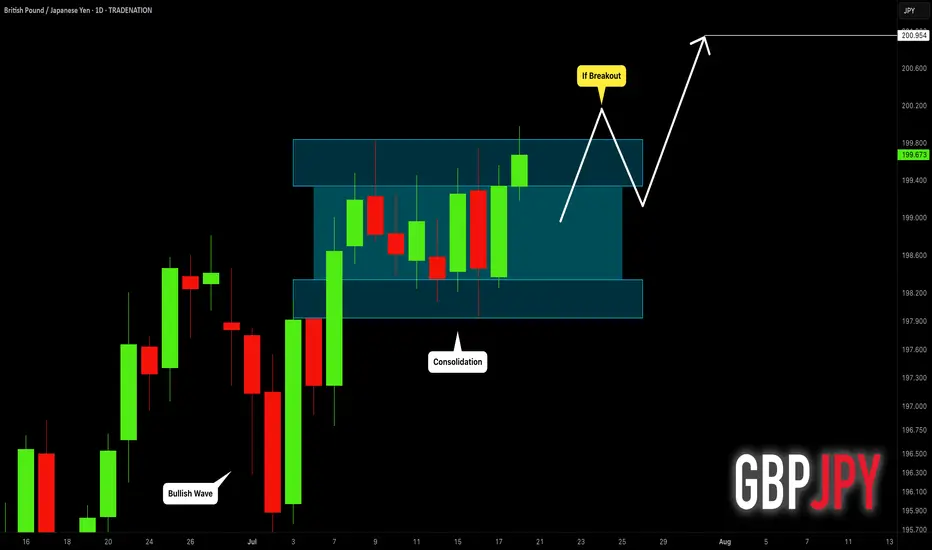
GBPJPY: Get Ready to Buy 🇬🇧🇯🇵
GBPJPY is consolidating within a narrow horizontal range
on a daily time frame.
I am waiting for its bullish breakout and a daily candle close above
199.85 to confirm the next bullish wave.
A rise will be expected to 201 level then.
❤️Please, support my work with like, thank you!❤️
I am part of Trade Nation's Influencer program and receive a monthly fee for using their TradingView charts in my analysis.
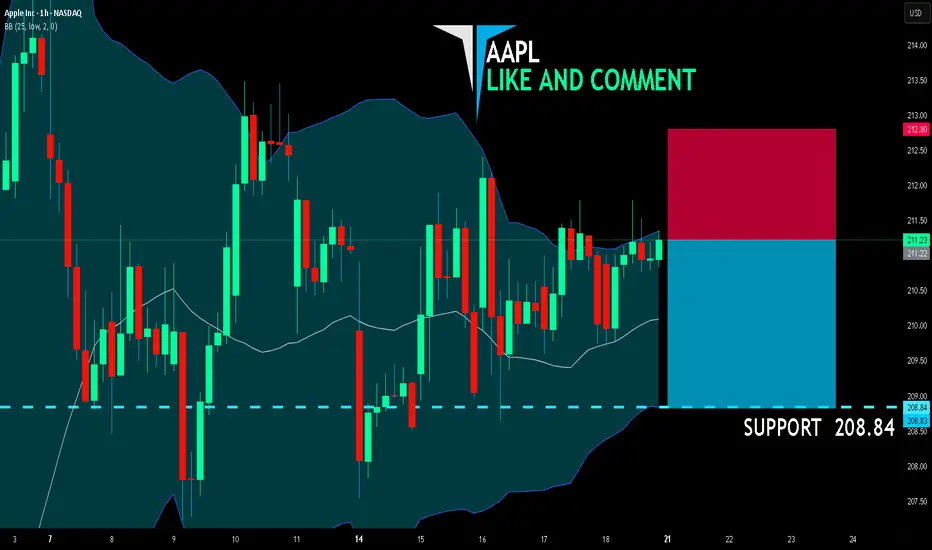
AAPL BEARS WILL DOMINATE THE MARKET|SHORT
AAPL SIGNAL
Trade Direction: short
Entry Level: 211.22
Target Level: 208.84
Stop Loss: 212.80
RISK PROFILE
Risk level: medium
Suggested risk: 1%
Timeframe: 1h
Disclosure: I am part of Trade Nation's Influencer program and receive a monthly fee for using their TradingView charts in my analysis.
✅LIKE AND COMMENT MY IDEAS✅
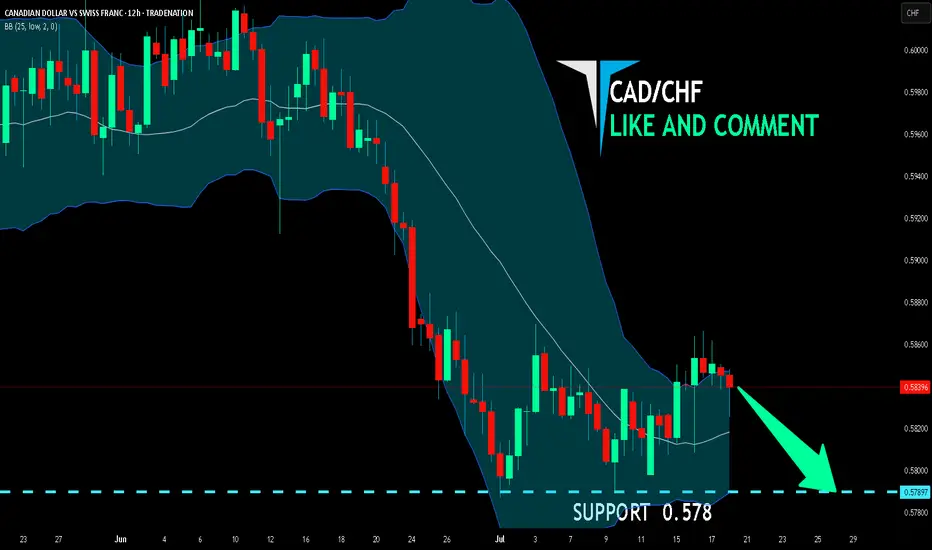
CAD/CHF SENDS CLEAR BEARISH SIGNALS|SHORT
Hello, Friends!
Previous week’s green candle means that for us the CAD/CHF pair is in the uptrend. And the current movement leg was also up but the resistance line will be hit soon and upper BB band proximity will signal an overbought condition so we will go for a counter-trend short trade with the target being at 0.578.
Disclosure: I am part of Trade Nation's Influencer program and receive a monthly fee for using their TradingView charts in my analysis.
✅LIKE AND COMMENT MY IDEAS✅
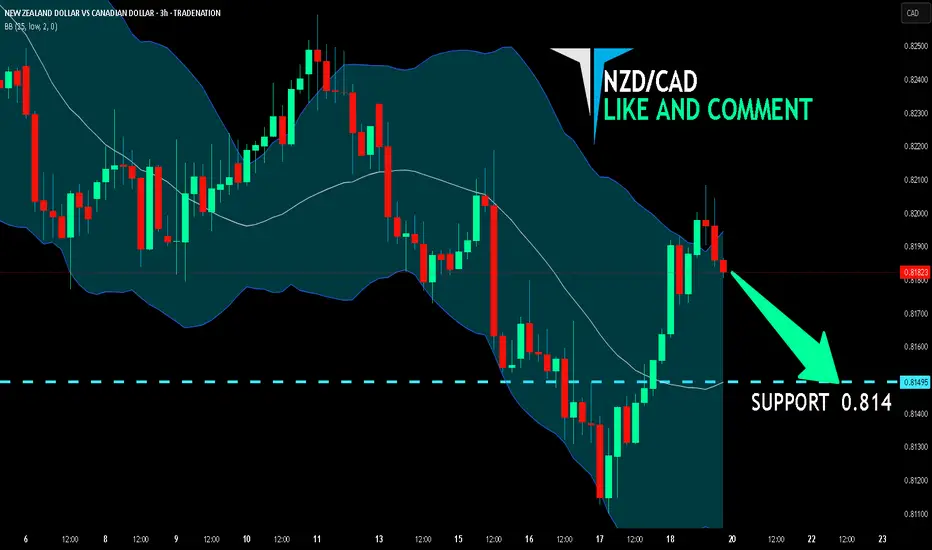
NZD/CAD BEARS ARE GAINING STRENGTH|SHORT
Hello, Friends!
NZD/CAD is trending down which is obvious from the red colour of the previous weekly candle. However, the price has locally surged into the overbought territory. Which can be told from its proximity to the BB upper band. Which presents a great trend following opportunity for a short trade from the resistance line above towards the demand level of 0.814.
Disclosure: I am part of Trade Nation's Influencer program and receive a monthly fee for using their TradingView charts in my analysis.
✅LIKE AND COMMENT MY IDEAS✅
18/07 Gold Outlook Market Tensions Mount Liquidity Zones in Play Gold Outlook – Market Tensions Mount, Liquidity Zones in Play
Price action heats up as we enter the final trading day of the week. Are you ready to ride the wave or get caught in the liquidity sweep?
🔍 Market Sentiment & Global Highlights
Gold rebounded strongly after dropping on better-than-expected US data. However, several macro risks are keeping gold buyers in the game:
Buy-the-dip activity emerged amid concerns that Trump’s tariff policies may fuel inflation.
Rate cut expectations remain strong as US core inflation shows no signs of cooling.
Geopolitical risks intensified as Israel conducted fresh airstrikes on Syria.
EU threatens $84B in tariffs on US goods should trade talks break down.
💡 These tensions are giving gold strong support — especially as traders prepare for potential volatility into the weekend.
📈 Technical Overview – Liquidity Zones at Play
Yesterday's bounce from FLZ H2 (3310) — a critical demand and liquidity zone — triggered a clean reversal. Sellers took profit, volume shifted, and buyers regained control. Price has since pushed up to retest the OBS SELL ZONE + CP Pattern near the 334x area with a sharp reaction.
For today, price is likely to revisit lower liquidity pockets (M30–H2) before making the next directional move.
🔑 Key Levels to Watch
🟢 BUY ZONE: 3318 – 3316
Stop Loss: 3312
Take Profits: 3322 – 3326 – 3330 – 3335 – 3340 – 3345 – 3350 – 3360+
⚡ BUY SCALP ZONE: 3326 – 3324
Stop Loss: 3320
Take Profits: 3330 – 3335 – 3340 – 3345 – 3350 – 3360
🔴 SELL ZONE: 3363 – 3365
Stop Loss: 3370
Take Profits: 3360 – 3355 – 3350 – 3346 – 3342 – 3338 – 3335 – 3330
⚠️ Final Notes
Today’s session has no major news releases, but as it’s the end of the week, we may see liquidity grabs and unexpected volatility. Stay disciplined, stick to your plan, and always respect TP/SL.
🔔 Follow the key zones carefully – volatility loves indecision.

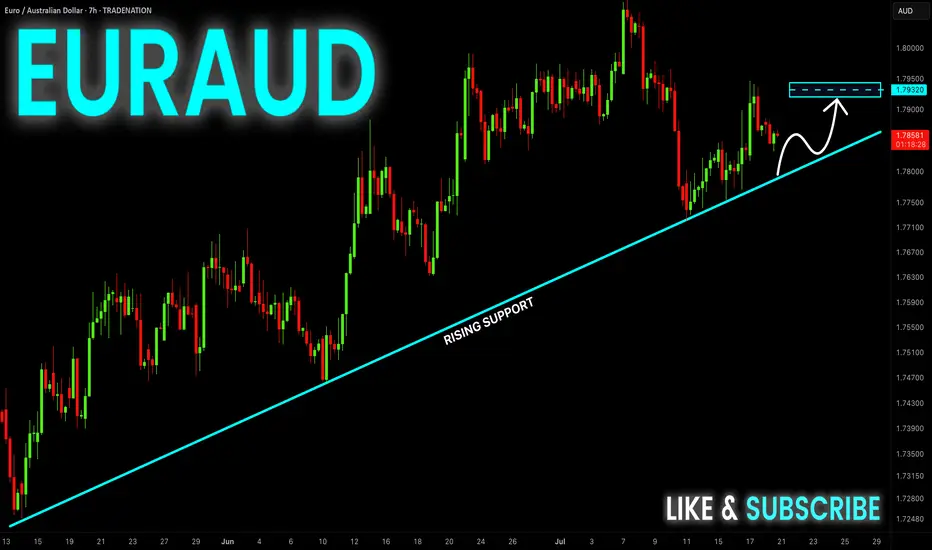
EUR-AUD Strong Uptrend! Buy!
Hello, Traders!
EUR-AUD is trading along
The rising support line in a
Strong uptrend so we we are
Bullish biased and as the pair
Is going down to retest the
Support we will be expecting
A rebound and a move up
Buy!
Comment and subscribe to help us grow!
Check out other forecasts below too!
Disclosure: I am part of Trade Nation's Influencer program and receive a monthly fee for using their TradingView charts in my analysis.