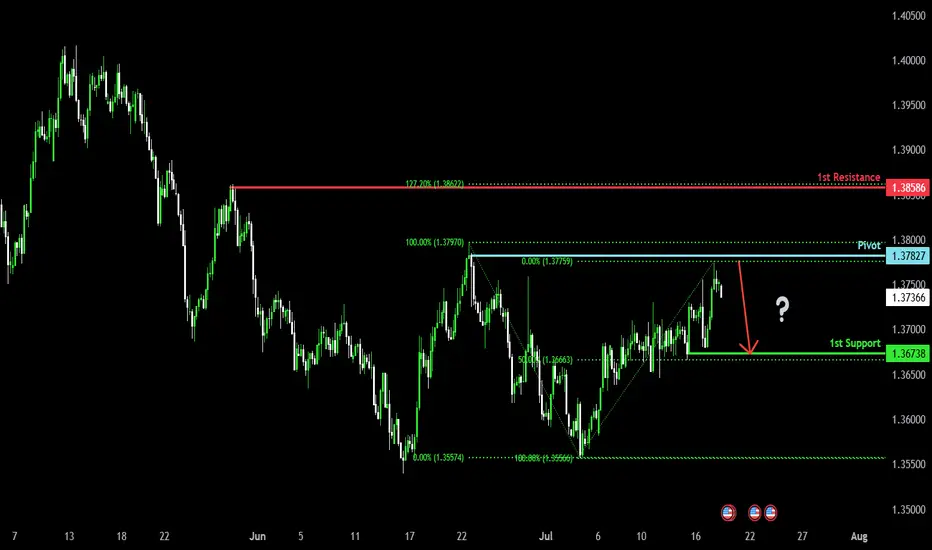
Heading into pullback resistance?The Loonie (USD/CAD) has rejected off the pivot which acts as a pullback resistance and could reverse to the pullback support that aligns with the 50% Fibonacci retracement.
Pivot: 1.3782
1st Support: 1.3673
1st Resistance: 1.3858
Risk Warning:
Trading Forex and CFDs carries a high level of risk to your capital and you should only trade with money you can afford to lose. Trading Forex and CFDs may not be suitable for all investors, so please ensure that you fully understand the risks involved and seek independent advice if necessary.
Disclaimer:
The above opinions given constitute general market commentary, and do not constitute the opinion or advice of IC Markets or any form of personal or investment advice.
Any opinions, news, research, analyses, prices, other information, or links to third-party sites contained on this website are provided on an "as-is" basis, are intended only to be informative, is not an advice nor a recommendation, nor research, or a record of our trading prices, or an offer of, or solicitation for a transaction in any financial instrument and thus should not be treated as such. The information provided does not involve any specific investment objectives, financial situation and needs of any specific person who may receive it. Please be aware, that past performance is not a reliable indicator of future performance and/or results. Past Performance or Forward-looking scenarios based upon the reasonable beliefs of the third-party provider are not a guarantee of future performance. Actual results may differ materially from those anticipated in forward-looking or past performance statements. IC Markets makes no representation or warranty and assumes no liability as to the accuracy or completeness of the information provided, nor any loss arising from any investment based on a recommendation, forecast or any information supplied by any third-party.
Forex
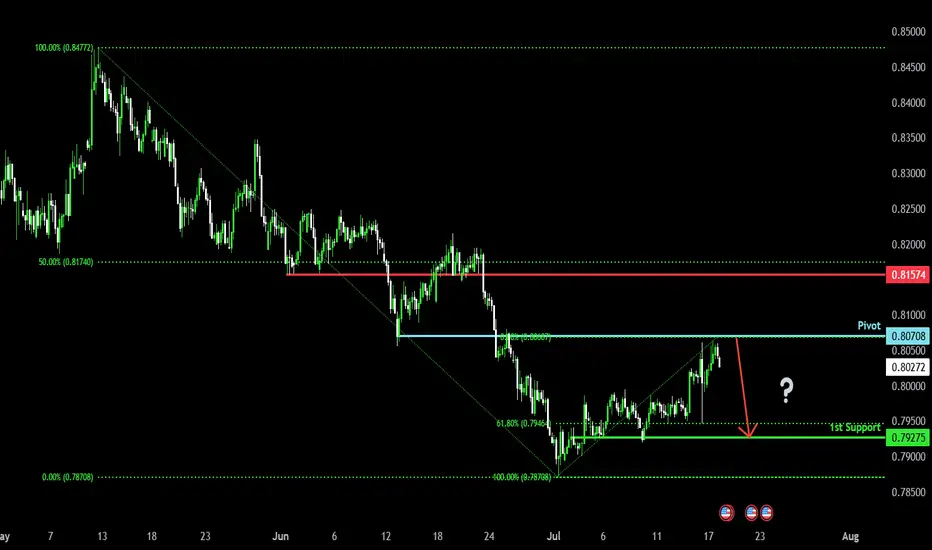
Bearish reversal off pullback resistance?The Swissie (USD/CHF) has rejected off the pivot and could drop to the 1st support which is a pullback support that is slightly below the 61.8% Fibonacci retracement.
Pivot: 0.8070
1st Support: 0.7927
1st Resistance: 0.8157
Risk Warning:
Trading Forex and CFDs carries a high level of risk to your capital and you should only trade with money you can afford to lose. Trading Forex and CFDs may not be suitable for all investors, so please ensure that you fully understand the risks involved and seek independent advice if necessary.
Disclaimer:
The above opinions given constitute general market commentary, and do not constitute the opinion or advice of IC Markets or any form of personal or investment advice.
Any opinions, news, research, analyses, prices, other information, or links to third-party sites contained on this website are provided on an "as-is" basis, are intended only to be informative, is not an advice nor a recommendation, nor research, or a record of our trading prices, or an offer of, or solicitation for a transaction in any financial instrument and thus should not be treated as such. The information provided does not involve any specific investment objectives, financial situation and needs of any specific person who may receive it. Please be aware, that past performance is not a reliable indicator of future performance and/or results. Past Performance or Forward-looking scenarios based upon the reasonable beliefs of the third-party provider are not a guarantee of future performance. Actual results may differ materially from those anticipated in forward-looking or past performance statements. IC Markets makes no representation or warranty and assumes no liability as to the accuracy or completeness of the information provided, nor any loss arising from any investment based on a recommendation, forecast or any information supplied by any third-party.
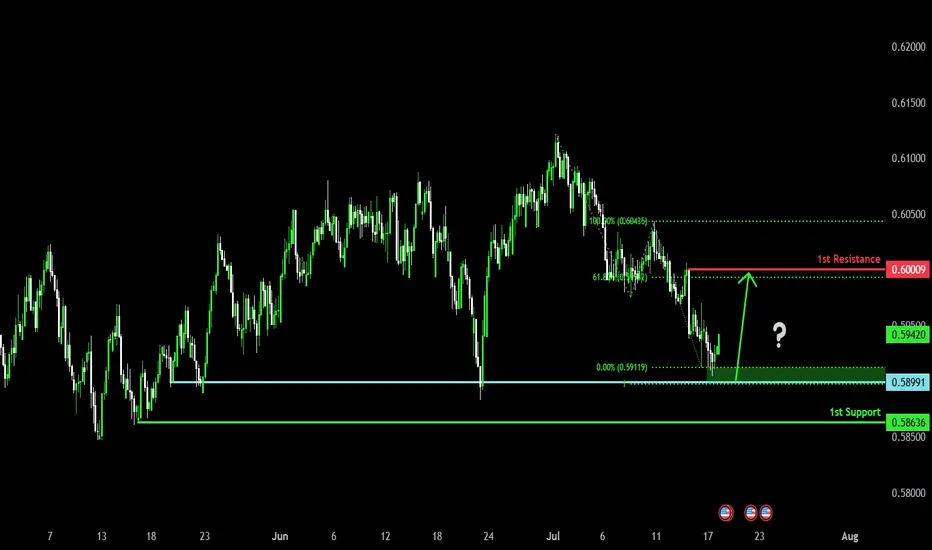
Bullish bounce for the Kiwi?The price has bounced off the pivot which acts as a pullback support and could rise to the 61.8% Fibonacci resistance.
Pivot: 0.5899
1st Support: 0.5863
1st Resistance: 0.6000
Risk Warning:
Trading Forex and CFDs carries a high level of risk to your capital and you should only trade with money you can afford to lose. Trading Forex and CFDs may not be suitable for all investors, so please ensure that you fully understand the risks involved and seek independent advice if necessary.
Disclaimer:
The above opinions given constitute general market commentary, and do not constitute the opinion or advice of IC Markets or any form of personal or investment advice.
Any opinions, news, research, analyses, prices, other information, or links to third-party sites contained on this website are provided on an "as-is" basis, are intended only to be informative, is not an advice nor a recommendation, nor research, or a record of our trading prices, or an offer of, or solicitation for a transaction in any financial instrument and thus should not be treated as such. The information provided does not involve any specific investment objectives, financial situation and needs of any specific person who may receive it. Please be aware, that past performance is not a reliable indicator of future performance and/or results. Past Performance or Forward-looking scenarios based upon the reasonable beliefs of the third-party provider are not a guarantee of future performance. Actual results may differ materially from those anticipated in forward-looking or past performance statements. IC Markets makes no representation or warranty and assumes no liability as to the accuracy or completeness of the information provided, nor any loss arising from any investment based on a recommendation, forecast or any information supplied by any third-party.
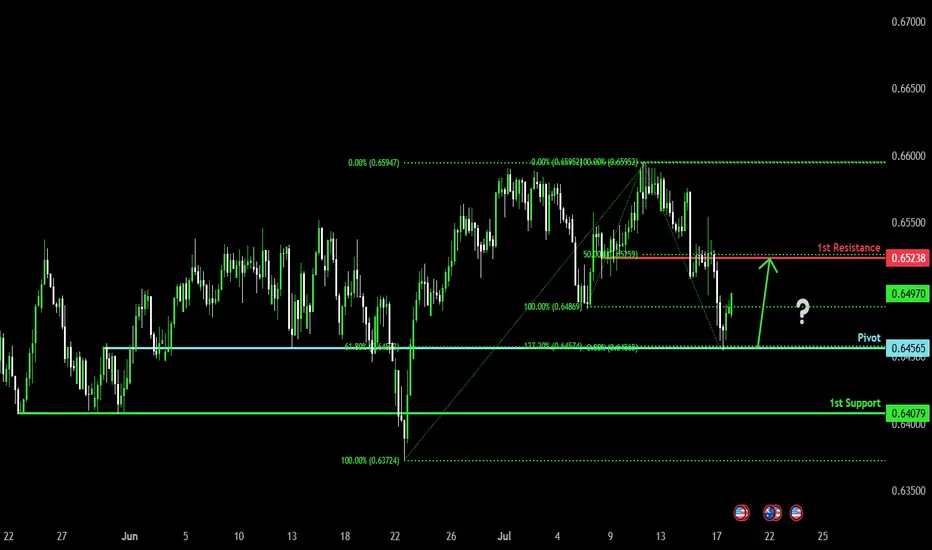
Bullish bounce?The Aussie (AUD/USD) has bounced off the pivot and could rise to the 1st resistance.
Pivot: 0.6456
1st Support: 0.6407
1st Resistance: 0.6523
Risk Warning:
Trading Forex and CFDs carries a high level of risk to your capital and you should only trade with money you can afford to lose. Trading Forex and CFDs may not be suitable for all investors, so please ensure that you fully understand the risks involved and seek independent advice if necessary.
Disclaimer:
The above opinions given constitute general market commentary, and do not constitute the opinion or advice of IC Markets or any form of personal or investment advice.
Any opinions, news, research, analyses, prices, other information, or links to third-party sites contained on this website are provided on an "as-is" basis, are intended only to be informative, is not an advice nor a recommendation, nor research, or a record of our trading prices, or an offer of, or solicitation for a transaction in any financial instrument and thus should not be treated as such. The information provided does not involve any specific investment objectives, financial situation and needs of any specific person who may receive it. Please be aware, that past performance is not a reliable indicator of future performance and/or results. Past Performance or Forward-looking scenarios based upon the reasonable beliefs of the third-party provider are not a guarantee of future performance. Actual results may differ materially from those anticipated in forward-looking or past performance statements. IC Markets makes no representation or warranty and assumes no liability as to the accuracy or completeness of the information provided, nor any loss arising from any investment based on a recommendation, forecast or any information supplied by any third-party.
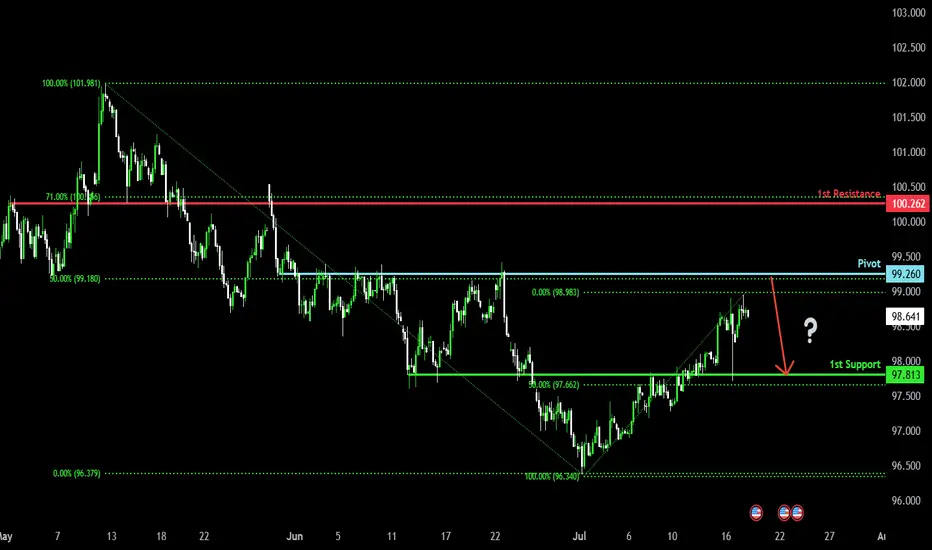
Bearish reversal?US Dollar Index (DXY) is rising towards the pivot and could reverse to the 1st support which acts as an overlap support.
Pivot: 99.26
1st Support: 97.81
1st Resistance: 100.26
Risk Warning:
Trading Forex and CFDs carries a high level of risk to your capital and you should only trade with money you can afford to lose. Trading Forex and CFDs may not be suitable for all investors, so please ensure that you fully understand the risks involved and seek independent advice if necessary.
Disclaimer:
The above opinions given constitute general market commentary, and do not constitute the opinion or advice of IC Markets or any form of personal or investment advice.
Any opinions, news, research, analyses, prices, other information, or links to third-party sites contained on this website are provided on an "as-is" basis, are intended only to be informative, is not an advice nor a recommendation, nor research, or a record of our trading prices, or an offer of, or solicitation for a transaction in any financial instrument and thus should not be treated as such. The information provided does not involve any specific investment objectives, financial situation and needs of any specific person who may receive it. Please be aware, that past performance is not a reliable indicator of future performance and/or results. Past Performance or Forward-looking scenarios based upon the reasonable beliefs of the third-party provider are not a guarantee of future performance. Actual results may differ materially from those anticipated in forward-looking or past performance statements. IC Markets makes no representation or warranty and assumes no liability as to the accuracy or completeness of the information provided, nor any loss arising from any investment based on a recommendation, forecast or any information supplied by any third-party.
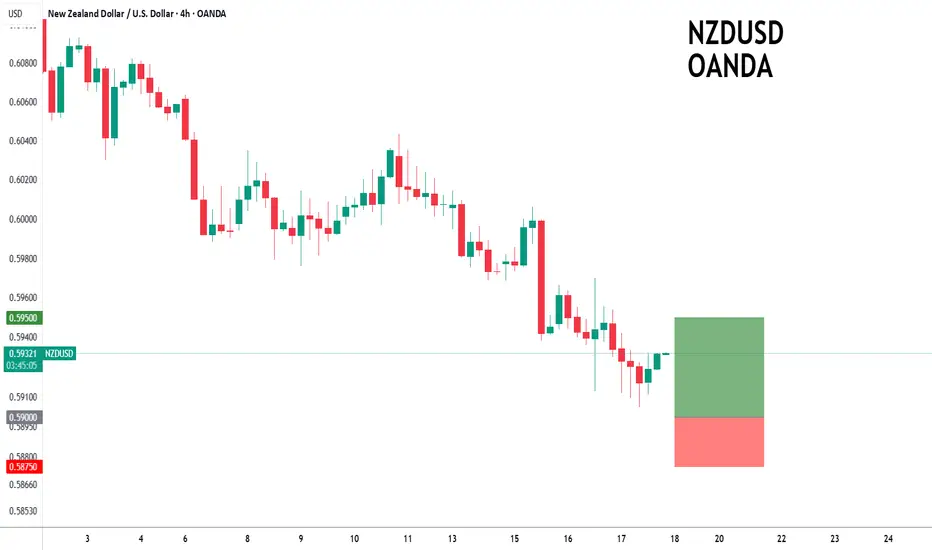
NZDUSD to turnaround?NZDUSD - 24h expiry
The correction lower is assessed as being complete.
We expect a reversal in this move.
Risk/Reward would be poor to call a buy from current levels.
A move through 0.5925 will confirm the bullish momentum.
The measured move target is 0.5975.
We look to Buy at 0.5900 (stop at 0.5875)
Our profit targets will be 0.5950 and 0.5975
Resistance: 0.5925 / 0.5950 / 0.5975
Support: 0.5900 / 0.5875 / 0.5850
Risk Disclaimer
The trade ideas beyond this page are for informational purposes only and do not constitute investment advice or a solicitation to trade. This information is provided by Signal Centre, a third-party unaffiliated with OANDA, and is intended for general circulation only. OANDA does not guarantee the accuracy of this information and assumes no responsibilities for the information provided by the third party. The information does not take into account the specific investment objectives, financial situation, or particular needs of any particular person. You should take into account your specific investment objectives, financial situation, and particular needs before making a commitment to trade, including seeking advice from an independent financial adviser regarding the suitability of the investment, under a separate engagement, as you deem fit.
You accept that you assume all risks in independently viewing the contents and selecting a chosen strategy.
Where the research is distributed in Singapore to a person who is not an Accredited Investor, Expert Investor or an Institutional Investor, Oanda Asia Pacific Pte Ltd (“OAP“) accepts legal responsibility for the contents of the report to such persons only to the extent required by law. Singapore customers should contact OAP at 6579 8289 for matters arising from, or in connection with, the information/research distributed.
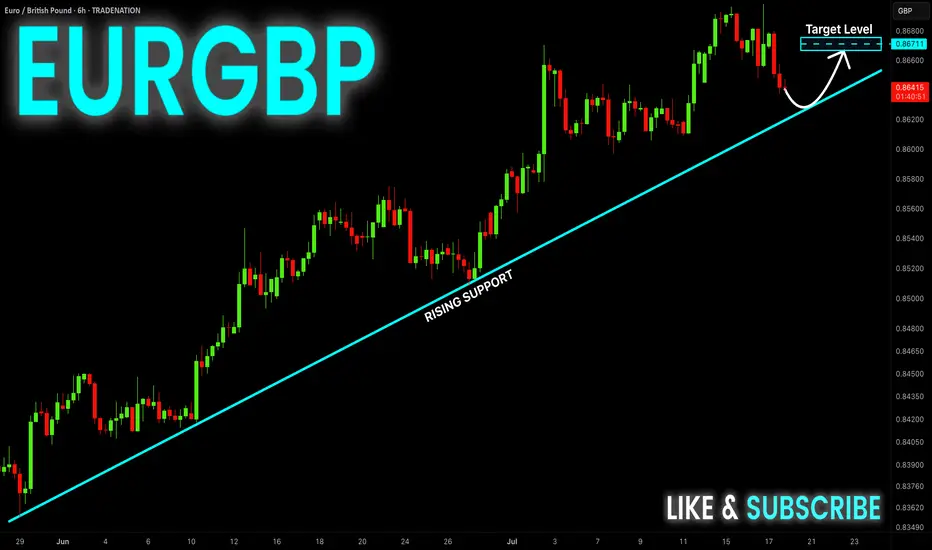
EUR-GBP Long From Rising Support! Buy!
Hello,Traders!
EUR-GBP is trading in an
Uptrend along the rising
Support line and the pair
Is going down now so after
The retest we will be
Expecting a bullish rebound
And a move up
Buy!
Comment and subscribe to help us grow!
Check out other forecasts below too!
Disclosure: I am part of Trade Nation's Influencer program and receive a monthly fee for using their TradingView charts in my analysis.

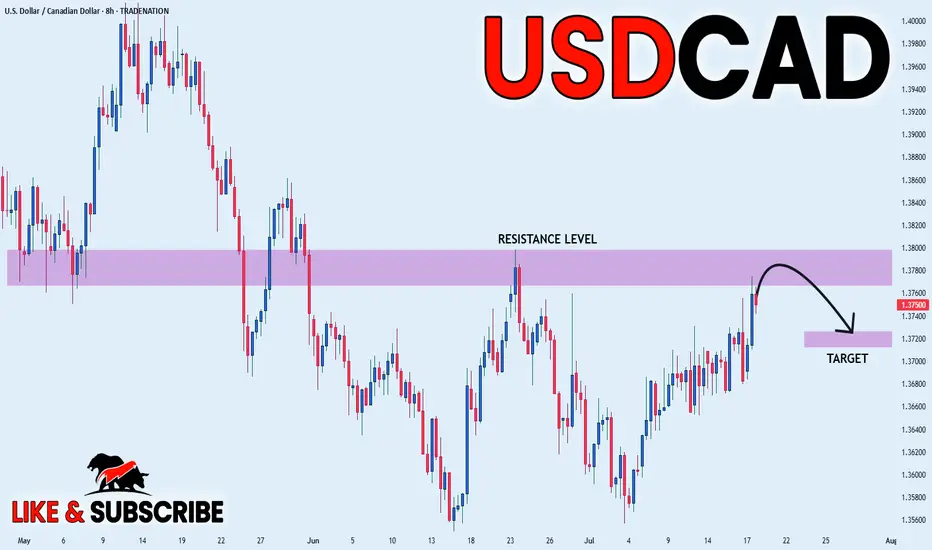
USD_CAD LOCAL SHORT|
✅USD_CAD is going up now
But a strong resistance level is ahead at 1.3800
Thus I am expecting a pullback
And a move down towards the target of 1.3720
SHORT🔥
✅Like and subscribe to never miss a new idea!✅
Disclosure: I am part of Trade Nation's Influencer program and receive a monthly fee for using their TradingView charts in my analysis.
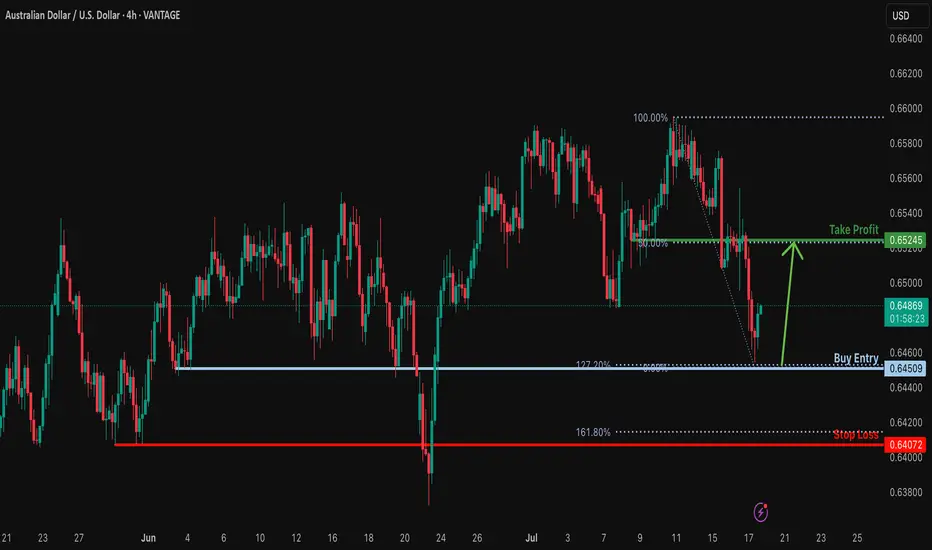
Bullish bounce off for the Aussie?The price has bounced off the support level which is a pullback support that aligns with the 127.2% Fibonacci extension and could potentially rise from this level to our take profit.
Entry: 0.6450
Why we like it:
There is a pullback support that aligns with the 127.2% Fibonacci extension.
Stop loss: 0.6407
Why we lik eit:
There is a pullback support that is slightly below the 161.8% Fibonacci extension.
Take profit: 0.6524
Why we like it:
There is an overlap resistance that lines up with the 50% Fibonacci retracement.
Enjoying your TradingView experience? Review us!
Please be advised that the information presented on TradingView is provided to Vantage (‘Vantage Global Limited’, ‘we’) by a third-party provider (‘Everest Fortune Group’). Please be reminded that you are solely responsible for the trading decisions on your account. There is a very high degree of risk involved in trading. Any information and/or content is intended entirely for research, educational and informational purposes only and does not constitute investment or consultation advice or investment strategy. The information is not tailored to the investment needs of any specific person and therefore does not involve a consideration of any of the investment objectives, financial situation or needs of any viewer that may receive it. Kindly also note that past performance is not a reliable indicator of future results. Actual results may differ materially from those anticipated in forward-looking or past performance statements. We assume no liability as to the accuracy or completeness of any of the information and/or content provided herein and the Company cannot be held responsible for any omission, mistake nor for any loss or damage including without limitation to any loss of profit which may arise from reliance on any information supplied by Everest Fortune Group.
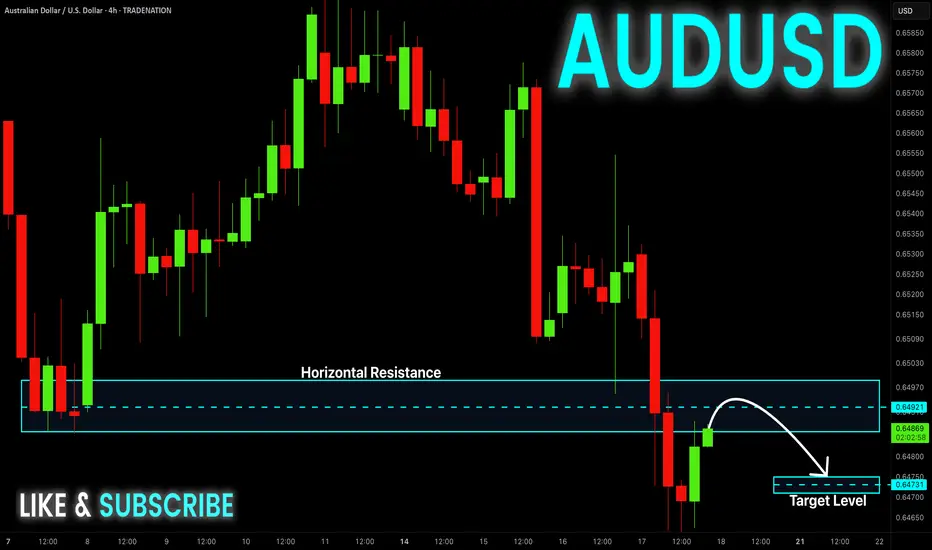
AUD-USD Local Short! Sell!
Hello,Traders!
AUD-JPY is making a bullish
Rebound and the pair is
Making a retest of the key
Horizontal resistance of 0.6497
From where we will be
Expecting a local bearish correction
Sell!
Comment and subscribe to help us grow!
Check out other forecasts below too!
Disclosure: I am part of Trade Nation's Influencer program and receive a monthly fee for using their TradingView charts in my analysis.
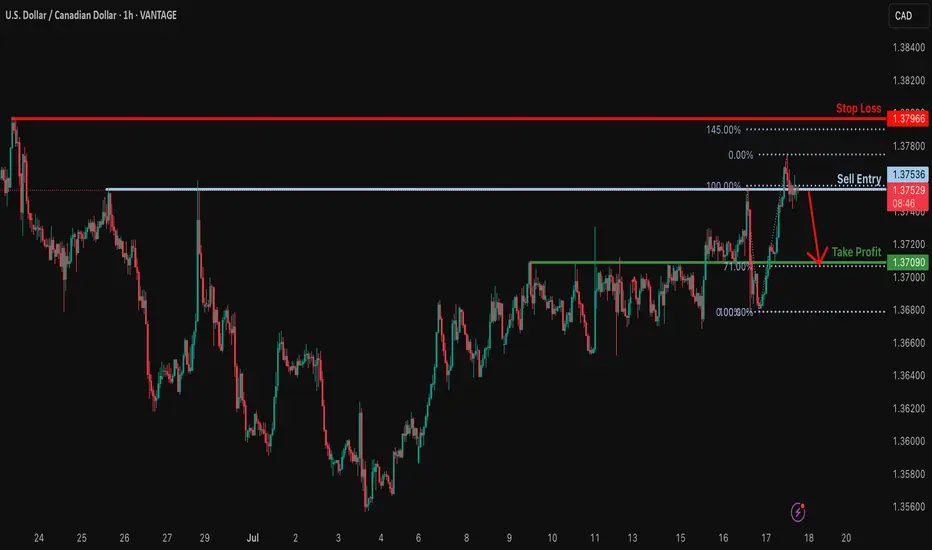
Bearish drop off pullback resistance?USD/CAD is reacting off the resistance level which is a pullback resistance and could reverse from this level to our take profit.
Entry: 1.3753
Why we like it:
There is a pullback resistance.
Stop loss: 1.3796
Why we like it:
There is a swing high resistance that is slightly above the 145% Fibonacci extension.
Take profit: 1.3709
Why we lik eit:
There is an overlap support that lines up with the 71% Fibonacci retracement.
Enjoying your TradingView experience? Review us!
Please be advised that the information presented on TradingView is provided to Vantage (‘Vantage Global Limited’, ‘we’) by a third-party provider (‘Everest Fortune Group’). Please be reminded that you are solely responsible for the trading decisions on your account. There is a very high degree of risk involved in trading. Any information and/or content is intended entirely for research, educational and informational purposes only and does not constitute investment or consultation advice or investment strategy. The information is not tailored to the investment needs of any specific person and therefore does not involve a consideration of any of the investment objectives, financial situation or needs of any viewer that may receive it. Kindly also note that past performance is not a reliable indicator of future results. Actual results may differ materially from those anticipated in forward-looking or past performance statements. We assume no liability as to the accuracy or completeness of any of the information and/or content provided herein and the Company cannot be held responsible for any omission, mistake nor for any loss or damage including without limitation to any loss of profit which may arise from reliance on any information supplied by Everest Fortune Group.
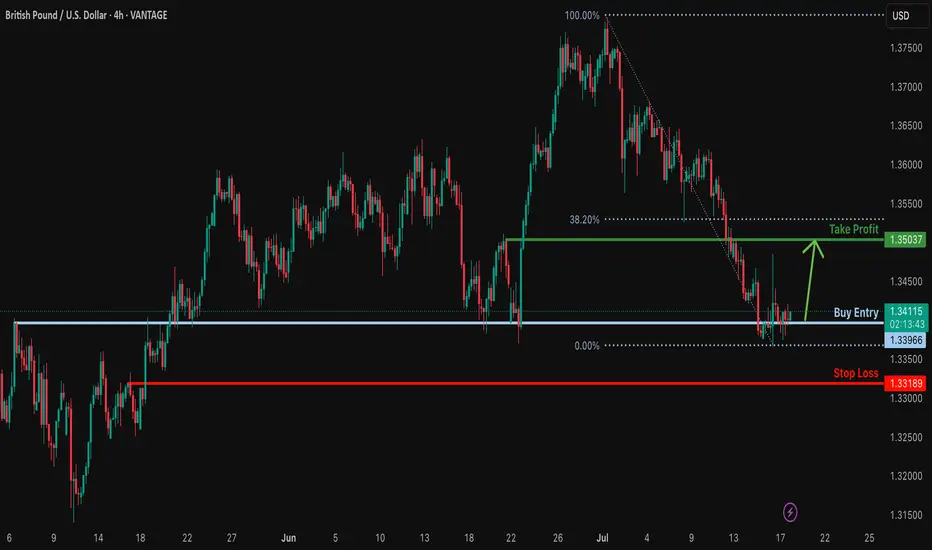
Bullish reversal?GBP/USD is reacting off the support level which is an overlap support and could bounce from this level to our take profit.
Entry: 1.3396
Why we like it:
There is an overlap support.
Stop loss: 1.3318
Why we like it:
There is a pullback support.
Take profit: 1.3503
Why we like it:
There is a pullback resistance that is slightly below the 38.2% Fibonacci retracement.
Enjoying your TradingView experience? Review us!
Please be advised that the information presented on TradingView is provided to Vantage (‘Vantage Global Limited’, ‘we’) by a third-party provider (‘Everest Fortune Group’). Please be reminded that you are solely responsible for the trading decisions on your account. There is a very high degree of risk involved in trading. Any information and/or content is intended entirely for research, educational and informational purposes only and does not constitute investment or consultation advice or investment strategy. The information is not tailored to the investment needs of any specific person and therefore does not involve a consideration of any of the investment objectives, financial situation or needs of any viewer that may receive it. Kindly also note that past performance is not a reliable indicator of future results. Actual results may differ materially from those anticipated in forward-looking or past performance statements. We assume no liability as to the accuracy or completeness of any of the information and/or content provided herein and the Company cannot be held responsible for any omission, mistake nor for any loss or damage including without limitation to any loss of profit which may arise from reliance on any information supplied by Everest Fortune Group.
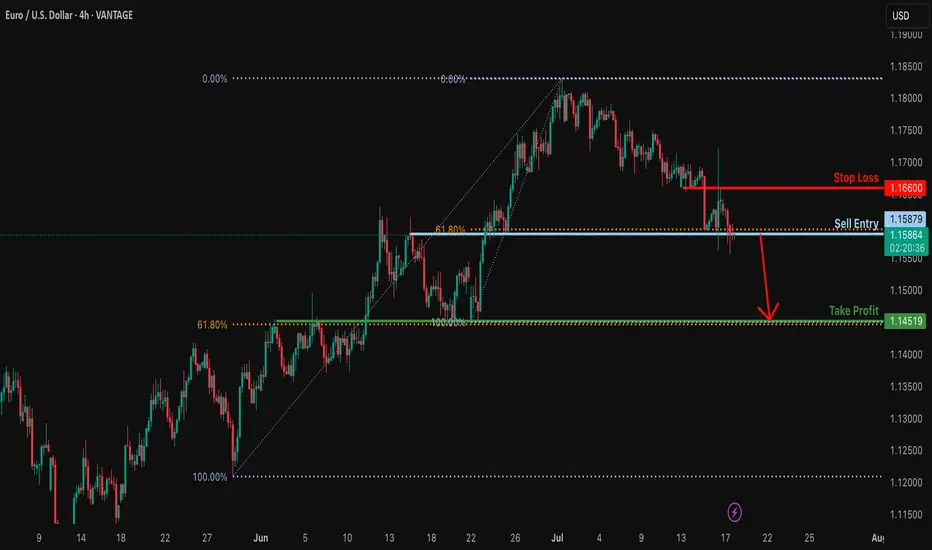
Bearish breakout off major support?EUR/USD is reacting off the support level which is an overlap support that lines up with the 61.8% Fibonacci retracement and a breakout of this level could lead the price to drop from this level to our take profit.
Entry: 1.1587
Why we like it:
There is an overlap support level that lines up with the 61.8% Fibonacci retracement.
Stop loss: 1.1666
Why we like it:
There is an overlap resistance.
Take profit: 1.1451
Why we like it:
There is an overlap support level that lines up with the 61.8% Fibonacci retracement.
Enjoying your TradingView experience? Review us!
Please be advised that the information presented on TradingView is provided to Vantage (‘Vantage Global Limited’, ‘we’) by a third-party provider (‘Everest Fortune Group’). Please be reminded that you are solely responsible for the trading decisions on your account. There is a very high degree of risk involved in trading. Any information and/or content is intended entirely for research, educational and informational purposes only and does not constitute investment or consultation advice or investment strategy. The information is not tailored to the investment needs of any specific person and therefore does not involve a consideration of any of the investment objectives, financial situation or needs of any viewer that may receive it. Kindly also note that past performance is not a reliable indicator of future results. Actual results may differ materially from those anticipated in forward-looking or past performance statements. We assume no liability as to the accuracy or completeness of any of the information and/or content provided herein and the Company cannot be held responsible for any omission, mistake nor for any loss or damage including without limitation to any loss of profit which may arise from reliance on any information supplied by Everest Fortune Group.
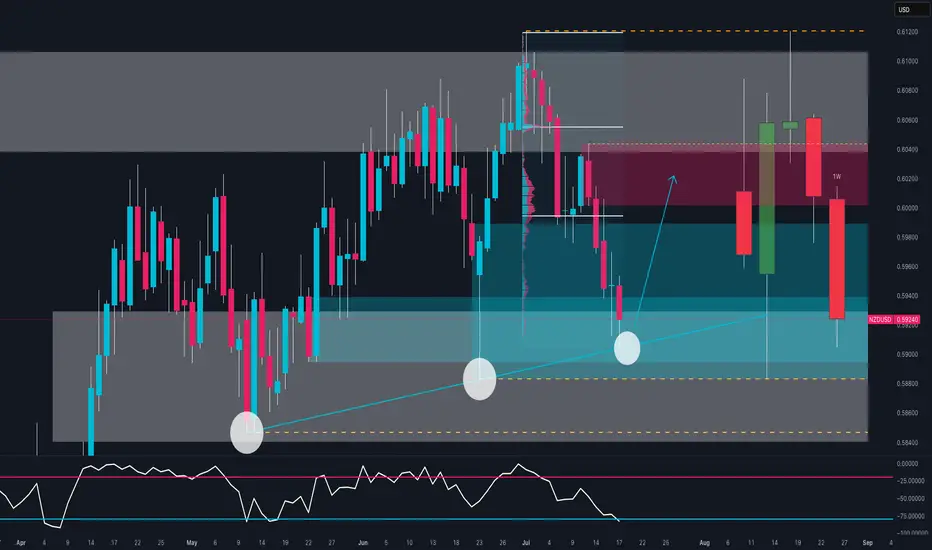
NZD/USD Ready to Explode? The Smart Money Is Making a MoveBias: Bullish Bounce from Key Demand Zone
NZD/USD is testing a strong confluence zone:
Long-term ascending trendline support
Weekly demand area between 0.5890 and 0.5940
Bullish RSI divergence near oversold conditions
The triple rejection wicks signal strong demand around 0.5900, suggesting a possible reversal toward the 0.6020–0.6050 resistance area.
🧠 COT Insight:
NZD: Non-commercial traders added +669 long contracts and reduced shorts by -102 → net bullish shift
USD: Net short exposure increases; total non-commercial shorts now exceed longs by ~4000 contracts
Implication: institutions are rotating into NZD while trimming USD exposure
📊 Sentiment:
86% of retail traders are long NZD/USD → retail sentiment is heavily skewed
This could delay or limit upside as smart money often moves counter to retail positions
📅 Seasonality (July):
July has historically been a bullish month for NZD/USD across all reference windows (20Y, 15Y, 10Y, 5Y, 2Y)
Average July return consistently positive → adds conviction to bullish thesis
🗺 Outlook:
If the zone at 0.5880–0.5920 holds, price may bounce toward 0.6020–0.6050.
Break below would invalidate structure and expose 0.5850 and then 0.5780.
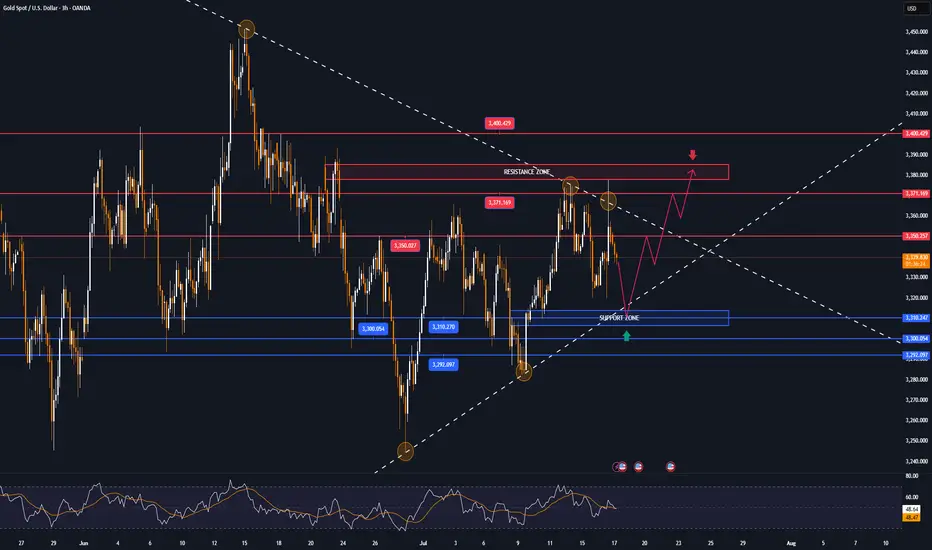
GOLD's narrowing range, tariffs, Trump's political dramaOANDA:XAUUSD is still trading in a narrowing range, affected by the tariff game and the political drama that Trump is building. Currently, the price of gold is trading around 3,339 USD/oz, equivalent to a small decrease of about 7 dollars on the day.
Tariff Game
On July 16, US President Donald Trump announced that he would send letters to more than 150 countries, with tariffs expected to be 10% or 15%, to promote trade. He said these countries are not major US partners and will be treated equally, but left open the possibility of negotiating exemptions. The tariffs are similar to those proposed in April but were postponed due to concerns about market volatility. The resumption of the tariffs continues to destabilize financial markets and surprised partners such as the European Union, as they hoped to reach an early agreement with the US.
Political Play
Also on July 16, global financial markets were shaken by rumors that President Trump intended to fire Federal Reserve Chairman Jerome Powell. Many major news agencies such as the New York Times, Bloomberg and Reuters reported that Trump had prepared a letter of dismissal and consulted with Republican lawmakers, receiving positive feedback. Removing Powell before his term was believed to undermine confidence in the US financial system and the safe haven status of the USD. Trump later denied the plan, saying it was unlikely to happen unless there was serious wrongdoing. Markets reacted strongly: the USD fell and then recovered after Trump's statement, while gold lost most of its previous gains by the end of the session.
The gold market in particular, and the financial economy in general, are being affected by the activities of Trump, the creator of the global trade war, and the plays of Trump and the FED leading the market. Therefore, the basic formula in the current market context is best to follow Trump, and make sure not to miss any of Trump's status lines.
Technical outlook analysis of OANDA:XAUUSD
On the daily chart, the technical structure has not changed with the trend not yet clear and the price action clinging to the EMA21.
The technical conditions do not favor an uptrend or a downtrend, typically the RSI moves around the 50 level, indicating a hesitant market sentiment.
On the upside, gold needs to achieve the condition of breaking above the 0.236% Fibonacci retracement level of the price point of 3,371 USD then the target level will be around 3,400 USD in the short term, more than 3,430 USD.
Meanwhile, on the downside, gold needs to break below the 0.382% Fibonacci retracement, which would confirm a loss of the $3,300 level, then target around $3,246 in the short term, more than the 0.50% Fibonacci retracement.
Intraday, the sideways trend of gold price accumulation will be noticed by the following technical positions.
Support: $3,310 – $3,300 – $3,292
Resistance: $3,350 – $3,371 – $3,400
SELL XAUUSD PRICE 3381 - 3379⚡️
↠↠ Stop Loss 3385
→Take Profit 1 3373
↨
→Take Profit 2 3387
BUY XAUUSD PRICE 3309 - 3311⚡️
↠↠ Stop Loss 3305
→Take Profit 1 3317
↨
→Take Profit 2 3323
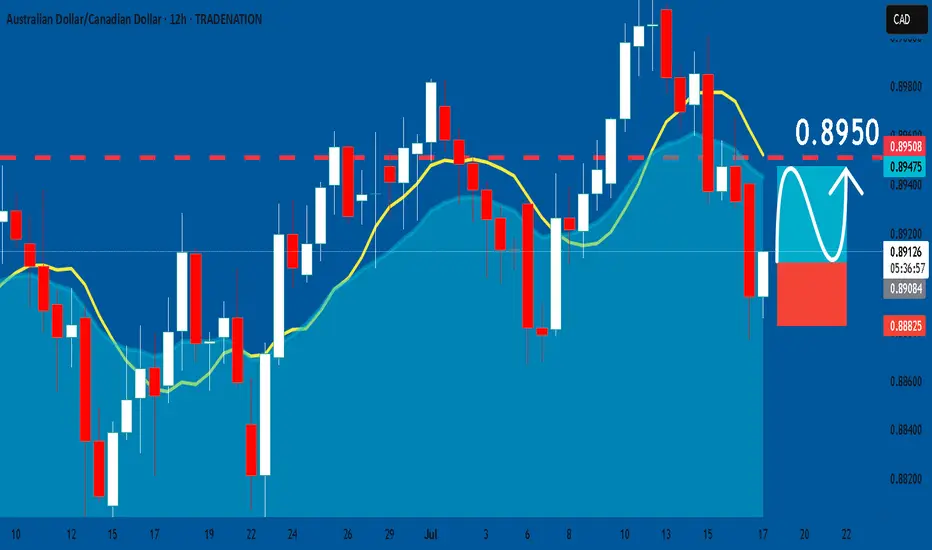
AUDCAD: Long Signal Explained
AUDCAD
- Classic bullish formation
- Our team expects pullback
SUGGESTED TRADE:
Swing Trade
Long AUDCAD
Entry - 0.8908
Sl - 0.8882
Tp - 0.8950
Our Risk - 1%
Start protection of your profits from lower levels
Disclosure: I am part of Trade Nation's Influencer program and receive a monthly fee for using their TradingView charts in my analysis.
❤️ Please, support our work with like & comment! ❤️
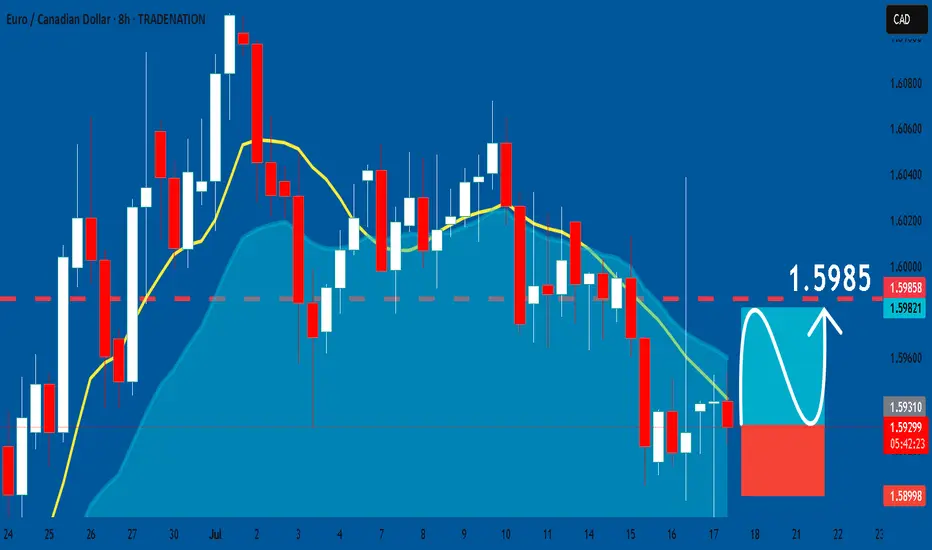
EURCAD: Long Signal with Entry/SL/TP
EURCAD
- Classic bullish pattern
- Our team expects retracement
SUGGESTED TRADE:
Swing Trade
Buy EURCAD
Entry - 1.5929
Stop - 1.5899
Take - 1.5985
Our Risk - 1%
Start protection of your profits from lower levels
Disclosure: I am part of Trade Nation's Influencer program and receive a monthly fee for using their TradingView charts in my analysis.
❤️ Please, support our work with like & comment! ❤️
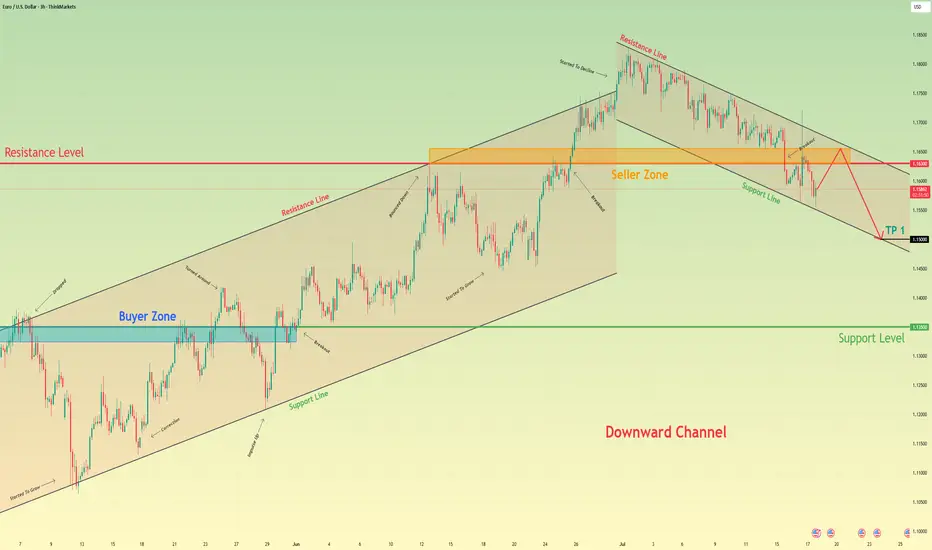
Euro may reach seller zone and then continue to fall in channelHello traders, I want share with you my opinion about Euro. The price pair has recently shifted its market structure, establishing a clear downward channel after breaking its previous uptrend. Before this breakdown, the price was consistently trading within an Upward Channel, repeatedly finding support in the buyer zone (1.1325–1.1350) and reversing upward. The bullish momentum eventually faded when the price failed to break the major horizontal resistance level at 1.1630. This failure triggered a strong bearish impulse, leading to a decisive breakout below the channel's support line and confirming a trend reversal. Currently, the price is making a corrective move up inside the newly formed downward channel, which appears to be a classic retest of the broken structure from below. I expect this upward move to stall as it approaches the heavy confluence of resistance formed by the channel's upper Resistance Line and the horizontal seller zone at 1.1630–1.1655. After testing this area, I anticipate a rejection and the beginning of a new bearish leg down. That's why I've set my TP at the 1.1500 level — it aligns perfectly with the support line of the current downward channel, making it a logical target for sellers. Please share this idea with your friends and click Boost 🚀
Disclaimer: As part of ThinkMarkets’ Influencer Program, I am sponsored to share and publish their charts in my analysis.
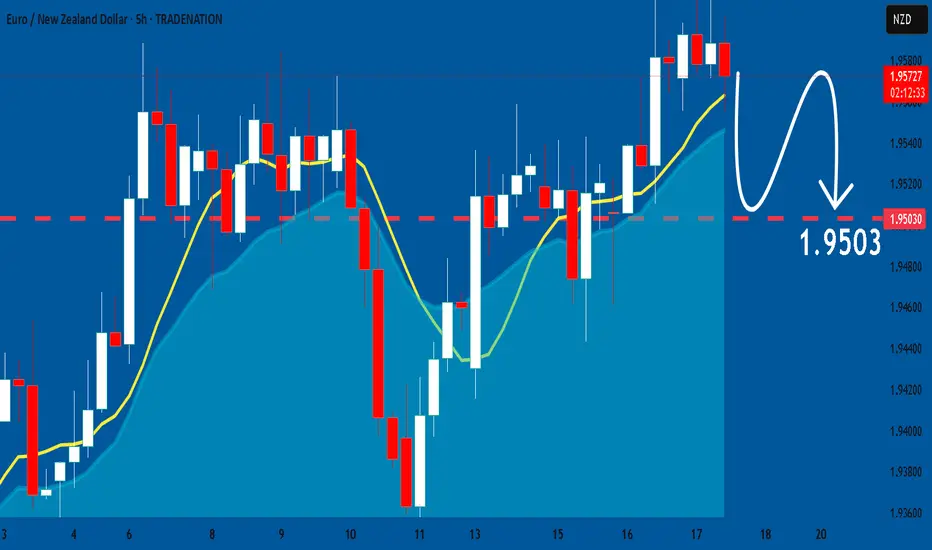
EURNZD: Bearish Forecast & Bearish Scenario
The analysis of the EURNZD chart clearly shows us that the pair is finally about to tank due to the rising pressure from the sellers.
Disclosure: I am part of Trade Nation's Influencer program and receive a monthly fee for using their TradingView charts in my analysis.
❤️ Please, support our work with like & comment! ❤️
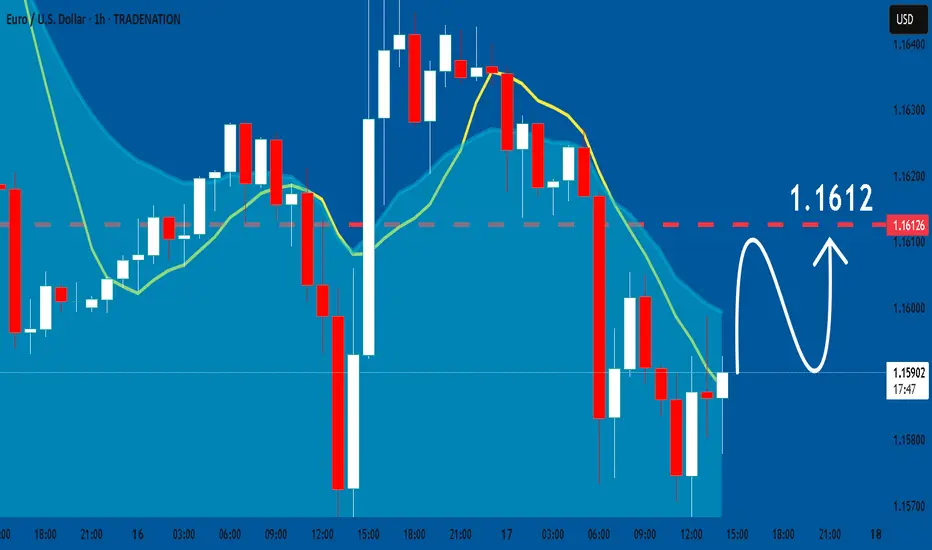
EURUSD: Bulls Will Push
Balance of buyers and sellers on the EURUSD pair, that is best felt when all the timeframes are analyzed properly is shifting in favor of the buyers, therefore is it only natural that we go long on the pair.
Disclosure: I am part of Trade Nation's Influencer program and receive a monthly fee for using their TradingView charts in my analysis.
❤️ Please, support our work with like & comment! ❤️
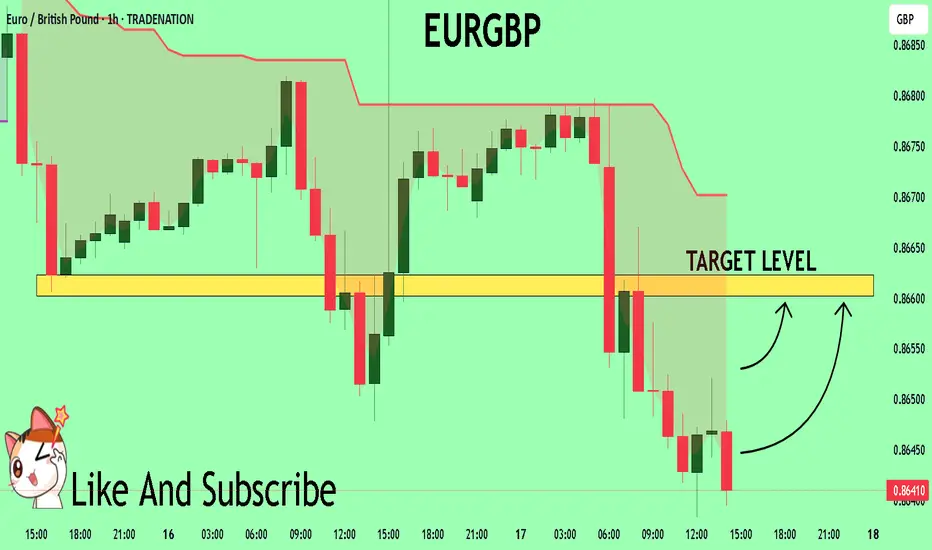
EURGBP Trading Opportunity! BUY!
My dear friends,
My technical analysis for EURGBP is below:
The market is trading on 0.8645 pivot level.
Bias - Bullish
Technical Indicators: Both Super Trend & Pivot HL indicate a highly probable Bullish continuation.
Target - 0.8660
About Used Indicators:
A pivot point is a technical analysis indicator, or calculations, used to determine the overall trend of the market over different time frames.
Disclosure: I am part of Trade Nation's Influencer program and receive a monthly fee for using their TradingView charts in my analysis.
———————————
WISH YOU ALL LUCK
GBPAUD: Pullback From Resistance 🇬🇧🇦🇺
I think that GBPAUD may pull back from a key intraday resistance.
As a confirmation, I see a bearish engulfing candle after its test
on an hourly time frame.
Goal - 2.0655
❤️Please, support my work with like, thank you!❤️
I am part of Trade Nation's Influencer program and receive a monthly fee for using their TradingView charts in my analysis.
