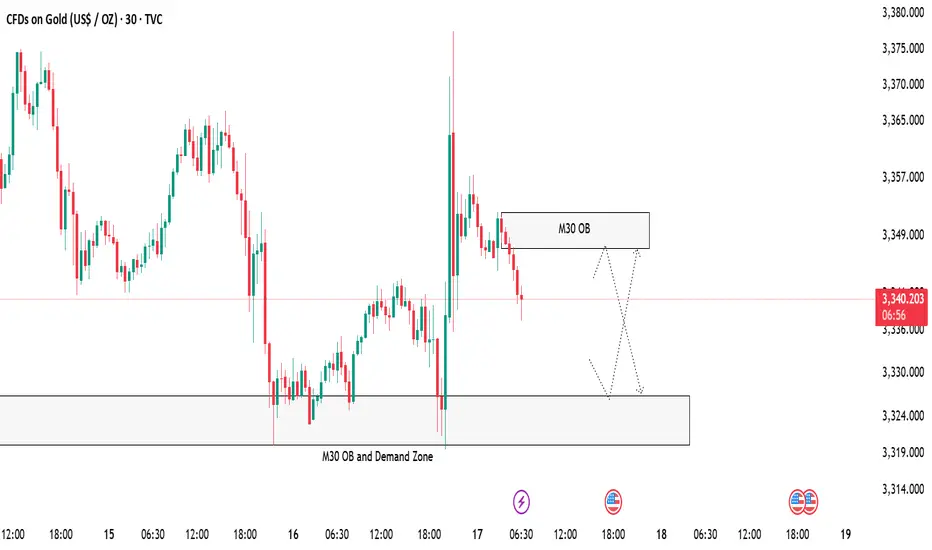
Gold 30-Minute OB and Demand Zone SetupGold is now approaching a 30-Minute Order Block along with a strong demand zone 🟢. We are expecting some clean reactions from these areas.
📌 Plan:
Scenario 1:
👉 If price respects the M30 OB and Demand zone area at 3327 -3320, we can look for bullish signs like rejection wicks or bullish candles to enter buy positions 📈, targeting the upper zone M30 OB zone near 3347 🎯.
Scenario 2:
👉 If price tap the above 30 min OB near 3347 we take our sell or short side entries for a reaction from there entering short ✅.
Both scenarios are possible, so we will watch the price action closely 🧐 and only trade with confirmation!
Forex
Gold Price Analysis July 17XAUUSD Analysis Today
The price has cleared the liquidity to the 3377 zone, then returned to trading within the triangle. The market is currently waiting for new momentum to determine the next trend.
✅ BUY Scenario
If the 3322-3323 zone continues to hold and there is a bearish rejection signal and confirmation of buying power, gold is expected to continue its uptrend towards the 3373 - 3400 zone.
❌ SELL Scenario
If the price breaks the 3321 support with clear selling pressure, it can extend the decline to 3285.
🔑 Key Level Today
Support: 3321 - 3323
Resistance: 3373 - 3400
💡 Strategy:
Watch the price reaction at the important support zone to decide the next action.

MarketBreakdown | EURAUD, GBPJPY, WTI CRUDE OIL, SILVER
Here are the updates & outlook for multiple instruments in my watch list.
1️⃣ #EURAUD daily time frame 🇪🇺🇦🇺
The market is trading in a bullish trend.
The price is steadily growing within a rising parallel channel.
A recent test of its support triggered a strong bullish reaction.
I think that a rise may continue at least to a current high - 1.8035
2️⃣ #GBPJPY daily time frame 🇬🇧🇯🇵
The market is consolidating within a narrow horizontal
parallel channel.
Consider consolidation, trading within its boundaries.
The next bullish wave will be confirmed with a breakout and a
daily candle close above its resistance.
3️⃣ CRUDE OIL #WTI daily time frame 🛢️
The market remains weak and consolidation continues.
I see a wide horizontal range where the price is now stuck.
I think that we may see a pullback from its support.
4️⃣ #SILVER #XAGUSD daily time frame 🪙
The market is retracing after a formation of a new higher high.
I see a strong demand zone ahead: it is based on a rising trend line
and a recently broken horizontal resistance.
The next trend following movement will most likely initiate from there.
Do you agree with my market breakdown?
❤️Please, support my work with like, thank you!❤️
I am part of Trade Nation's Influencer program and receive a monthly fee for using their TradingView charts in my analysis.

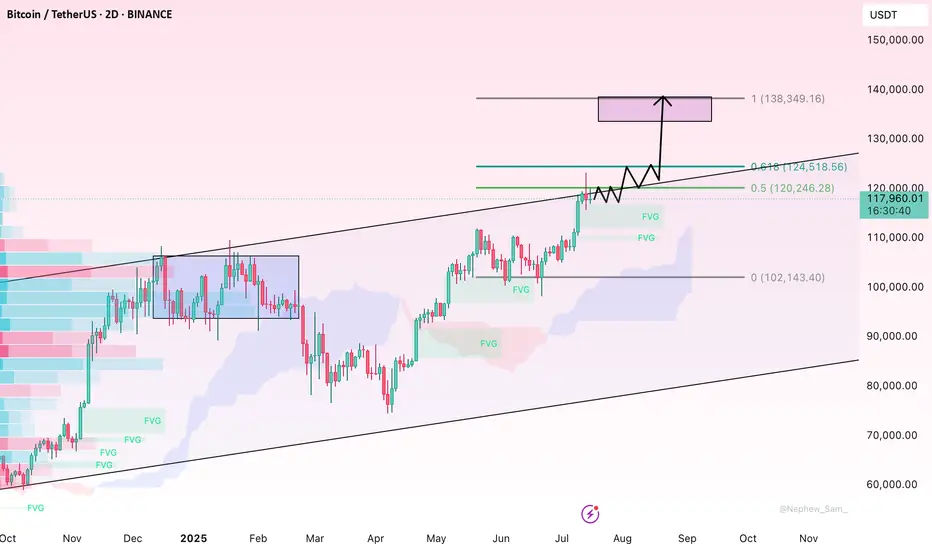
BTC Nears $120K – Pullback Risk or Breakout Launchpad?Bitcoin has rallied strongly after breaking its multi-week consolidation, now hovering just under the key psychological and historical resistance at $120K. The daily chart shows price floating above the 20EMA, with no signs of distribution—yet. However, the dense liquidity pocket between $110K–$114K remains a magnet in case of a technical pullback.
If bulls defend $118K and price cleanly breaks above $121K with strong volume, the next target lies in the $125K–$128K zone. Spot ETF inflows remain healthy, and any dovish pivot from the Fed could set off another crypto-wide bull wave.
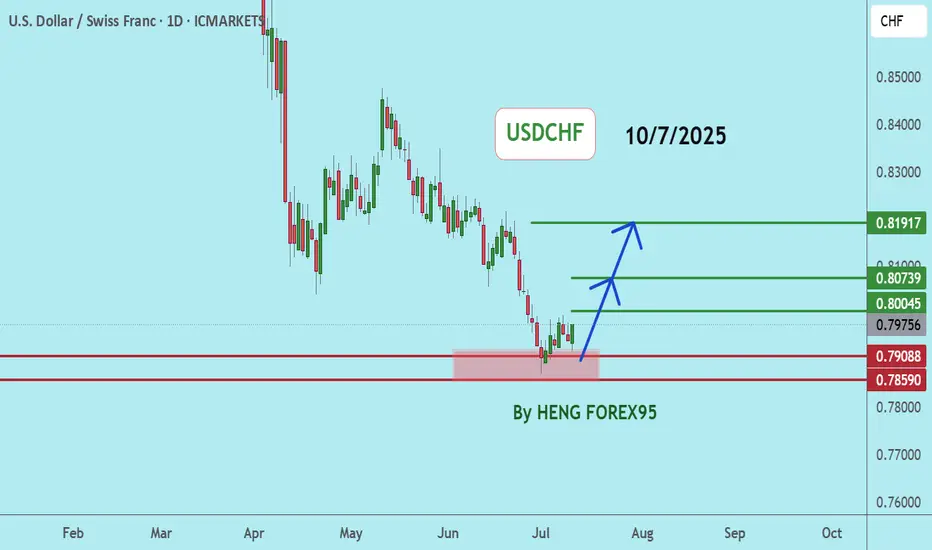
USDCHFUSDCHF If the price can stay above 0.78590, it is expected that the price will rebound. Consider buying in the red zone.
🔥Trading futures, forex, CFDs and stocks carries a risk of loss.
Please consider carefully whether such trading is suitable for you.
>>GooD Luck 😊
❤️ Like and subscribe to never miss a new idea!
EURJPY - Still Over-Bought!Hello TradingView Family / Fellow Traders. This is Richard, also known as theSignalyst.
📈EURJPY has been overall bullish trading within the rising channel marked in blue. However, it is currently retesting the upper bound of the channel.
Moreover, the green zone is a major weekly supply.
🏹 Thus, the highlighted red circle is a strong area to look for sell setups as it is the intersection of the upper blue trendline and weekly supply.
📚 As per my trading style:
As #EURJPY approaches the red circle zone, I will be looking for bearish reversal setups (like a double top pattern, trendline break , and so on...)
📚 Always follow your trading plan regarding entry, risk management, and trade management.
Good luck!
All Strategies Are Good; If Managed Properly!
~Richard Nasr
Disclosure: I am part of Trade Nation's Influencer program and receive a monthly fee for using their TradingView charts in my analysis.

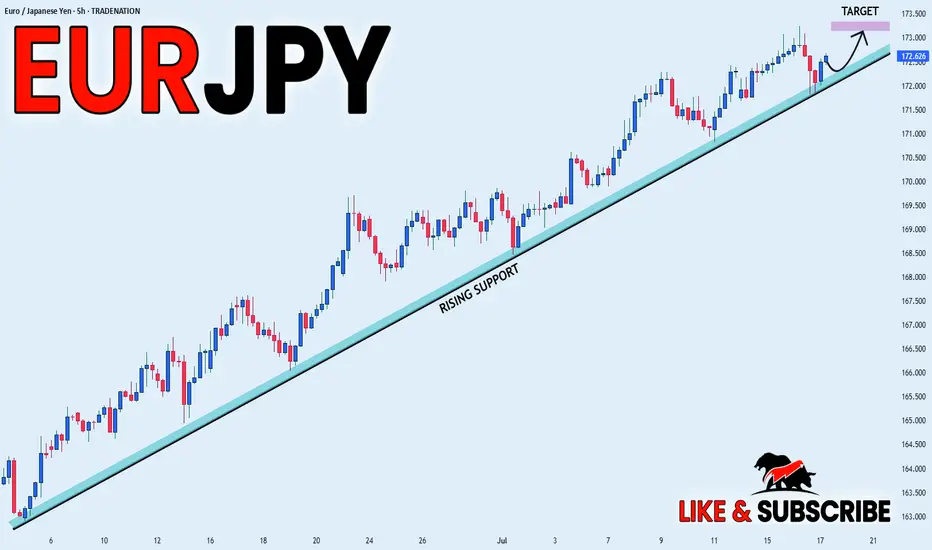
EUR_JPY WILL GO UP|LONG|
✅EUR_JPY is trading along the rising support line
And as the pair is going up now
After the retest of the line
I am expecting the price to keep growing
To retest the supply levels above at 173.166
LONG🚀
✅Like and subscribe to never miss a new idea!✅
Disclosure: I am part of Trade Nation's Influencer program and receive a monthly fee for using their TradingView charts in my analysis.
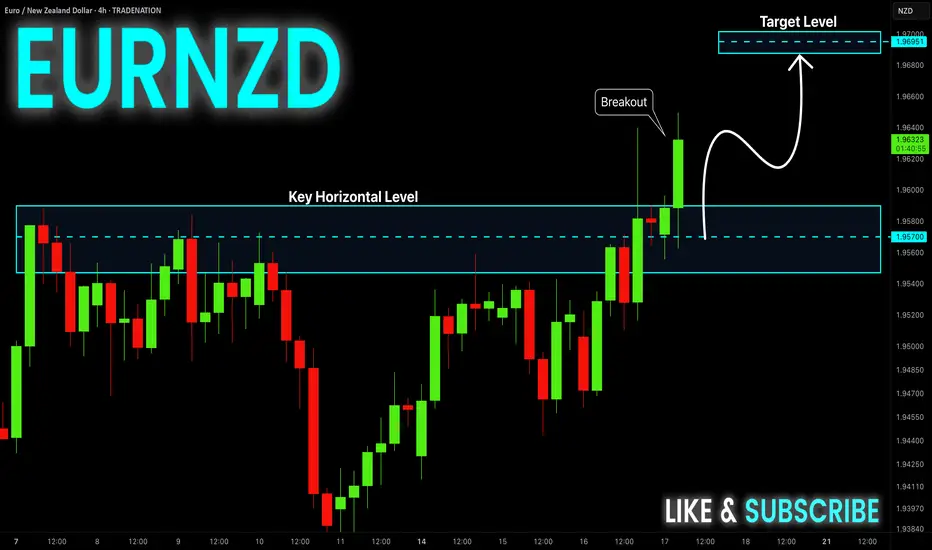
EUR-NZD Will Keep Growing! Buy!
Hello,Traders!
EUR-NZD is trading in a
Strong uptrend and the
Pair made a bullish breakout
Of the key horizontal level
Of 1.9580 so we are bullish
Biased and we will be expecting
A further bullish move up
Buy!
Comment and subscribe to help us grow!
Check out other forecasts below too!
Disclosure: I am part of Trade Nation's Influencer program and receive a monthly fee for using their TradingView charts in my analysis.
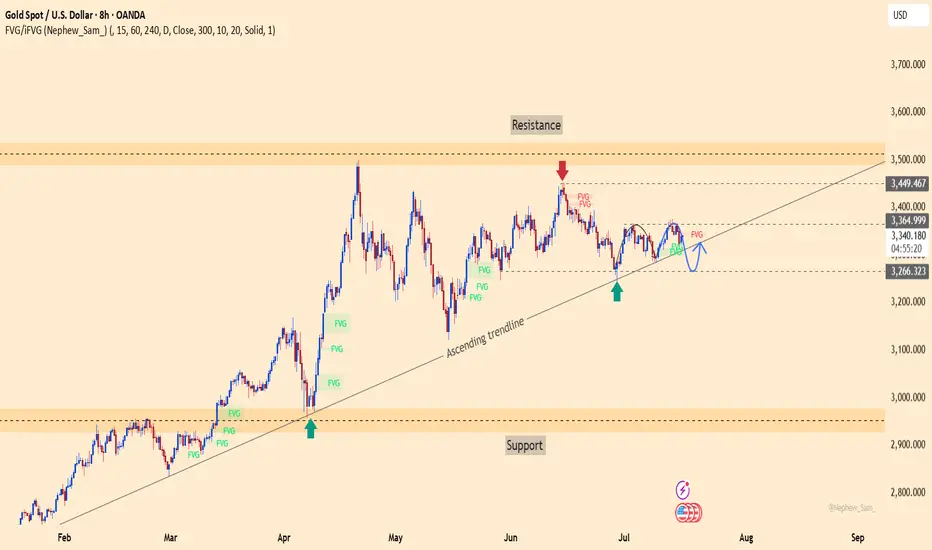
xauusd – is gold coiling up for a breakout?After multiple retests of the ascending trendline since March, gold (XAUUSD) continues to hold a solid bullish structure. While it hasn’t decisively broken through the 3,366 resistance, price action suggests that buyers are still in control. The repeated appearance of FVG zones signals smart money accumulation beneath the surface.
On the news front, U.S. PPI data came in at a 0.2% increase — exactly in line with expectations. This neutral result hasn’t given the USD a strong push, which may allow gold to maintain or even inch higher in the short term.
As long as the 3,265 support zone holds, the path remains open for a move toward the 3,449 target area. This might be the final consolidation before a powerful breakout. The question is: are you ready to ride the next leg up?
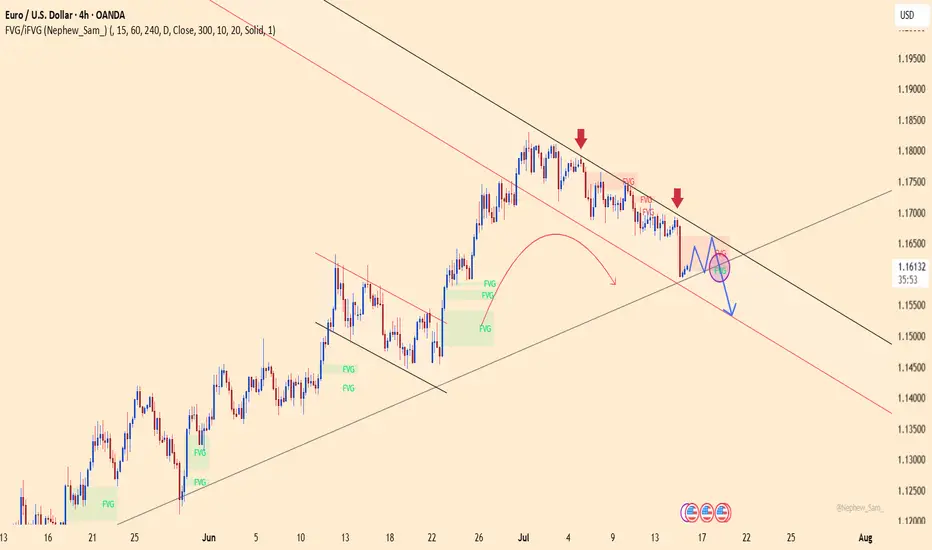
EURUSD – Weakness emerges at descending channel resistanceEURUSD remains within a well-defined descending channel and was recently rejected at the upper trendline – a key dynamic resistance zone. Price action shows the recovery is limited around 1.16600, with multiple FVG (Fair Value Gap) zones reinforcing the potential for further downside.
On the news front, the euro remains under pressure as Eurozone inflation data brought no surprises, while the US dollar is supported by June’s PPI rising exactly as expected at 0.2%. This combination leaves EURUSD with little momentum to break higher, making a move back toward the 1.15300 support area a scenario to watch.
If the price fails to break above 1.16600 and forms a lower high, the bearish trend will be further confirmed. Keep an eye on price behavior around the FVG zones to identify optimal entry points.
Gold's Downtrend: Is a Breakout Imminent?Hello traders, what do you think about the gold trend?
Let's set aside the news factors for now and focus on short-term technical analysis with a bearish outlook.
In the current technical picture, gold continues to trade below the trendline, lacking upward momentum, forming a descending wedge pattern. The behavior around the convergence of EMA 34 and 89 also indicates that sellers still control the market.
A sell strategy is favored, with attention to the support zone around 3,315 – 3,320 USD. If this level breaks, stronger sell-offs are likely to follow.
What do you think about gold’s price today? Leave your thoughts in the comments below!
Good luck!

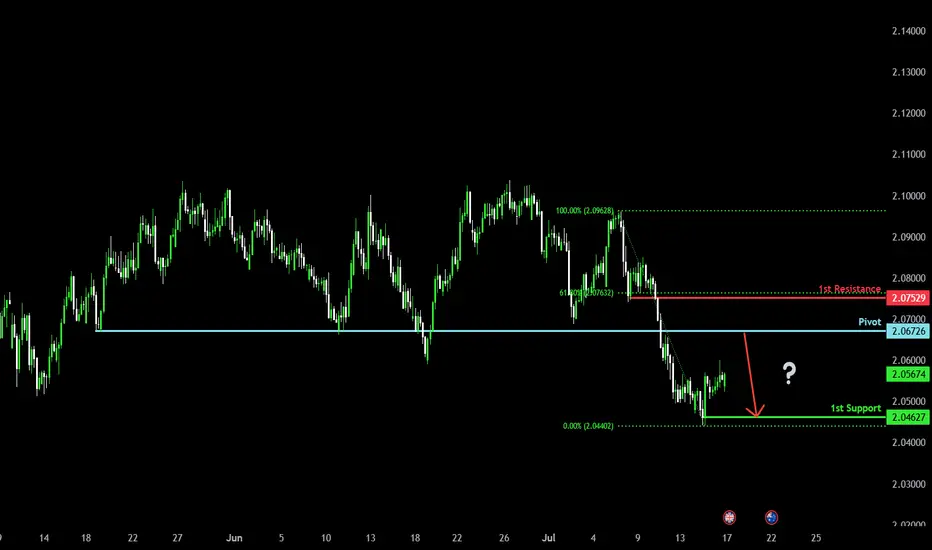
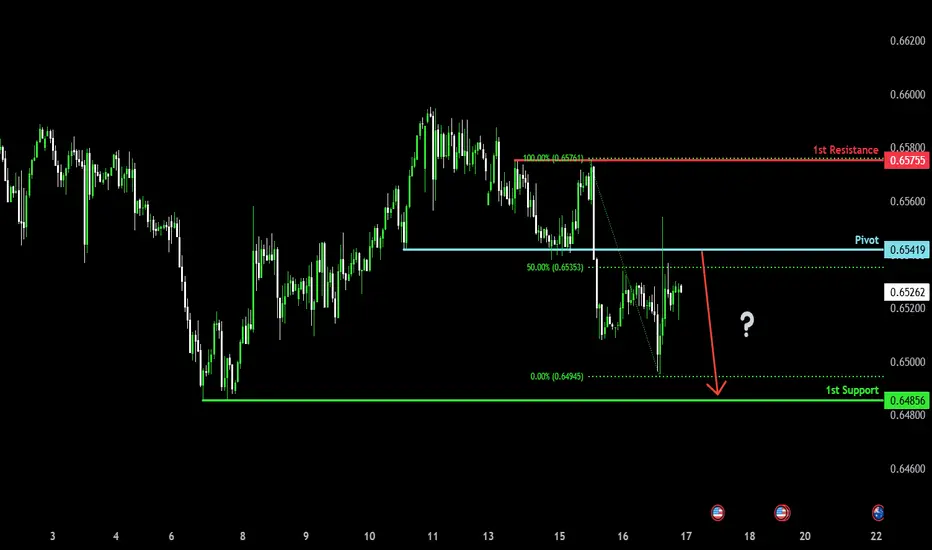
Heading into major resistance?GBP/AUD is rising towards the pivot which is a pullback resistance and could reverse to the 1st support which is a pullback support.
Pivot: 2.0672
1st Support: 2.0462
1st Resistance: 2.0752
Risk Warning:
Trading Forex and CFDs carries a high level of risk to your capital and you should only trade with money you can afford to lose. Trading Forex and CFDs may not be suitable for all investors, so please ensure that you fully understand the risks involved and seek independent advice if necessary.
Disclaimer:
The above opinions given constitute general market commentary, and do not constitute the opinion or advice of IC Markets or any form of personal or investment advice.
Any opinions, news, research, analyses, prices, other information, or links to third-party sites contained on this website are provided on an "as-is" basis, are intended only to be informative, is not an advice nor a recommendation, nor research, or a record of our trading prices, or an offer of, or solicitation for a transaction in any financial instrument and thus should not be treated as such. The information provided does not involve any specific investment objectives, financial situation and needs of any specific person who may receive it. Please be aware, that past performance is not a reliable indicator of future performance and/or results. Past Performance or Forward-looking scenarios based upon the reasonable beliefs of the third-party provider are not a guarantee of future performance. Actual results may differ materially from those anticipated in forward-looking or past performance statements. IC Markets makes no representation or warranty and assumes no liability as to the accuracy or completeness of the information provided, nor any loss arising from any investment based on a recommendation, forecast or any information supplied by any third-party.
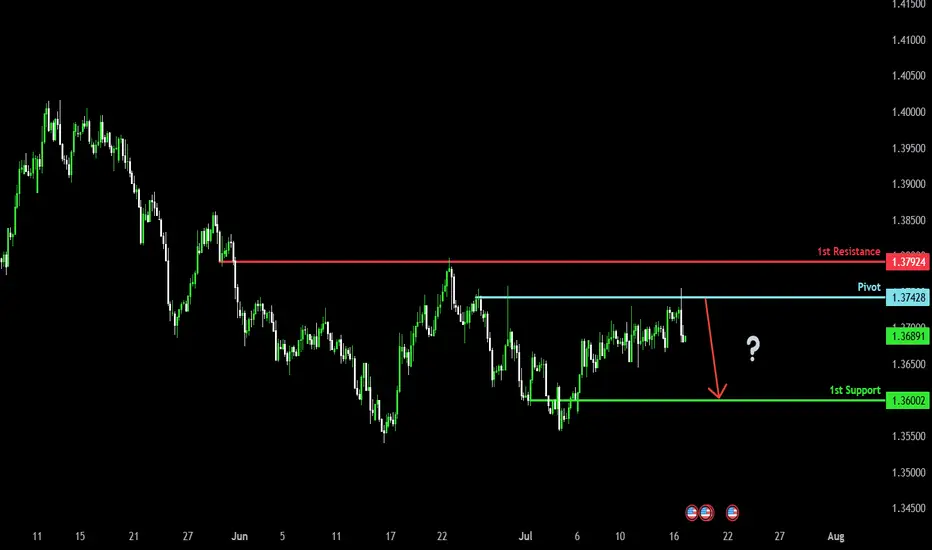
Bearish drop?The Loonie (USD/CAD) has rejected off the pivot which acts as a pullback resistance, and could drop to the 1st support.
Pivot: 1.3742
1st Support: 1.3600
1st Resistance: 1.3792
Risk Warning:
Trading Forex and CFDs carries a high level of risk to your capital and you should only trade with money you can afford to lose. Trading Forex and CFDs may not be suitable for all investors, so please ensure that you fully understand the risks involved and seek independent advice if necessary.
Disclaimer:
The above opinions given constitute general market commentary, and do not constitute the opinion or advice of IC Markets or any form of personal or investment advice.
Any opinions, news, research, analyses, prices, other information, or links to third-party sites contained on this website are provided on an "as-is" basis, are intended only to be informative, is not an advice nor a recommendation, nor research, or a record of our trading prices, or an offer of, or solicitation for a transaction in any financial instrument and thus should not be treated as such. The information provided does not involve any specific investment objectives, financial situation and needs of any specific person who may receive it. Please be aware, that past performance is not a reliable indicator of future performance and/or results. Past Performance or Forward-looking scenarios based upon the reasonable beliefs of the third-party provider are not a guarantee of future performance. Actual results may differ materially from those anticipated in forward-looking or past performance statements. IC Markets makes no representation or warranty and assumes no liability as to the accuracy or completeness of the information provided, nor any loss arising from any investment based on a recommendation, forecast or any information supplied by any third-party.
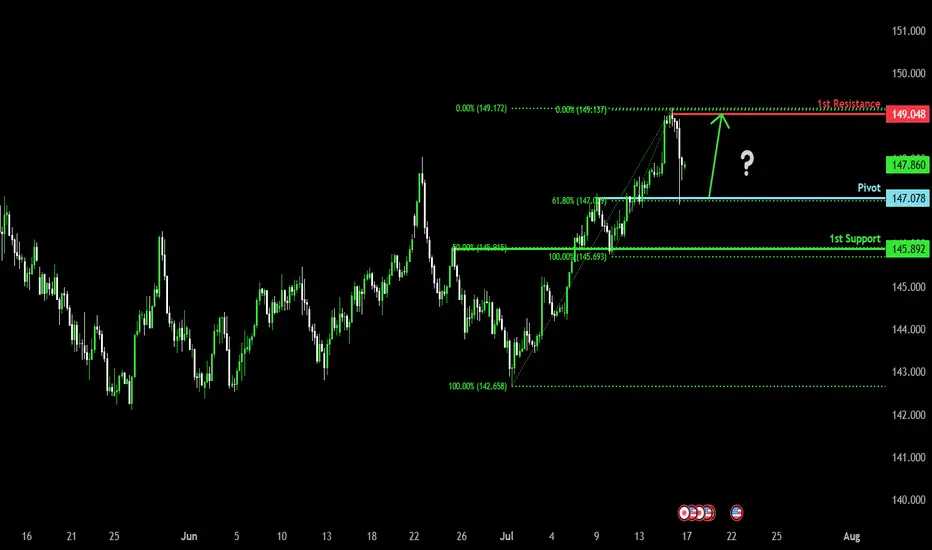
Bullish bounce off pullback support?USD/JPY is falling towards the pivot which aligns with the 61.8% Fibonacci retracement and could bounce to the 1st resistance.
Pivot: 147.07
1st Support: 145.89
1st Resistance: 149.04
Risk Warning:
Trading Forex and CFDs carries a high level of risk to your capital and you should only trade with money you can afford to lose. Trading Forex and CFDs may not be suitable for all investors, so please ensure that you fully understand the risks involved and seek independent advice if necessary.
Disclaimer:
The above opinions given constitute general market commentary, and do not constitute the opinion or advice of IC Markets or any form of personal or investment advice.
Any opinions, news, research, analyses, prices, other information, or links to third-party sites contained on this website are provided on an "as-is" basis, are intended only to be informative, is not an advice nor a recommendation, nor research, or a record of our trading prices, or an offer of, or solicitation for a transaction in any financial instrument and thus should not be treated as such. The information provided does not involve any specific investment objectives, financial situation and needs of any specific person who may receive it. Please be aware, that past performance is not a reliable indicator of future performance and/or results. Past Performance or Forward-looking scenarios based upon the reasonable beliefs of the third-party provider are not a guarantee of future performance. Actual results may differ materially from those anticipated in forward-looking or past performance statements. IC Markets makes no representation or warranty and assumes no liability as to the accuracy or completeness of the information provided, nor any loss arising from any investment based on a recommendation, forecast or any information supplied by any third-party.
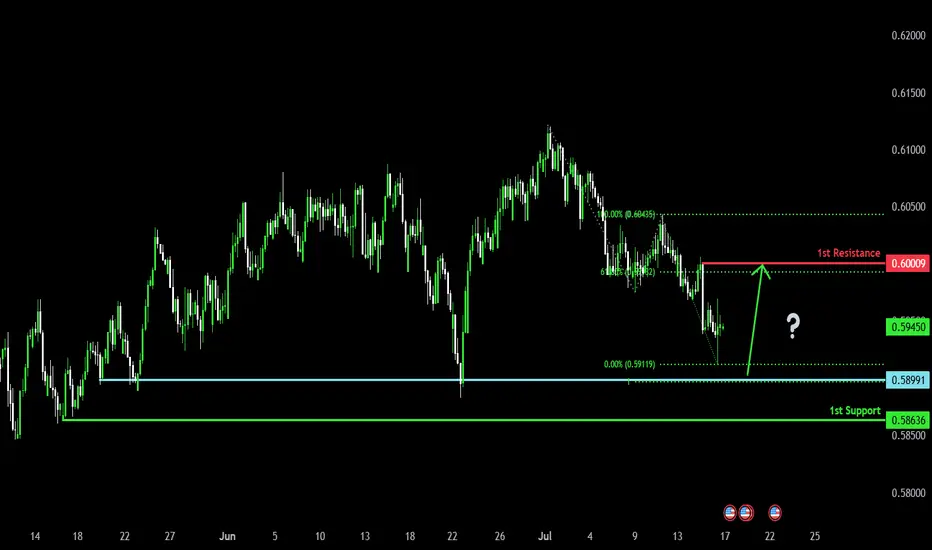
Bullish bounce?The Kiwi (NZD/USD) is falling towards the pivot and could bounce to the 1st resistance.
Pivot: 0.5899
1st Support: 0.5863
1st Resistance: 0.6000
Risk Warning:
Trading Forex and CFDs carries a high level of risk to your capital and you should only trade with money you can afford to lose. Trading Forex and CFDs may not be suitable for all investors, so please ensure that you fully understand the risks involved and seek independent advice if necessary.
Disclaimer:
The above opinions given constitute general market commentary, and do not constitute the opinion or advice of IC Markets or any form of personal or investment advice.
Any opinions, news, research, analyses, prices, other information, or links to third-party sites contained on this website are provided on an "as-is" basis, are intended only to be informative, is not an advice nor a recommendation, nor research, or a record of our trading prices, or an offer of, or solicitation for a transaction in any financial instrument and thus should not be treated as such. The information provided does not involve any specific investment objectives, financial situation and needs of any specific person who may receive it. Please be aware, that past performance is not a reliable indicator of future performance and/or results. Past Performance or Forward-looking scenarios based upon the reasonable beliefs of the third-party provider are not a guarantee of future performance. Actual results may differ materially from those anticipated in forward-looking or past performance statements. IC Markets makes no representation or warranty and assumes no liability as to the accuracy or completeness of the information provided, nor any loss arising from any investment based on a recommendation, forecast or any information supplied by any third-party.
Bearish reversal?The Aussie (AUD/USD) is rising towards the pivot and could reverse to the 1st support.
Pivot: 0.6541
1st Support: 0.6485
1st Resistance: 0.6575
Risk Warning:
Trading Forex and CFDs carries a high level of risk to your capital and you should only trade with money you can afford to lose. Trading Forex and CFDs may not be suitable for all investors, so please ensure that you fully understand the risks involved and seek independent advice if necessary.
Disclaimer:
The above opinions given constitute general market commentary, and do not constitute the opinion or advice of IC Markets or any form of personal or investment advice.
Any opinions, news, research, analyses, prices, other information, or links to third-party sites contained on this website are provided on an "as-is" basis, are intended only to be informative, is not an advice nor a recommendation, nor research, or a record of our trading prices, or an offer of, or solicitation for a transaction in any financial instrument and thus should not be treated as such. The information provided does not involve any specific investment objectives, financial situation and needs of any specific person who may receive it. Please be aware, that past performance is not a reliable indicator of future performance and/or results. Past Performance or Forward-looking scenarios based upon the reasonable beliefs of the third-party provider are not a guarantee of future performance. Actual results may differ materially from those anticipated in forward-looking or past performance statements. IC Markets makes no representation or warranty and assumes no liability as to the accuracy or completeness of the information provided, nor any loss arising from any investment based on a recommendation, forecast or any information supplied by any third-party.
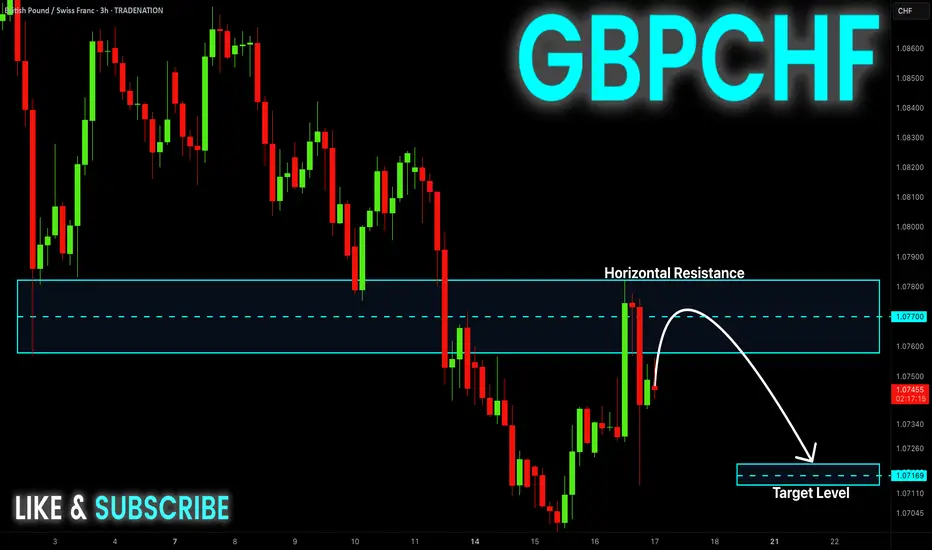
GBP-CHF Local Short! Sell!
Hello,Traders!
GBP-CHF made a retest of
The wide horizontal resistance
Of 1.0780 and we are already
Seeing a bearish pullback
So as the pair is trading in a
Downtrend we will be expecting
A further bearish move down
Sell!
Comment and subscribe to help us grow!
Check out other forecasts below too!
Disclosure: I am part of Trade Nation's Influencer program and receive a monthly fee for using their TradingView charts in my analysis.
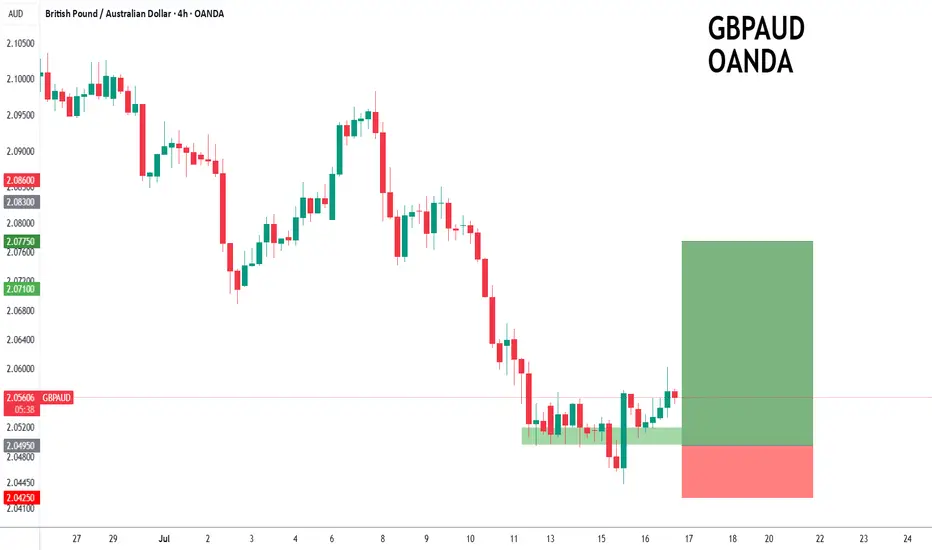
GBPAUD to turnaround?GBPAUD - 24h expiry
The primary trend remains bullish.
Price action looks to be forming a bottom.
We look for a temporary move lower.
Preferred trade is to buy on dips.
Bespoke support is located at 2.0495.
We look to Buy at 2.0495 (stop at 2.0425)
Our profit targets will be 2.0775 and 2.0820
Resistance: 2.0670 / 2.0750 / 2.0830
Support: 2.0490 / 2.0440 / 2.0400
Risk Disclaimer
The trade ideas beyond this page are for informational purposes only and do not constitute investment advice or a solicitation to trade. This information is provided by Signal Centre, a third-party unaffiliated with OANDA, and is intended for general circulation only. OANDA does not guarantee the accuracy of this information and assumes no responsibilities for the information provided by the third party. The information does not take into account the specific investment objectives, financial situation, or particular needs of any particular person. You should take into account your specific investment objectives, financial situation, and particular needs before making a commitment to trade, including seeking advice from an independent financial adviser regarding the suitability of the investment, under a separate engagement, as you deem fit.
You accept that you assume all risks in independently viewing the contents and selecting a chosen strategy.
Where the research is distributed in Singapore to a person who is not an Accredited Investor, Expert Investor or an Institutional Investor, Oanda Asia Pacific Pte Ltd (“OAP“) accepts legal responsibility for the contents of the report to such persons only to the extent required by law. Singapore customers should contact OAP at 6579 8289 for matters arising from, or in connection with, the information/research distributed.
$GBIRYY - U.K Inflation Rises to a 2024 High (June/2025)ECONOMICS:GBIRYY
June/2025
source: Office for National Statistics
- The annual inflation rate in the UK rose to 3.6% in June, the highest since January 2024, up from 3.4% in May and above expectations that it would remain unchanged.
The main upward pressure came from transport prices, mostly motor fuel costs, airfares, rail fares and maintenance and repair of personal transport equipment.
On the other hand, services inflation remained steady at 4.7%.
Meanwhile, core inflation also accelerated, with the annual rate reaching 3.7%.

GOLD Set for Big Move? | Key Zones + CPI Impact Explained !Gold Analysis – Key Levels + CPI Outlook!
In this video, I broke down the recent rejection from the $3366–$3369 resistance zone, the drop to $3346, and current price action around $3357.
We’ll also look ahead at what to expect with the upcoming CPI report — and how it could shape gold’s next big move.
📌 I’ve covered both bullish and bearish scenarios, shared key demand/supply zones, and outlined possible targets.
👉 For full context and trading strategy, make sure to watch the video till the end — and don’t forget to drop your opinion in the comments:
Do you think gold will break $3380 next, or are we headed for another pullback?
THE MAIN ANALYSIS :

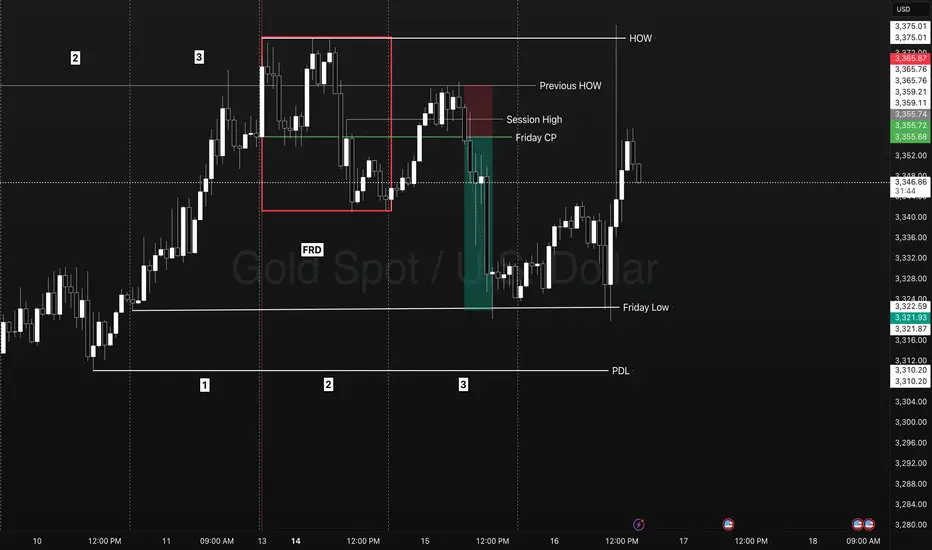
XAUSD - Using HOW levels for a break and retest!Identify what signal a market is showing you.
TYPES IOF SIGNAL DAYS
- First red/green day
- Dump/Pump
- Inside day
Frame the Trade play
- Reversal
- Continuation
Identify the Levels
- HOW/LOW
- Session High/LOW
- Friday Closing Price.
Trade Explanation
On the previous week FOREXCOM:XAUUSD triggered 3 days of breakout traders into the market closing in breakout. On Monday we have a FRD signal that sets up a next day trade opportunity. A retest of a previous weeks high gave us an indication of a retest/reversal trade on day 3 below Fridays closing price. Into the NY session this market quickly displaced back to Friday day 1 LOD level. Going into Tuesday day 2 we had the test of a weekly level and reversal above a session high closing below the Friday closing price. The break of a previous weeks high triggered more breakout traders into the market however it failed. We know day 2 typicall expands the range on Monday for a great parabolic trade setup right to as previous days low.
NO GUESSING, NO FOMO, NO FEAR, NO STRESS!
- Friday Closing Price (Entry)
- Previous HOW (Stop)
- PDL (Target)
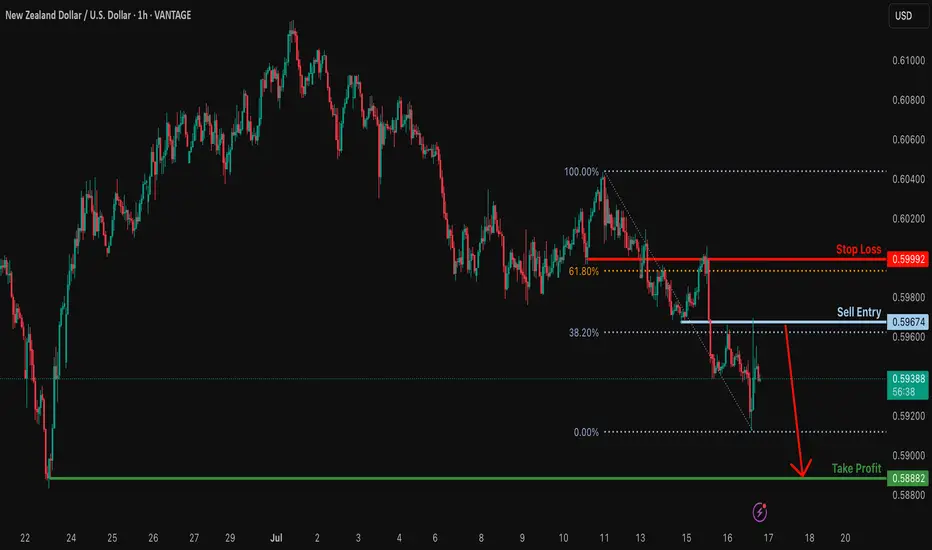
Bearish continuation?NZD/USD has rejected off the resistance level which is an overlap resistance that lines up with the 38.2% Fibonacci retracement and could drop from this level to our take profit.
Entry: 0.5967
Why we like it:
There is an overlap resistance that lines up with the 38.2% Fibonacci retracement.
Stop loss: 0.5999
Why we like it:
There is an overlap resistance that is slightly above the 61.8% Fibonacci retracement.
Take profit: 0.5888
Why we like it:
There is a pullback support.
Enjoying your TradingView experience? Review us!
Please be advised that the information presented on TradingView is provided to Vantage (‘Vantage Global Limited’, ‘we’) by a third-party provider (‘Everest Fortune Group’). Please be reminded that you are solely responsible for the trading decisions on your account. There is a very high degree of risk involved in trading. Any information and/or content is intended entirely for research, educational and informational purposes only and does not constitute investment or consultation advice or investment strategy. The information is not tailored to the investment needs of any specific person and therefore does not involve a consideration of any of the investment objectives, financial situation or needs of any viewer that may receive it. Kindly also note that past performance is not a reliable indicator of future results. Actual results may differ materially from those anticipated in forward-looking or past performance statements. We assume no liability as to the accuracy or completeness of any of the information and/or content provided herein and the Company cannot be held responsible for any omission, mistake nor for any loss or damage including without limitation to any loss of profit which may arise from reliance on any information supplied by Everest Fortune Group.