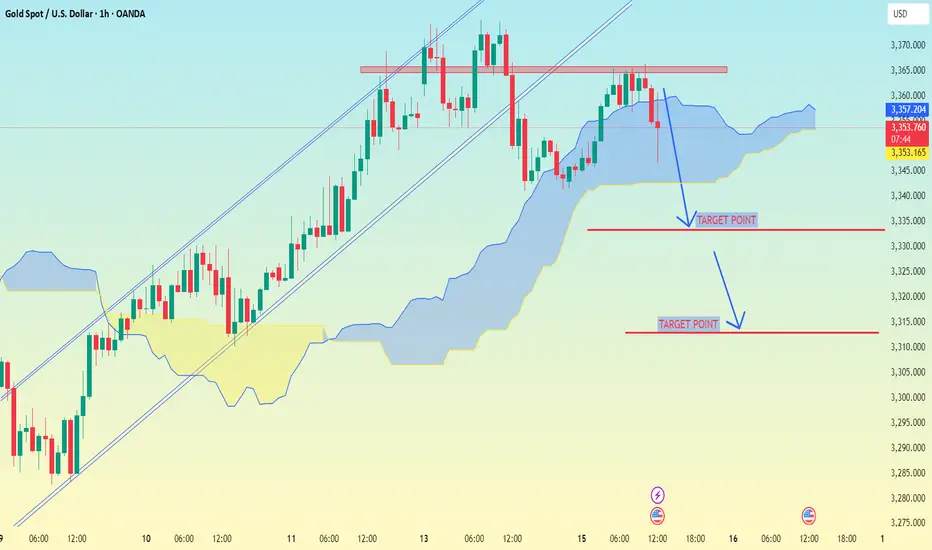
XAU/USD (Gold vs USD) on the 1-hour timeframe..XAU/USD (Gold vs USD) on the 1-hour timeframe, the setup clearly shows a bearish breakdown from an ascending channel, supported by Ichimoku Cloud analysis.
---
📉 Target Points (as marked on your chart):
1. First Target Point: Around $2,335
2. Second Target Point: Around $2,312
---
🔍 Analysis Breakdown:
Price has broken below the Ichimoku cloud – a bearish signal.
The ascending channel is broken to the downside.
Support zones and target levels are clearly marked:
The first target aligns with a previous support level.
The second target is a deeper support area, likely the base of the previous strong rally.
---
📌 Summary:
🥇 First Target: $2,335
🥈 Second Target: $2,312
📉 Bias: Bearish (continuation likely if momentum holds and no strong reversal signs appear)
Let me know if you want suggested stop-loss, entry confirmation ideas, or risk management tips.
Forex
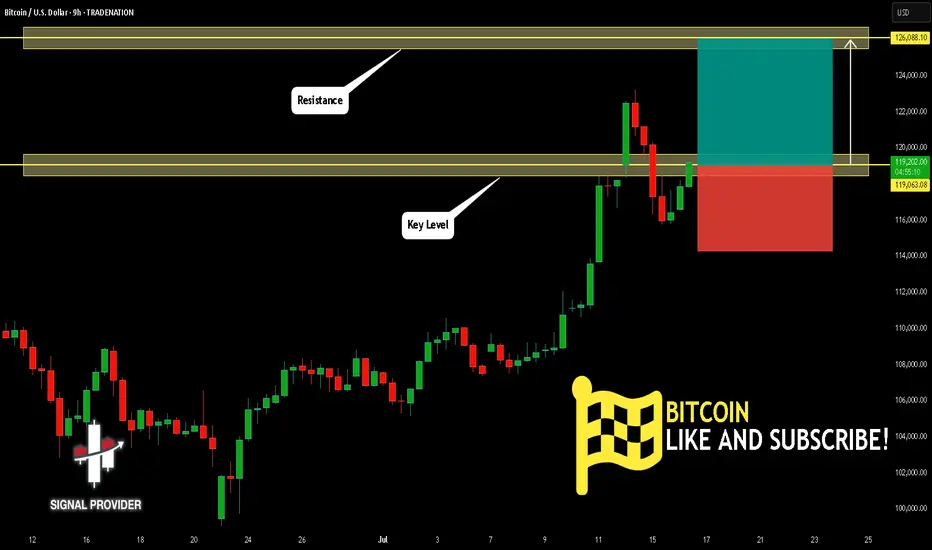
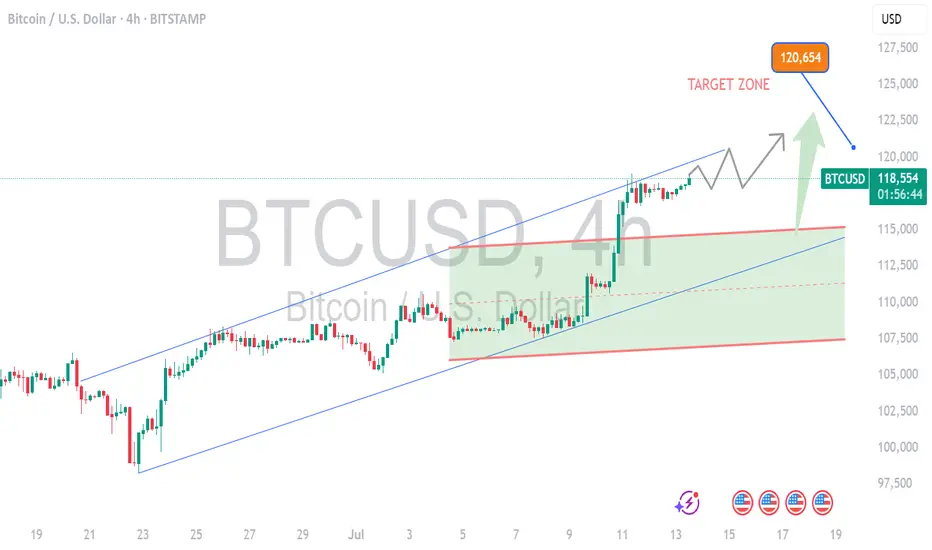
BITCOIN Will Go Higher! Long!
Here is our detailed technical review for BITCOIN.
Time Frame: 9h
Current Trend: Bullish
Sentiment: Oversold (based on 7-period RSI)
Forecast: Bullish
The market is trading around a solid horizontal structure 119,063.08.
The above observations make me that the market will inevitably achieve 126,088.10 level.
P.S
Overbought describes a period of time where there has been a significant and consistent upward move in price over a period of time without much pullback.
Disclosure: I am part of Trade Nation's Influencer program and receive a monthly fee for using their TradingView charts in my analysis.
Like and subscribe and comment my ideas if you enjoy them!
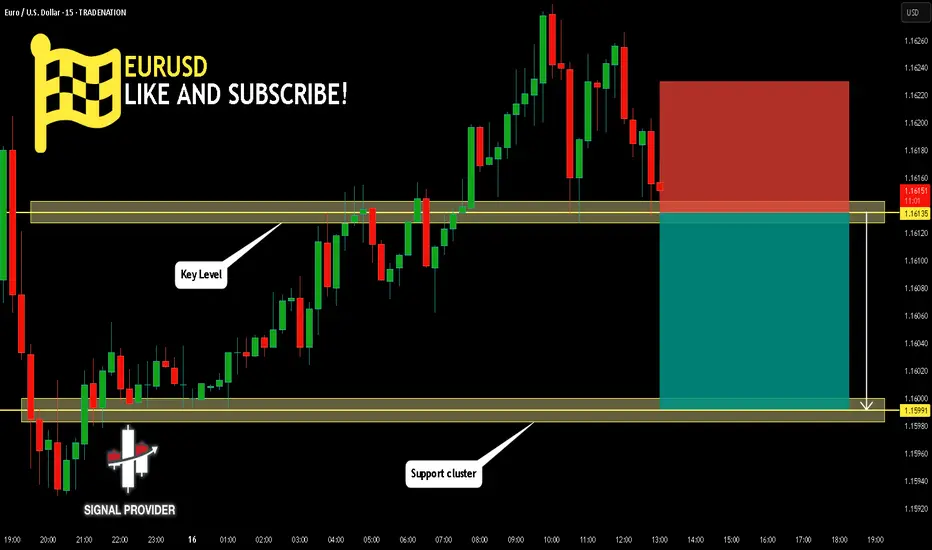
EURUSD Will Go Down! Short!
Take a look at our analysis for EURUSD.
Time Frame: 15m
Current Trend: Bearish
Sentiment: Overbought (based on 7-period RSI)
Forecast: Bearish
The market is testing a major horizontal structure 1.161.
Taking into consideration the structure & trend analysis, I believe that the market will reach 1.159 level soon.
P.S
Please, note that an oversold/overbought condition can last for a long time, and therefore being oversold/overbought doesn't mean a price rally will come soon, or at all.
Disclosure: I am part of Trade Nation's Influencer program and receive a monthly fee for using their TradingView charts in my analysis.
Like and subscribe and comment my ideas if you enjoy them!
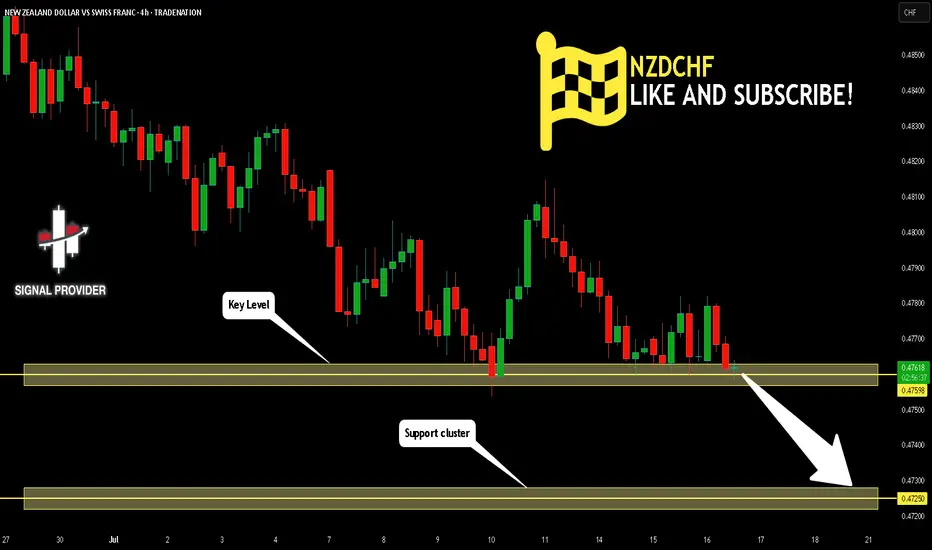
NZDCHF Will Move Lower! Sell!
Please, check our technical outlook for NZDCHF.
Time Frame: 4h
Current Trend: Bearish
Sentiment: Overbought (based on 7-period RSI)
Forecast: Bearish
The market is approaching a key horizontal level 0.475.
Considering the today's price action, probabilities will be high to see a movement to 0.472.
P.S
The term oversold refers to a condition where an asset has traded lower in price and has the potential for a price bounce.
Overbought refers to market scenarios where the instrument is traded considerably higher than its fair value. Overvaluation is caused by market sentiments when there is positive news.
Disclosure: I am part of Trade Nation's Influencer program and receive a monthly fee for using their TradingView charts in my analysis.
Like and subscribe and comment my ideas if you enjoy them!
GOLD Is Going Down! Short!
Please, check our technical outlook for GOLD.
Time Frame: 2h
Current Trend: Bearish
Sentiment: Overbought (based on 7-period RSI)
Forecast: Bearish
The price is testing a key resistance 3,363.11.
Taking into consideration the current market trend & overbought RSI, chances will be high to see a bearish movement to the downside at least to 3,342.15 level.
P.S
Please, note that an oversold/overbought condition can last for a long time, and therefore being oversold/overbought doesn't mean a price rally will come soon, or at all.
Disclosure: I am part of Trade Nation's Influencer program and receive a monthly fee for using their TradingView charts in my analysis.
Like and subscribe and comment my ideas if you enjoy them!

XAUUSD 16/07 – Temporary Rebound or Trap Before the Next Drop?XAUUSD 16/07 – Temporary Rebound or Trap Before the Next Drop?
🌍 Macro View – Calm Before the Volatility?
Gold is currently hovering around $3,334/oz after an aggressive sell-off earlier this week. While June's Core CPI data from the US came in lower than expected — easing immediate inflation concerns — the broader macro landscape remains far from stable:
New US tariffs are beginning to ripple through consumer prices.
Sectors like appliances and electronics are seeing early signs of inflation.
Shrinking inventories may lead to direct price pressures on consumers soon.
🔎 As the market digests these signals, gold remains a defensive play — but today's PPI release could flip sentiment quickly.
📉 Technical Outlook – Setup for a Deeper Pullback?
After CPI, gold retraced sharply and filled liquidity around 332x.
A clear Fair Value Gap (FVG) formed on the H1 chart, alongside a potential Continuation Pattern (CP) near 3347–3349.
Price action is likely to revisit the 334x–336x resistance zone, providing ideal short setups if rejection is confirmed.
🎯 Below lies a deep liquidity zone (FVG) near 3294, which could serve as the magnet for the next bearish move.
📊 Key Trade Zones to Watch
🔵 Buy Zone – Deep Liquidity Support: 3,296 – 3,294
SL: 3,290
TP: 3,300 → 3,304 → 3,308 → 3,312 → 3,316 → 3,320 → 3,330
🔴 Sell Scalp – CP Pattern Rejection: 3,347 – 3,349
SL: 3,353
TP: 3,343 → 3,340 → 3,336 → 3,330 → 3,325 → 3,320 → 3,310 → 3,300
🚨 Sell Zone – VPOC Level Resistance: 3,358 – 3,360
SL: 3,364
TP: 3,354 → 3,350 → 3,346 → 3,340 → 3,330 → 3,320 → 3,300
⚠️ What to Expect Today
All eyes are on the US PPI data, which could shake markets later in the session.
Look for a bullish fake-out during London or New York hours, especially toward 334x–336x zones.
Ideal strategy: wait for H1 candle confirmation before entering, and manage risk with clean TP/SL levels.
💬 Your Take?
Will gold revisit 329x this week, or are we setting up for a bullish reversal?
👇 Drop your thoughts in the comments and follow @MMFlowTrading for high-probability setups and macro insights — daily!

AUD/USD BEARS WILL DOMINATE THE MARKET|SHORT
Hello, Friends!
We are now examining the AUD/USD pair and we can see that the pair is going up locally while also being in a uptrend on the 1W TF. But there is also a powerful signal from the BB upper band being nearby, indicating that the pair is overbought so we can go short from the resistance line above and a target at 0.652 level.
Disclosure: I am part of Trade Nation's Influencer program and receive a monthly fee for using their TradingView charts in my analysis.
✅LIKE AND COMMENT MY IDEAS✅

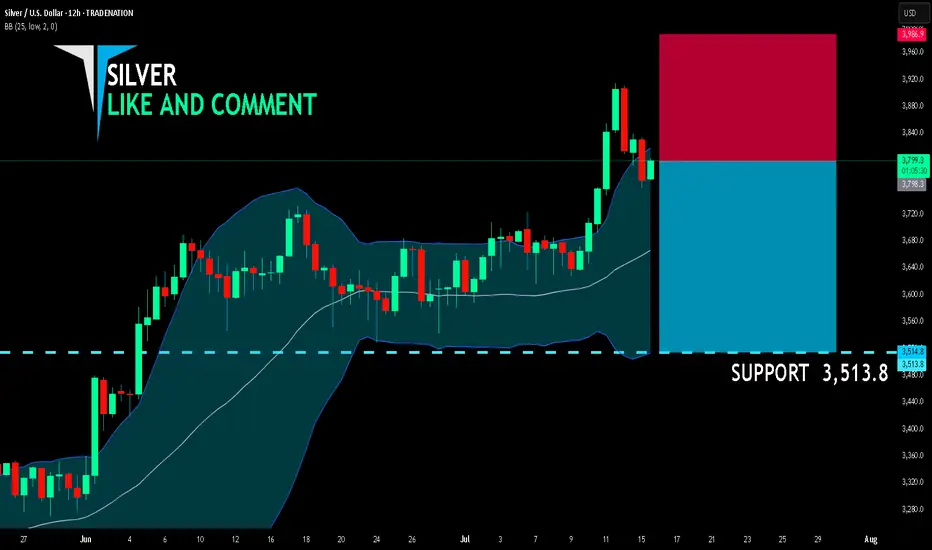
SILVER SELLERS WILL DOMINATE THE MARKET|SHORT
SILVER SIGNAL
Trade Direction: short
Entry Level: 3,798.3
Target Level: 3,513.8
Stop Loss: 3,986.9
RISK PROFILE
Risk level: medium
Suggested risk: 1%
Timeframe: 12h
Disclosure: I am part of Trade Nation's Influencer program and receive a monthly fee for using their TradingView charts in my analysis.
✅LIKE AND COMMENT MY IDEAS✅
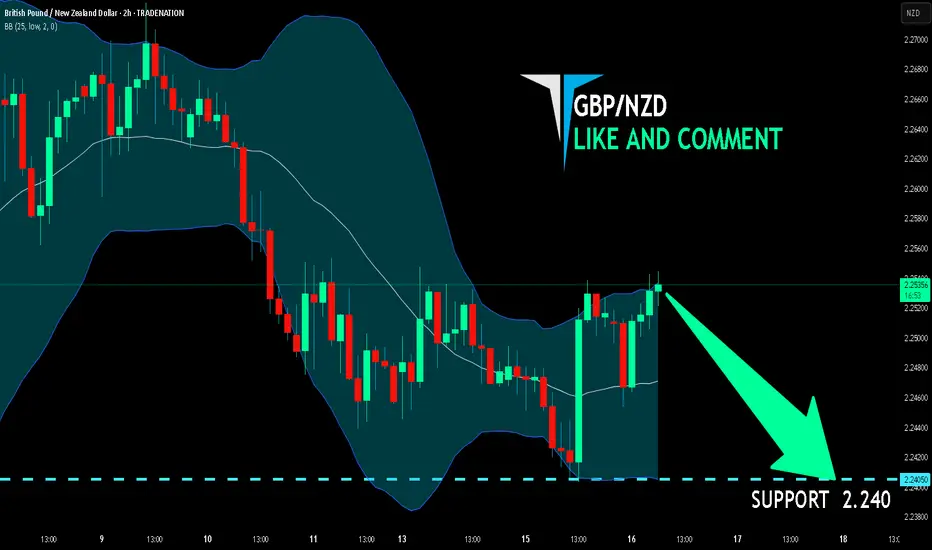
GBP/NZD BEST PLACE TO SELL FROM|SHORT
Hello, Friends!
It makes sense for us to go short on GBP/NZD right now from the resistance line above with the target of 2.240 because of the confluence of the two strong factors which are the general downtrend on the previous 1W candle and the overbought situation on the lower TF determined by it’s proximity to the upper BB band.
Disclosure: I am part of Trade Nation's Influencer program and receive a monthly fee for using their TradingView charts in my analysis.
✅LIKE AND COMMENT MY IDEAS✅
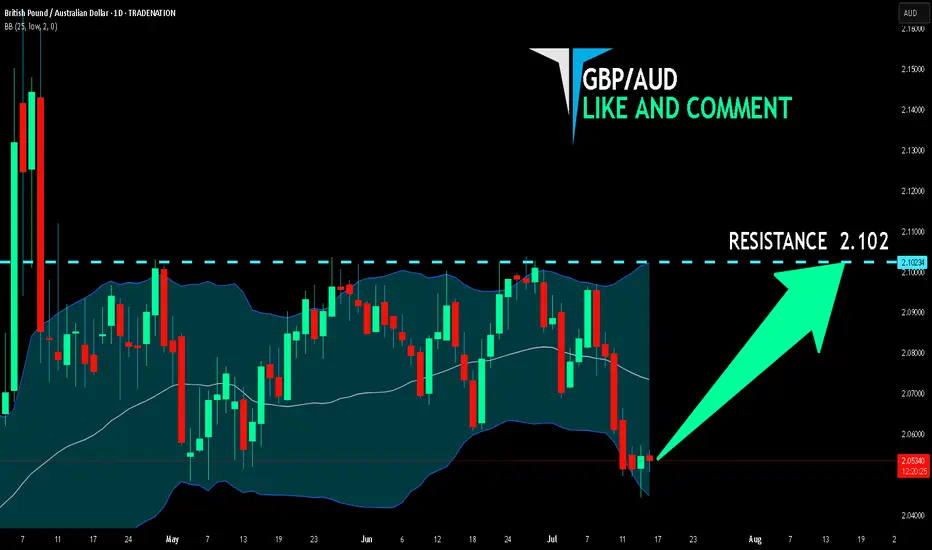
GBP/AUD BULLS ARE STRONG HERE|LONG
Hello, Friends!
Previous week’s red candle means that for us the GBP/AUD pair is in the downtrend. And the current movement leg was also down but the support line will be hit soon and lower BB band proximity will signal an oversold condition so we will go for a counter-trend long trade with the target being at 2.102.
Disclosure: I am part of Trade Nation's Influencer program and receive a monthly fee for using their TradingView charts in my analysis.
✅LIKE AND COMMENT MY IDEAS✅
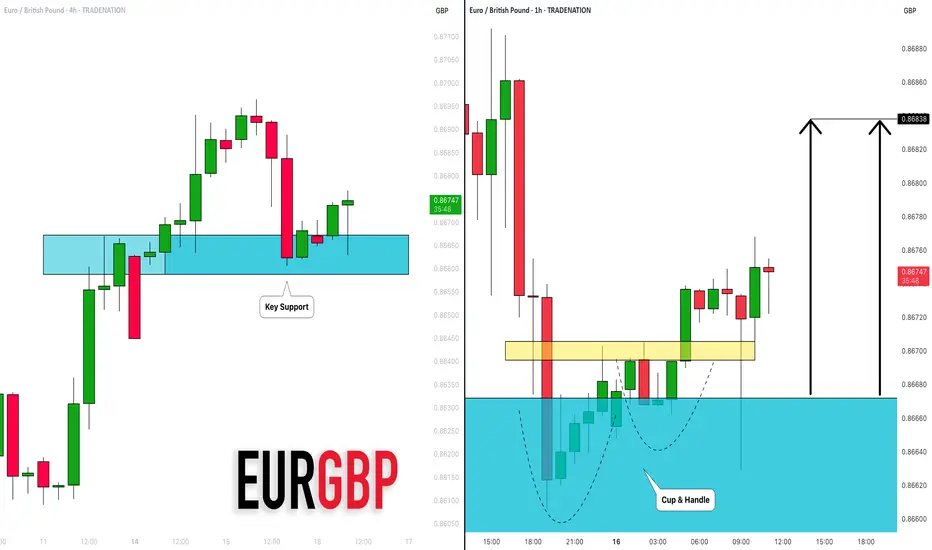
EURGBP: Bullish Move From Support Confirmed?! 🇪🇺🇬🇧
There is a high chance that EURGBP will bounce
from a key intraday horizontal support cluster.
The market looks bullish after UK CPI release this morning.
Goal - 0.8684
❤️Please, support my work with like, thank you!❤️
I am part of Trade Nation's Influencer program and receive a monthly fee for using their TradingView charts in my analysis.
BITCOIN NEXT TARGET 1205001. Professional & Direct:
BTC Long in Play – Eyes on 120,500 🔥
Momentum building strong. Stay in the trend — next target: 120.5K.
---
2. TradingView Style (Engaging):
Bitcoin Bulls Gaining Strength 🚀
Long position active. Targeting next major level at $120,500 — hold tight!
---
3. VIP Signal Tone:
BTC BUY Signal Active ✅
We’re riding the wave to $120,500. Strong confirmation on higher timeframes.
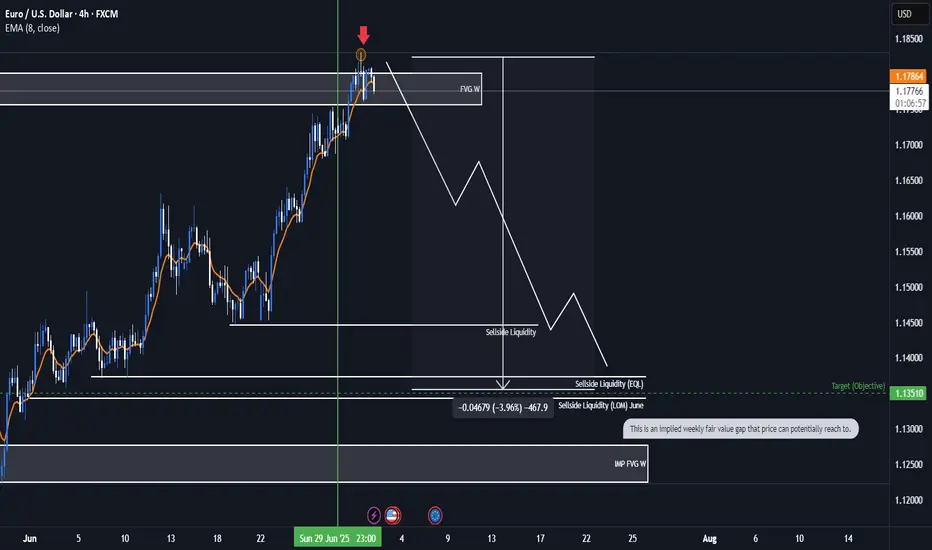
EURUSD Bearish ideaWe are in a weekly fair value gap that we have balance and potentially collected orders to prepare for a potential drop in price. We are anticipating a quarterly shift for the month of July were we could be targeting downside liquidity that is in open float.
* Fundamentals:
-Interest rate differentials shows us that USD interest rate of 4.5 is higher than the interest rate EUR 2.15 which lead to the longer fundamental frame work of price correcting to the higher dollar rate to the euro.
-The COT report also indicates to us that there is huge buying of Dollar by the commercials and a huge amount of selling of the EUR by commercials which can lead us to assume potential weaker dollar.
*Targeting:
-We are looking for the low of last month (June) to be taken out as well as even potentially reaching to the implied weekly fair value gap.
Trend Line Tested Twice Is AUD/USD Ready to Rally?📈 AUD/USD Market Insight – Potential Bullish Breakout Ahead?
The AUD/USD pair has respected a key trend line, bouncing off it for the second time — a sign of potential strength. If the price revisits and successfully retests this trend line, we could see a bullish momentum (a pump) play out.
On the flip side, if the pair maintains its current trajectory without pulling back, focus shifts to the 0.65415–0.65455 resistance zone. A clean breakout above this range could open the doors for a move higher — potentially targeting swing highs and key liquidity zones.
🚀 Watch closely — the next move could be significant.
🔎 Always DYOR (Do Your Own Research). This is not financial advice.

US30Y Bullish ideaThis is a potential idea of the 30 year bond yield potentially having movement to the upside. We have already reached into a daily volume imbalance and weekly volume imbalance. We also have a monthly order block that is acting as support combined with our volume imbalance levels. We also have relative strength with the US30Y against the US10Y and US5Y. Could be a potential idea to look for bullish ideas with the the fact that we are in a potential point were we could have a Quarterly shift.
*Targeting
A move to the upside were we have buyside liquidity and the 4H fair value gap.

Gold has bounced back after tapping into the Fair Value Gap.📈 Gold Market Daily Outlook 💰
Gold has bounced back after tapping into the Fair Value Gap (FVG) and clearing liquidity below recent lows.
🔥 Price is now heading into a key bearish FVG zone on the 4H chart.
📊 Key Level to Watch:
If $3339 breaks with strong bullish momentum, we could see a further push towards $3350 and beyond.
⚠️ Reminder:
This is not financial advice — always DYOR (Do Your Own Research)!
