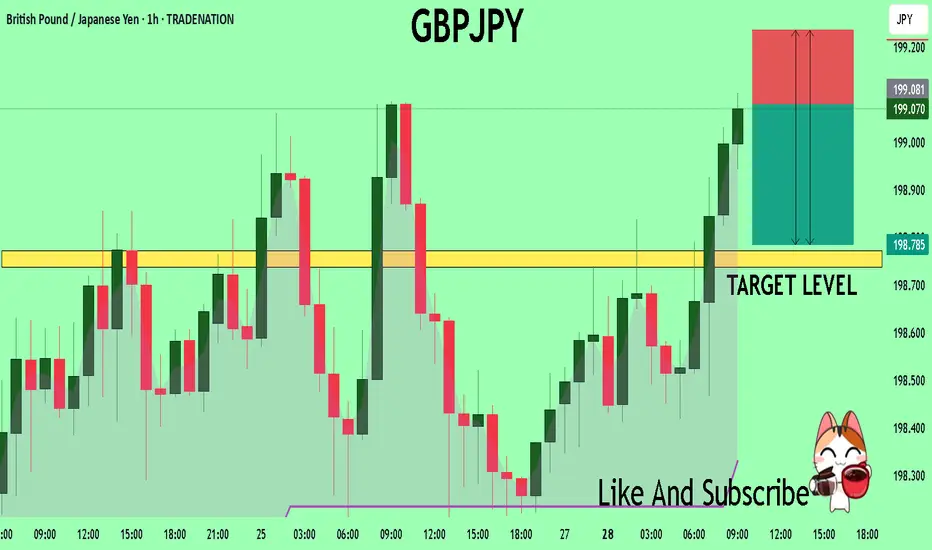
GBPJPY What Next? SELL!
My dear friends,
Please, find my technical outlook for GBPJPY below:
The price is coiling around a solid key level - 199.08
Bias - Bearish
Technical Indicators: Pivot Points Low anticipates a potential price reversal.
Super trend shows a clear sell, giving a perfect indicators' convergence.
Goal - 198.77
Safe Stop Loss - 199.23
About Used Indicators:
The pivot point itself is simply the average of the high, low and closing prices from the previous trading day.
Disclosure: I am part of Trade Nation's Influencer program and receive a monthly fee for using their TradingView charts in my analysis.
———————————
WISH YOU ALL LUCK
Forex
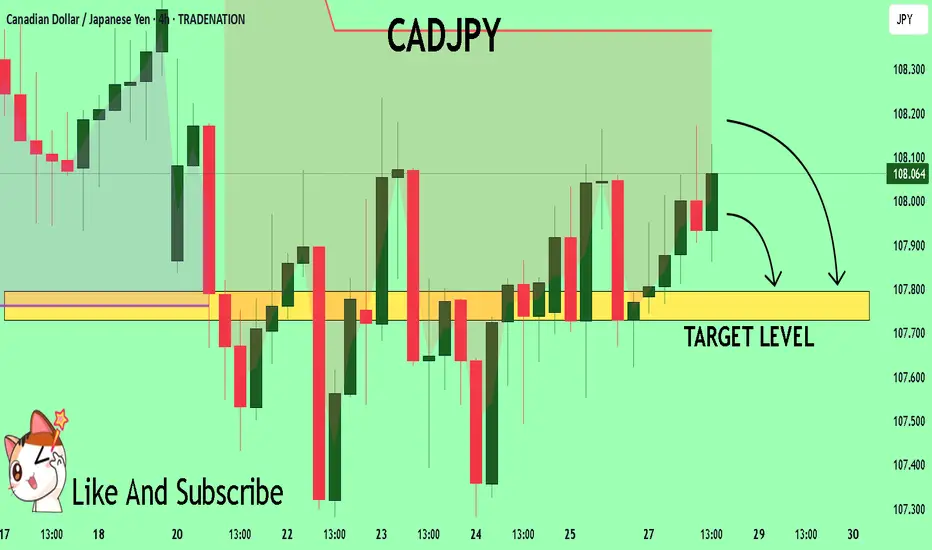
CADJPY Trading Opportunity! SELL!
My dear followers,
I analysed this chart on CADJPY and concluded the following:
The market is trading on 108.08 pivot level.
Bias - Bearish
Technical Indicators: Both Super Trend & Pivot HL indicate a highly probable Bearish continuation.
Target - 107.79
About Used Indicators:
A super-trend indicator is plotted on either above or below the closing price to signal a buy or sell. The indicator changes color, based on whether or not you should be buying. If the super-trend indicator moves below the closing price, the indicator turns green, and it signals an entry point or points to buy.
Disclosure: I am part of Trade Nation's Influencer program and receive a monthly fee for using their TradingView charts in my analysis.
———————————
WISH YOU ALL LUCK
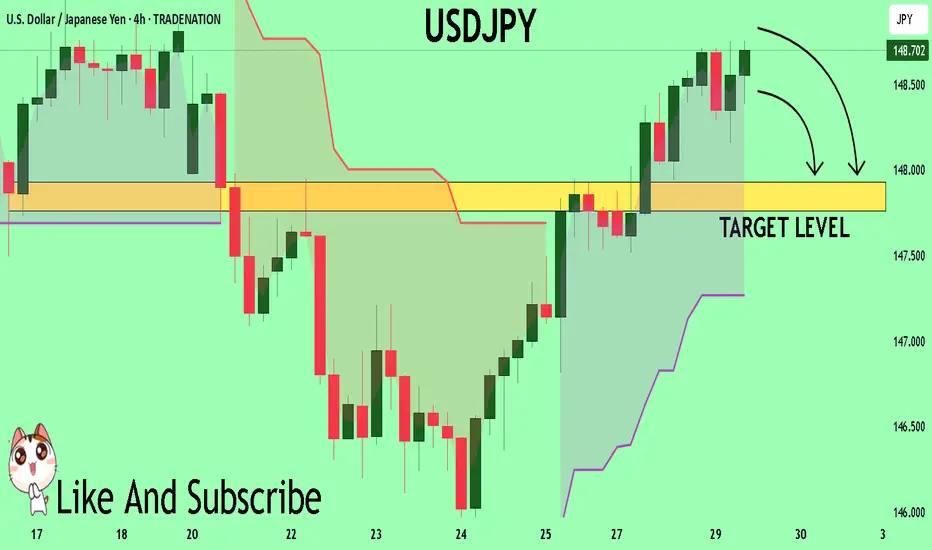
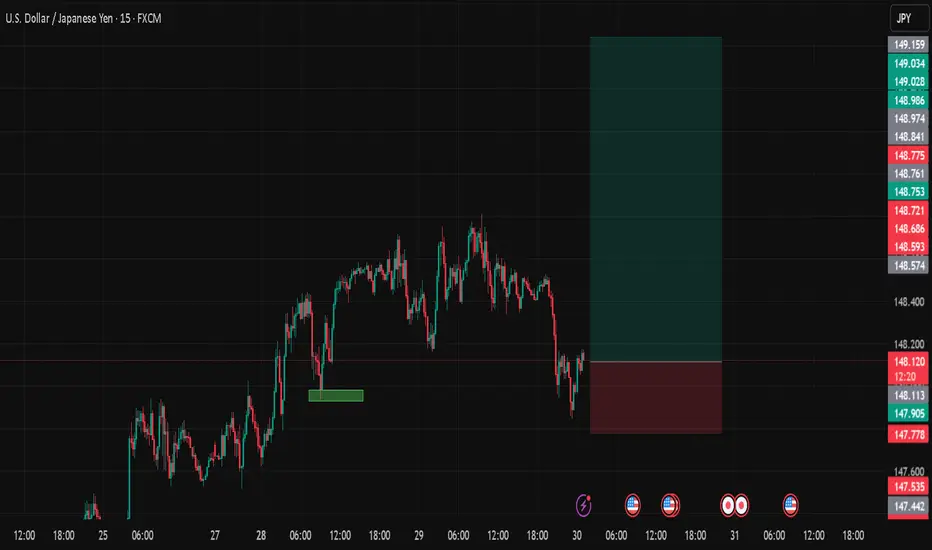
USDJPY A Fall Expected! SELL!
My dear subscribers,
My technical analysis for USDJPY is below:
The price is coiling around a solid key level - 148.71
Bias - Bearish
Technical Indicators: Pivot Points Low anticipates a potential price reversal.
Super trend shows a clear sell, giving a perfect indicators' convergence.
Goal - 147.93
About Used Indicators:
By the very nature of the supertrend indicator, it offers firm support and resistance levels for traders to enter and exit trades. Additionally, it also provides signals for setting stop losses
Disclosure: I am part of Trade Nation's Influencer program and receive a monthly fee for using their TradingView charts in my analysis.
———————————
WISH YOU ALL LUCK
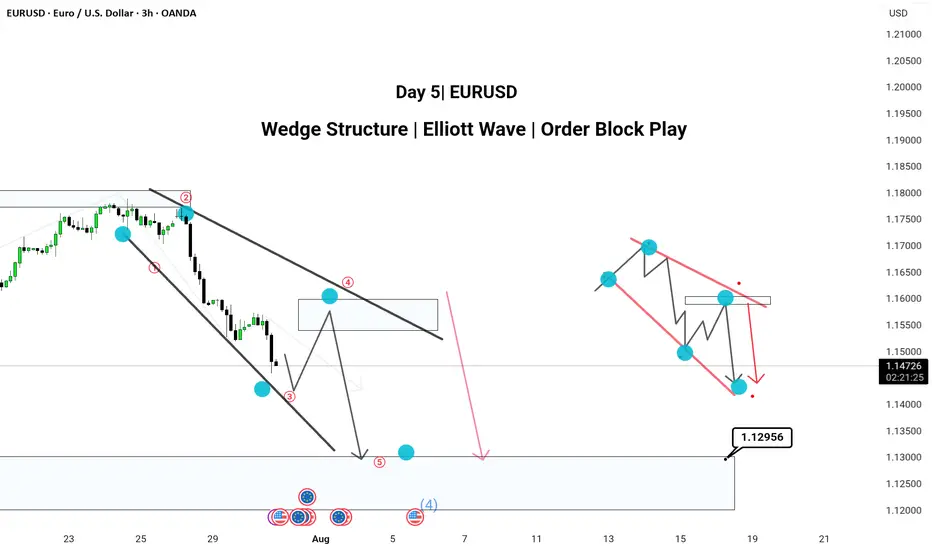
Pattern: Wedge Structure | Elliott Wave | Order Block PlayHere’s a powerful and professional description you can use when publishing this chart on TradingView:
---
🔻 Day 4 | EUR/USD Analysis 🔻
Chart Type: 3H Timeframe
---
📌 Chart Breakdown:
EUR/USD is respecting a textbook XABCD wedge pattern with clean Elliott Wave structure forming inside.
We’ve marked 5 key waves (1–5) completing within a falling wedge, aligning with a 50–60% retracement (Golden Zone) between point A and D.
🧠 Most traders miss the Golden Zone, but it’s often the clearest sign of upcoming trend continuation. Here, that continuation is bearish.
---
✅ 3H Confluence Factors:
Wedge forming within a larger downtrend
Multiple Break of Structures (BOS) confirming bearish momentum
Price targeting 1.12956 zone (mapped order block)
Elliott Wave fractals confirmed within structure
Hidden supply zone respected at Wave 4
---
📉 Expecting:
Retracement to supply → drop toward demand zone near 1.12956
---
📎 Strategy Insight:
SMC + Elliott Wave + Multi-timeframe path tool mapping gives us high confluence to expect continuation into the demand area.
💬 Comment below your views —
Do you also trade Wedges with Elliott Wave confirmation?
#EURUSD #WedgePattern #ElliottWave #SmartMoneyConcepts #OrderBlock #TechnicalAnalysis #TradingView #ForexIndia
---
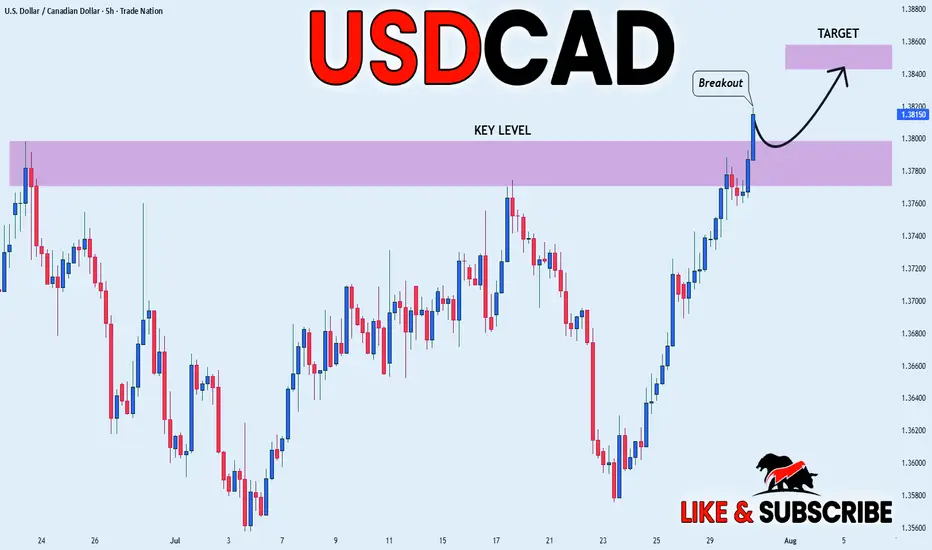
USD_CAD BULLISH BREAKOUT|LONG|
✅USD_CAD is going up
Now and the pair made a bullish
Breakout of the key horizontal
Level of 1.3800 and the breakout
Is confirmed so we are bullish
Biased and we will be expecting
A further bullish move up
LONG🚀
✅Like and subscribe to never miss a new idea!✅
Disclosure: I am part of Trade Nation's Influencer program and receive a monthly fee for using their TradingView charts in my analysis.
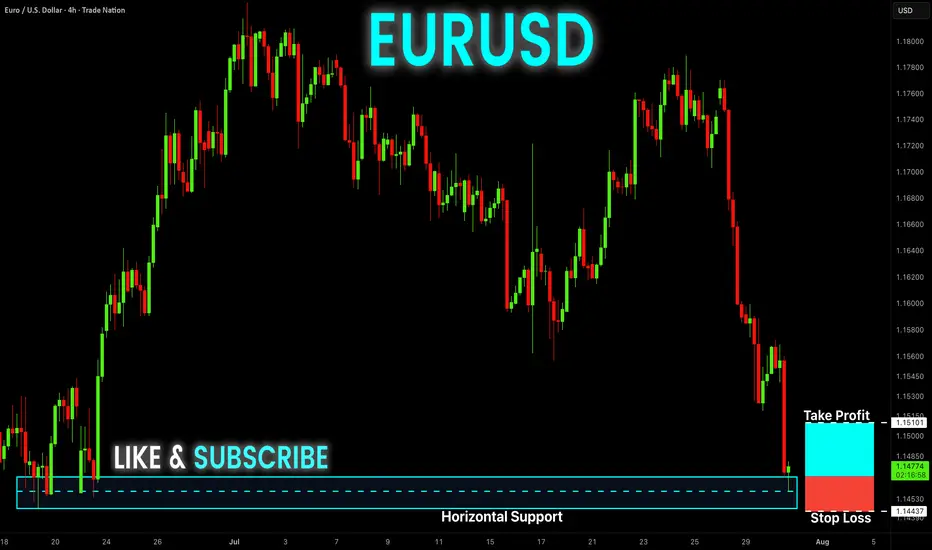
EUR-USD Free Signal! Buy!
Hello,Traders!
EUR-USD keeps falling and
The pair is locally oversold so
As the pair is retesting the
Horizontal support level
Of 1.1468 we can enter a
Long trade with Take Profit
Of 1.1510 and Stop Loss
Of 1.1443
Buy!
Comment and subscribe to help us grow!
Check out other forecasts below too!
Disclosure: I am part of Trade Nation's Influencer program and receive a monthly fee for using their TradingView charts in my analysis.
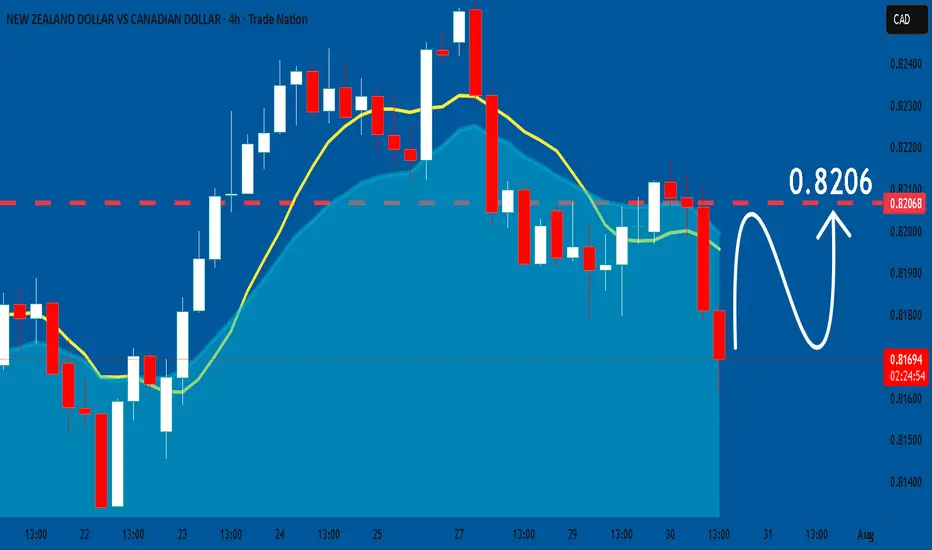
NZDCAD: Bullish Continuation is Expected! Here is Why:
The analysis of the NZDCAD chart clearly shows us that the pair is finally about to go up due to the rising pressure from the buyers.
Disclosure: I am part of Trade Nation's Influencer program and receive a monthly fee for using their TradingView charts in my analysis.
❤️ Please, support our work with like & comment! ❤️
USDJPYDate:
July 30,2025
Session:
Asia and Sydney Session
Pair:
USDJPY
Bias:
Long
Liquid from Mondays New york open swept now price wants to follow trend
Entry: 148.108
Stop Loss: 147.778
Target: 149.640
RR: 4.57
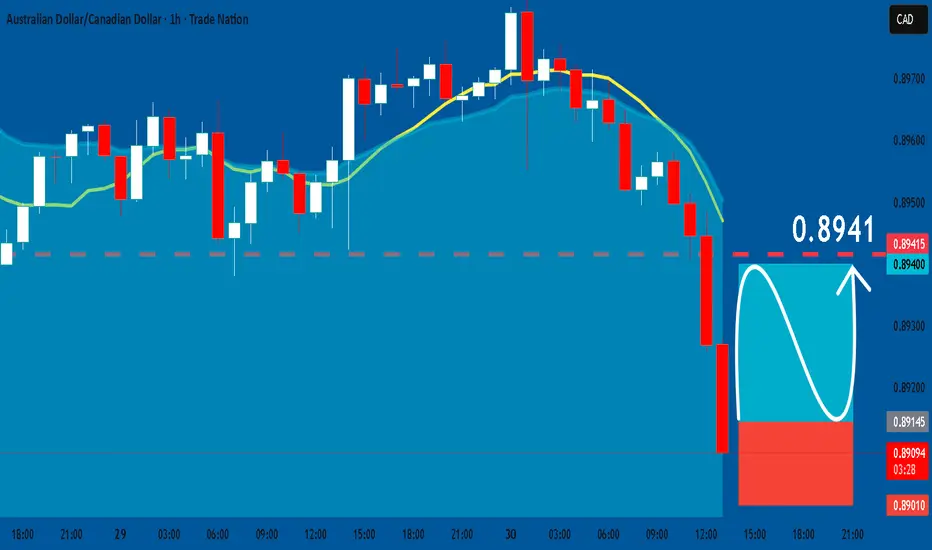
AUDCAD: Long Trade Explained
AUDCAD
- Classic bullish formation
- Our team expects pullback
SUGGESTED TRADE:
Swing Trade
Long AUDCAD
Entry - 0.8914
Sl - 0.8901
Tp - 0.8941
Our Risk - 1%
Start protection of your profits from lower levels
Disclosure: I am part of Trade Nation's Influencer program and receive a monthly fee for using their TradingView charts in my analysis.
❤️ Please, support our work with like & comment! ❤️
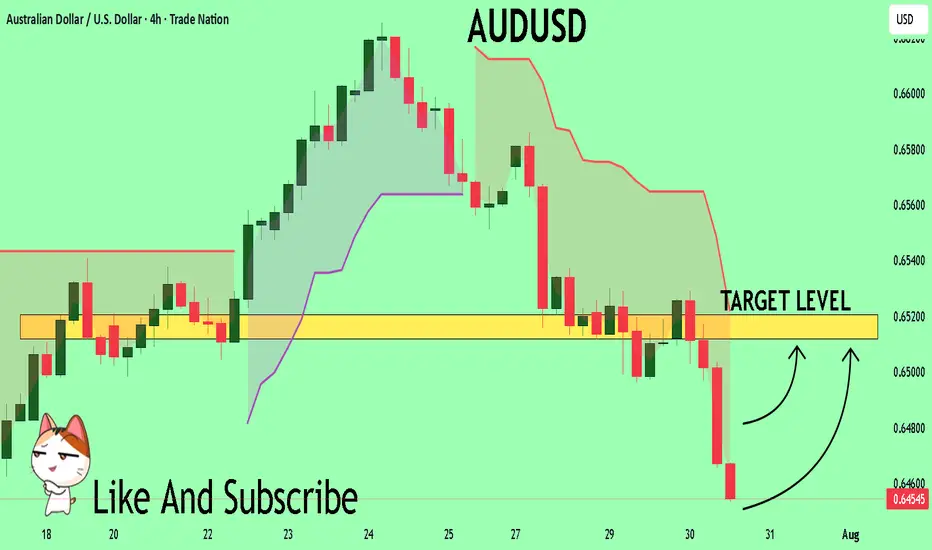
AUDUSD My Opinion! BUY!
My dear subscribers,
AUDUSD looks like it will make a good move, and here are the details:
The market is trading on 0.6455 pivot level.
Bias - Bullish
Technical Indicators: Both Super Trend & Pivot HL indicate a highly probable Bullish continuation.
Target - 0.6512
About Used Indicators:
The average true range (ATR) plays an important role in 'Supertrend' as the indicator uses ATR to calculate its value. The ATR indicator signals the degree of price volatility.
Disclosure: I am part of Trade Nation's Influencer program and receive a monthly fee for using their TradingView charts in my analysis.
———————————
WISH YOU ALL LUCK
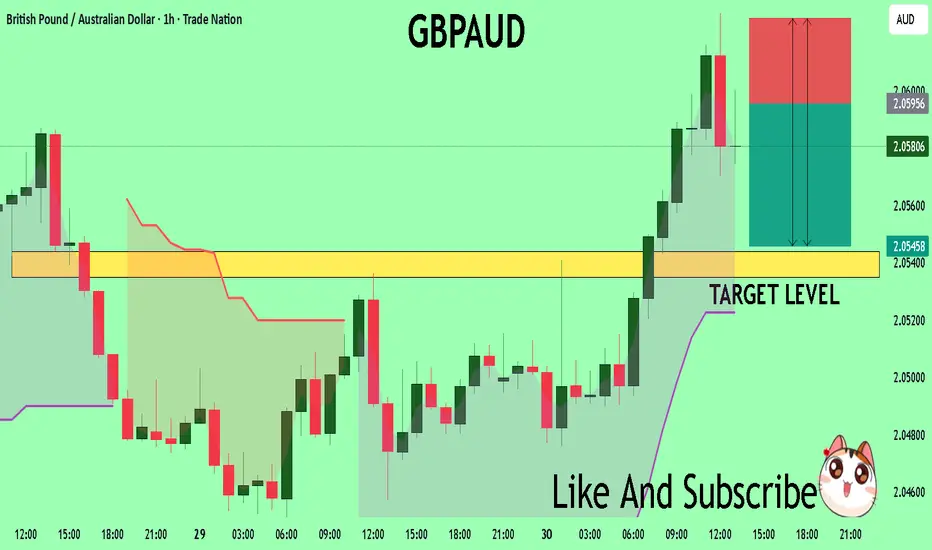
GBPAUD Massive Short! SELL!
My dear subscribers,
My technical analysis for GBPAUDis below:
The price is coiling around a solid key level - 2.0596
Bias - Bearish
Technical Indicators: Pivot Points Low anticipates a potential price reversal.
Super trend shows a clear sell, giving a perfect indicators' convergence.
Goal - 2.0543
My Stop Loss - 2.0626
About Used Indicators:
By the very nature of the supertrend indicator, it offers firm support and resistance levels for traders to enter and exit trades. Additionally, it also provides signals for setting stop losses
Disclosure: I am part of Trade Nation's Influencer program and receive a monthly fee for using their TradingView charts in my analysis.
———————————
WISH YOU ALL LUCK
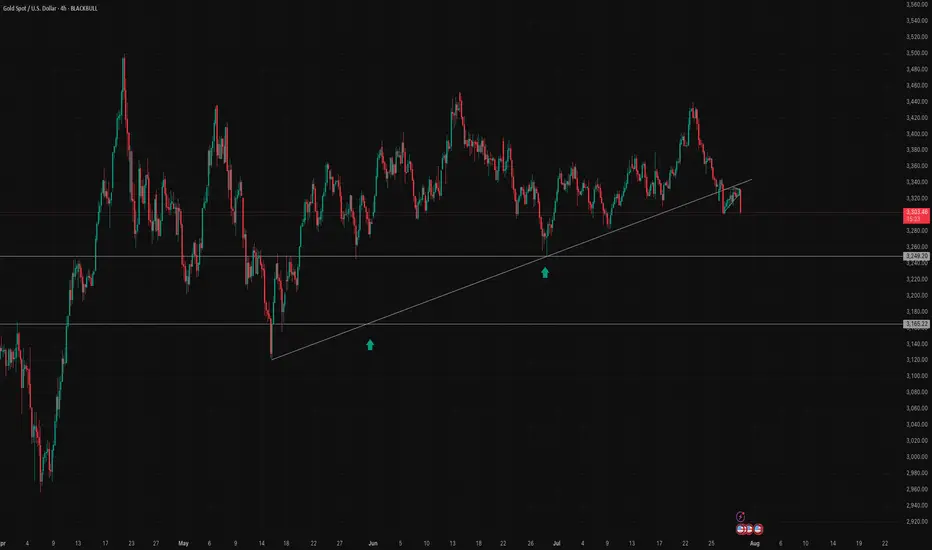
Gold (XAUUSD) Breaks Trendline – Potential Downside Ahead?Gold (XAU/USD) has officially broken below a long-term ascending trendline on the 4H chart, indicating a potential shift in market structure. The recent breakout from a bear flag pattern confirms bearish momentum, and price is now approaching a key horizontal support zone around $3,249 and $3,242.
🔹 Trendline support (now resistance) broken
🔹 Bear flag breakdown – strong bearish candle
🔹 Eyes on support levels: $3,249, $3,165, and possibly lower
🔹 Watch for a potential retest of the broken trendline for short opportunities
A clean break and close below $3,249 could open the door for further downside in the coming sessions. Trade cautiously and manage your risk!
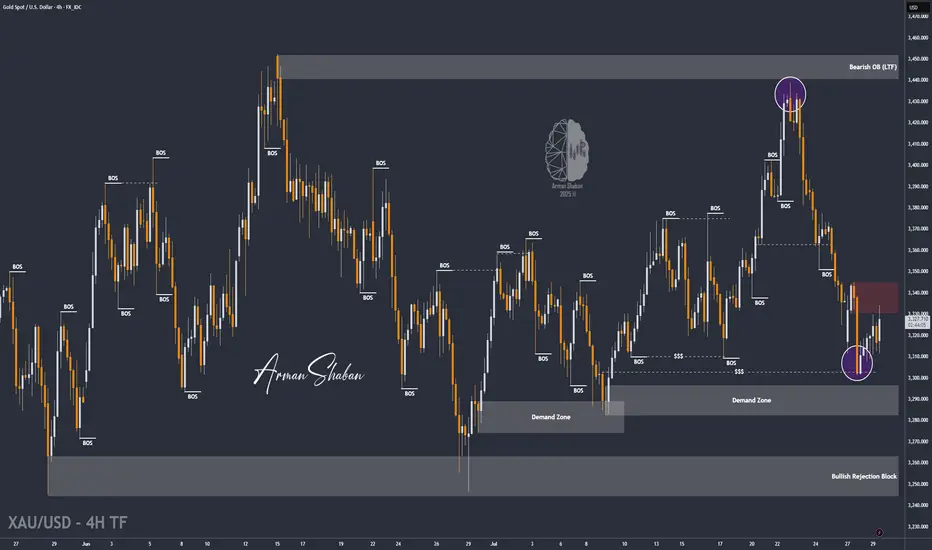
XAU/USD | Gold Below $3345 – Key Demand Awaits at $3282–$3296!By analyzing the gold chart on the 4-hour timeframe, we can see that after dropping to the $3301 area, strong demand came in, helping the price stabilize above $3300 and rally up to over $3334. Currently, gold is trading around $3331. If the price fails to break and hold above $3345 within the next 8 hours, we may see a price correction soon. A key demand zone lies between $3282–$3296, where a strong bullish reaction could occur if price revisits this area. Important supply levels to watch are $3366, $3382, $3393, and $3404.
Please support me with your likes and comments to motivate me to share more analysis with you and share your opinion about the possible trend of this chart with me !
Best Regards , Arman Shaban
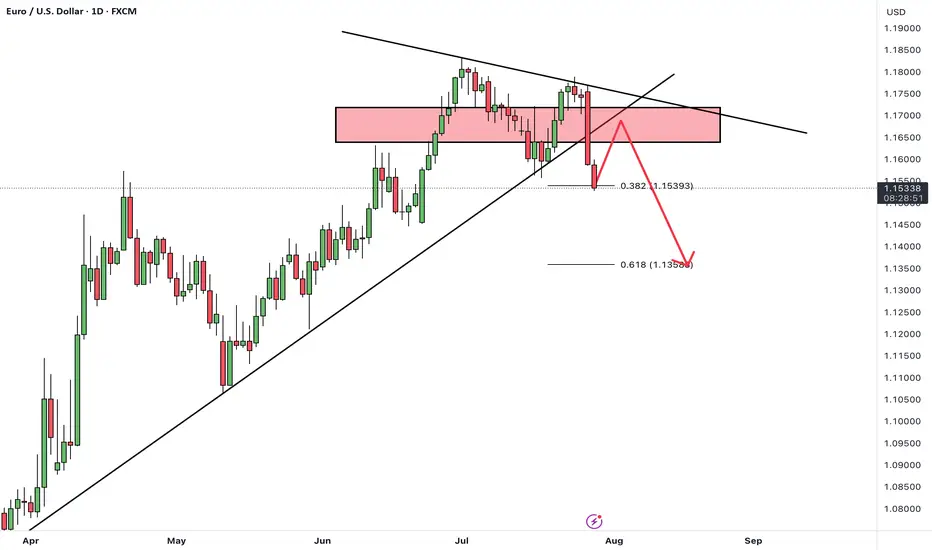
EURUSDHello Traders! 👋
What are your thoughts on EURUSD?
EUR/USD kicked off the week with a sharp drop of nearly 200 pips, driven by renewed concerns over U.S. tariff policies. This strong bearish momentum signals intensified selling pressure across the board.
The pair is now approaching a support zone, which has previously triggered bullish reactions.
However, given the current strong bearish sentiment, there is a real risk this support may not hold.
Our bias remains bearish overall.
If the pair finds temporary support at this level, a short-term corrective bounce is possible.
But ultimately, we expect a continuation of the downtrend toward lower support levels after the correction completes.
Can this support zone stop the bleeding, or is more downside coming? Let us know your thoughts! 👇
Don’t forget to like and share your thoughts in the comments! ❤️
Gold’s Liquidity Hunt Eyes on Bullish FVG Reaction!Gold Analysis – NY Session Outlook
During the New York session, gold created equal highs near recent swing highs, indicating that upside liquidity remains uncollected. Currently, the market is pulling back, targeting liquidity resting below the trendline, along with internal liquidity levels beneath.
If gold continues to move downward and taps into the marked bullish Fair Value Gap (FVG), monitor that zone for any signs of bullish confirmation. If confirmed, there is potential for a further upward move toward the equal highs and beyond, aiming for external liquidity.
Always Do Your Own Research (DYOR).

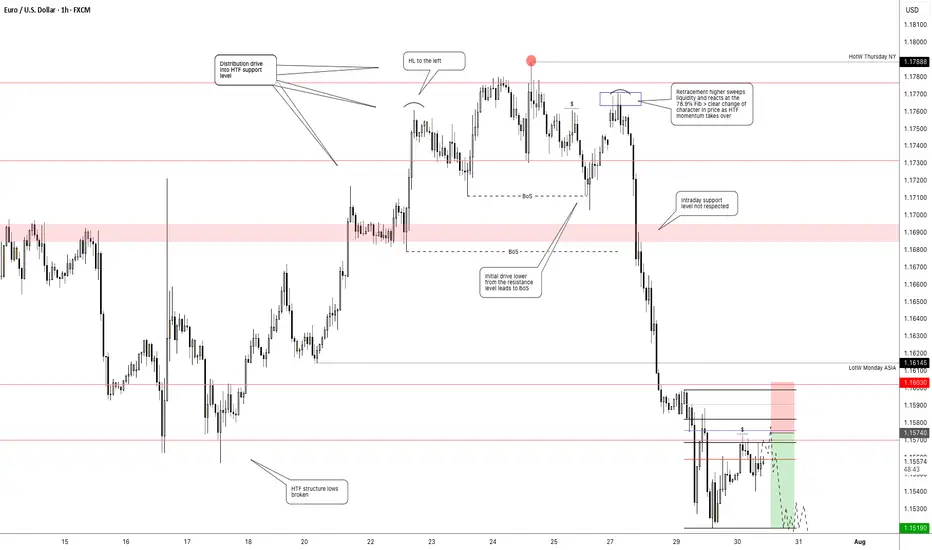
Getting short on EUR/USD!The dollar has looked set for a reversal and coming into the week it didn't hang around at all. I had a bit of a short bias on EUR/USD and was looking for confirmation signal which pretty much came at market open.
Price pushed higher back into the key level taking out a short term high, but was unable to follow through to form a new higher high. Heading into Monday London session, momentum immediately took hold with a clear bearish change of character and price didn't look back > breaking structure and key levels with minimal effort.
I was waiting for a pull back to get short early which didn't occur. But no need to chase price, waiting and patience is part of the game.
Price has now broken another key support level and is set to retest it as resistance. This will be my entry point (see screenshot) > using the 70.5%-78.6% fib retracement level and my stop above Tuesdays high. Keep it simple.
tradingview.sweetlogin.com/proxy-s3
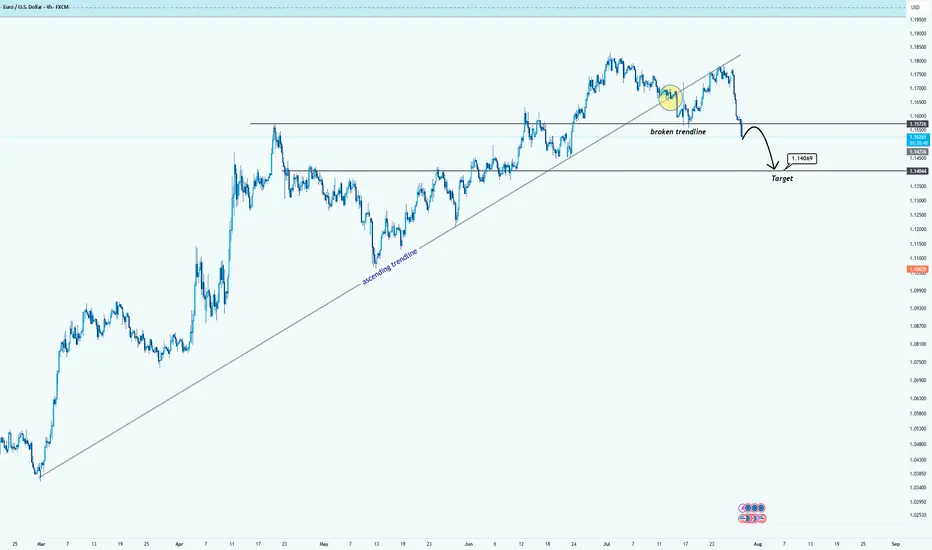
EURUSD Breaks Trendline: Bearish Momentum in PlayHello guys!
After months of climbing steadily along the ascending trendline, EURUSD has finally broken below support. The trendline breach, followed by a tight consolidation (yellow circle), hinted at a loss of bullish strength, and now the breakdown is in full motion.
Broken ascending trendline
Clear rejection after retest
Bearish continuation underway
Target area: 1.1400–1.1440 zone
If sellers maintain control, the price could descend toward the next major demand area.
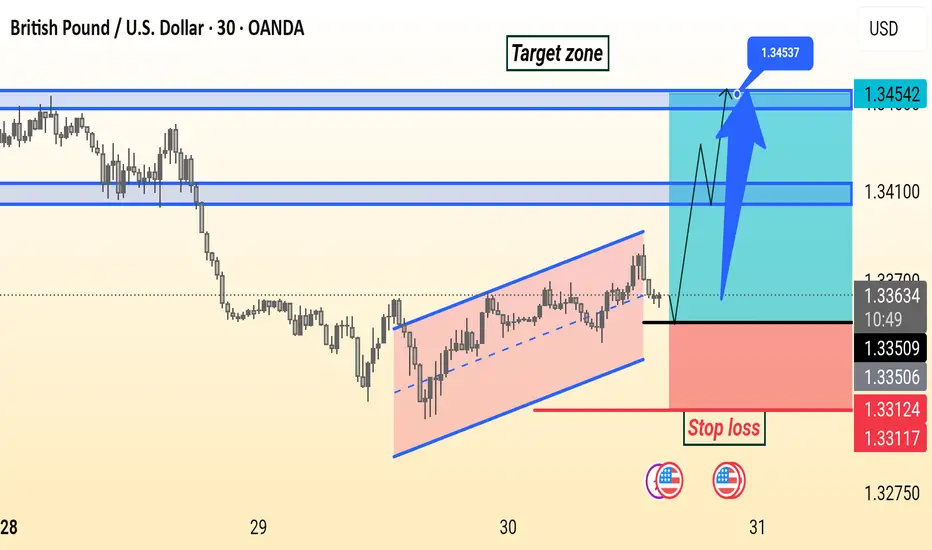
GBPUSD Setup GBP/USD is forming a bullish channel on the 30-minute chart. Price is expected to break above resistance near 1.3365, targeting the 1.3455 zone. Stop loss is set below the channel at 1.3312.
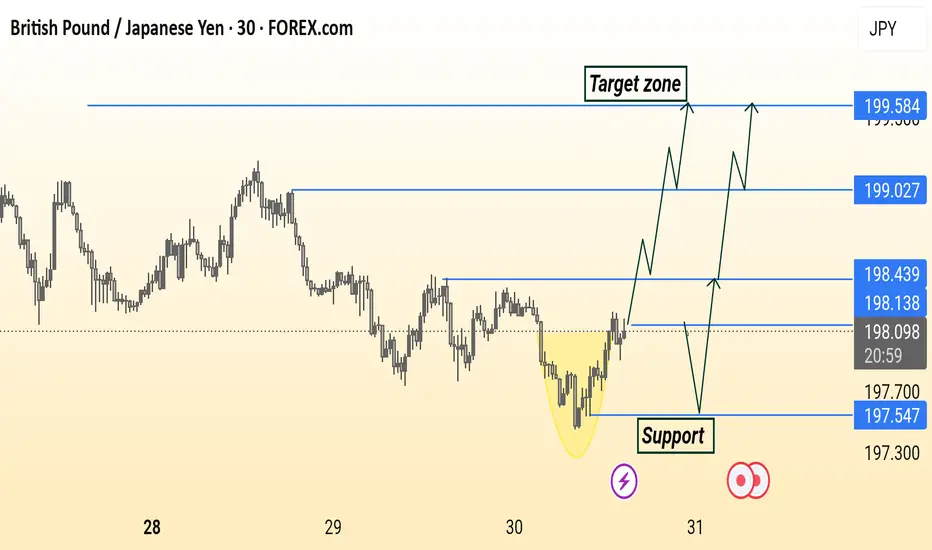
GBP/JPY Analysis is Ready Read The Captions GBP/JPY 30-minute chart shows a potential bullish reversal from a rounded bottom pattern. Price is approaching support around 198.13–197.54, with multiple possible bullish scenarios targeting resistance levels at 198.43, 199.03, and 199.58. The highlighted “Target zone” suggests a continuation if price breaks and holds above key resistance.
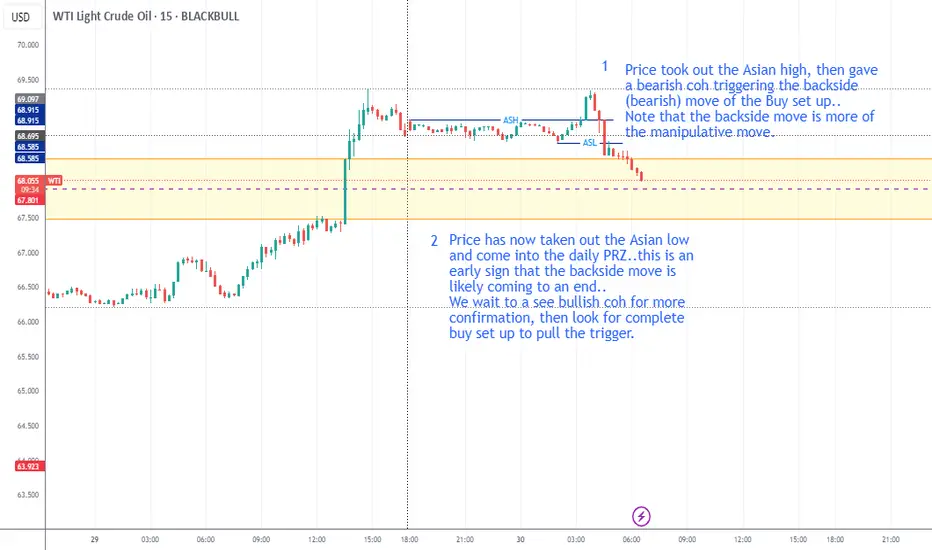
WTI is up on my radarPrice closed above daily GM, travelled, and now retraced back to the GM..
For now, I'll be BULLISH biased and look for Buy setup on the lower time frames..
Price took out the Asian high, then gave a bearish coh triggering the backside (bearish) move of the Buy set up..
Note that the backside move is more of the manipulative move.
Price has now taken out the Asian low and come into the daily PRZ..this is an early sign that the backside move is likely coming to an end..
We wait to a see bullish coh for more confirmation, then look for complete buy set up to pull the trigger.
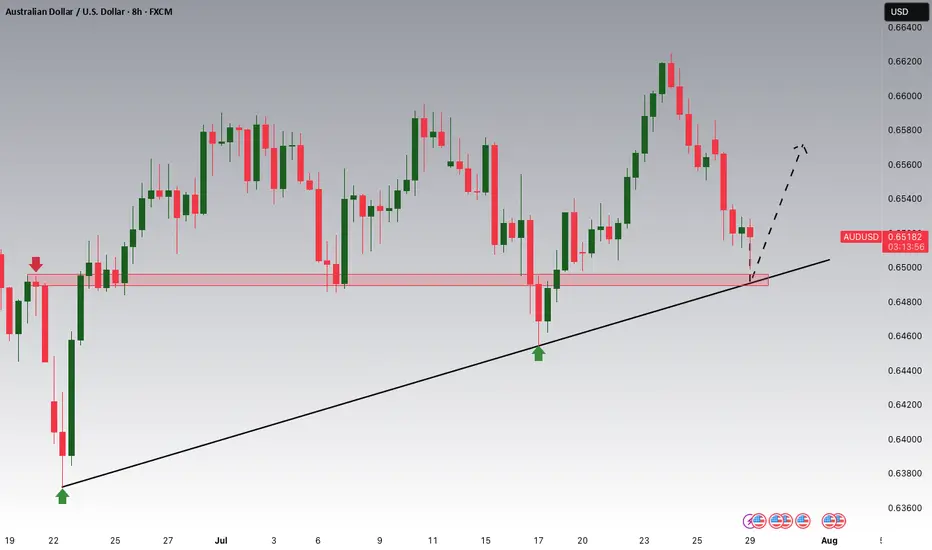
AUDUSD Potential UpsidesHey Traders, in today's trading session we are monitoring AUDUSD for a buying opportunity around 0.64900 zone, AUDUSD is trading in an uptrend and currently is in a correction phase in which it is approaching the trend at 0.64900 support and resistance area.
Trade safe, Joe.
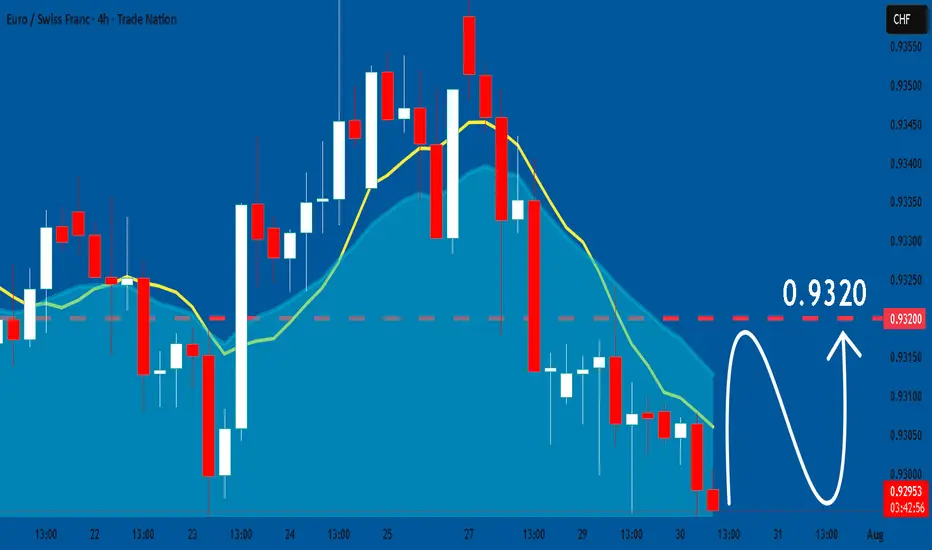
EURCHF: Market of Buyers
Looking at the chart of EURCHF right now we are seeing some interesting price action on the lower timeframes. Thus a local move up seems to be quite likely.
Disclosure: I am part of Trade Nation's Influencer program and receive a monthly fee for using their TradingView charts in my analysis.
❤️ Please, support our work with like & comment! ❤️
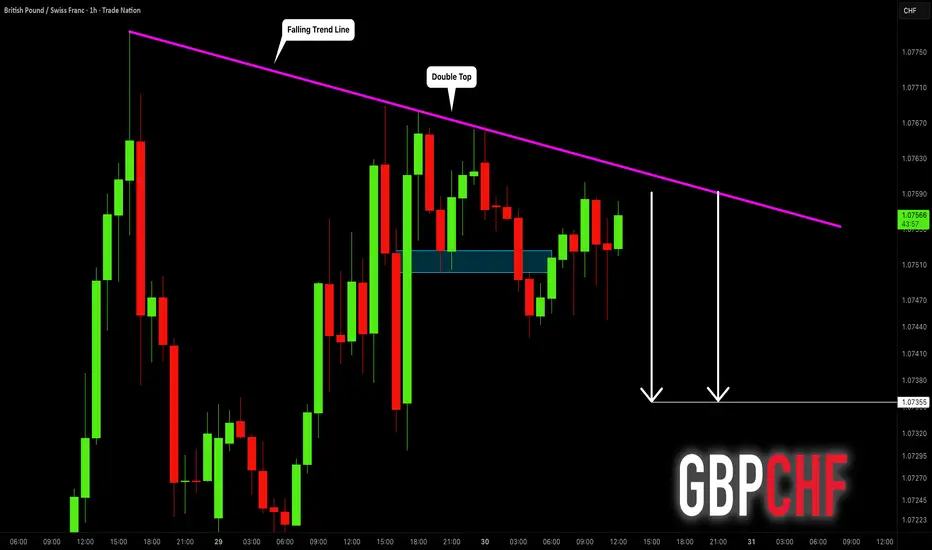
GBPCHF: Another Bearish Signal?! 🇬🇧🇨🇭
Quick update for GBPCHF.
We discussed a strong bearish confirmation yesterday.
Today, we have one more.
The price formed a double top after a test of a strong intraday
falling trend line.
Its neckline was broken this morning.
I expect a retracement to 1.0735
❤️Please, support my work with like, thank you!❤️
I am part of Trade Nation's Influencer program and receive a monthly fee for using their TradingView charts in my analysis.