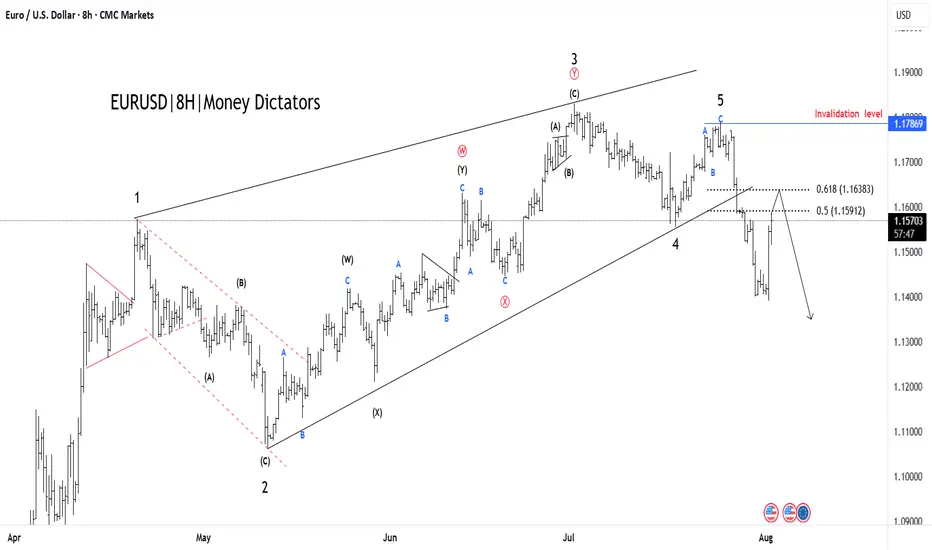
EUR/USD Elliott Wave Count Signals Downside TargetsThe EUR/USD chart is displaying a completed 5-wave Elliott impulse structure, suggesting the potential start of a larger corrective move to the downside. Wave 5 appears to have finished after a classic ending diagonal pattern, with price now breaking below the wave 4 support trendline — a strong confirmation of trend exhaustion.
Currently, price is retracing upward towards the 0.5–0.618 Fibonacci retracement zone of the last impulsive leg, around 1.15912–1.16383, which may serve as the final rejection zone for bears to re-enter. This area aligns perfectly with prior support-turned-resistance and is considered the potential reversal pocket.
If price holds below the 1.17869 invalidation level, the structure supports the beginning of an ABC correction or a larger bearish impulse.
Target 1 (T1): 1.14800
Target 2 (T2): 1.13915
Stop Loss (SL): 1.17869
This scenario remains valid as long as the price does not break above 1.17869. A clean break and close above this level would invalidate the bearish setup and suggest a possible wave extension.
Forexanalysis
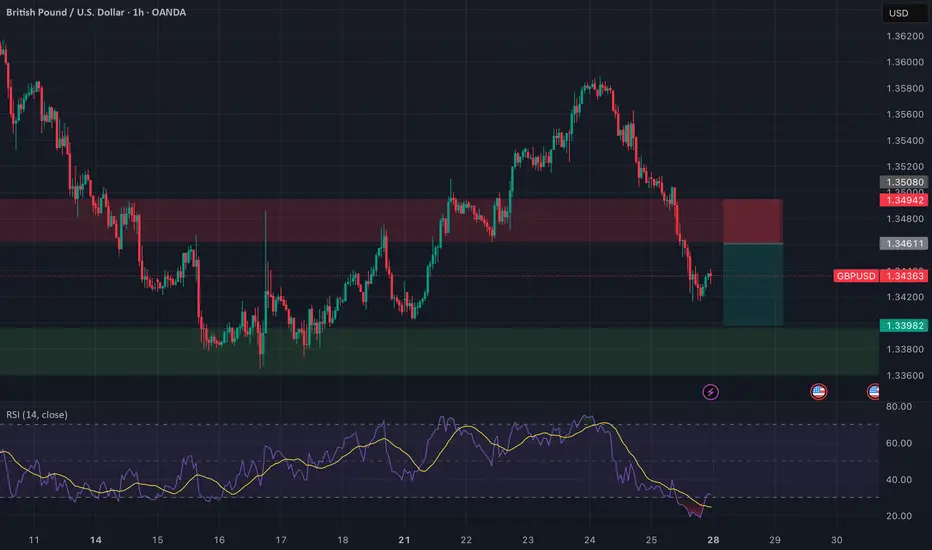
GBPUSD: Selling the Retest | Clean Break, Wait for Confirmation🔻 GBPUSD | Sell the Retest of Broken Support
Timeframe: 1H
Bias: Bearish
Type: Break and Retest
📊 Technical Setup
GBPUSD has broken a key 4H support zone (~1.3460–1.3494) which now acts as a turncoat resistance. Price is currently pulling back, offering a prime opportunity to sell the retest.
• Entry: 1.3460–1.3490 (after confirmation of rejection)
• SL: Above 1.3508
• TP: 1.3398
• RR: ~1:2
• RSI: Bearish momentum, RSI < 50 with mild recovery—ideal for a fade trade
📉 Macro & Fundamental Confluence
• GBP: Despite hawkish BOE tone, GBP is showing technical weakness and soft CFTC positioning
• USD: Strong macro bias with rising conditional score and delayed Fed cuts (still supporting USD strength)
• Seasonal Bias: GBPUSD marked bearish in seasonal chart
• COT Data: GBP positioning turning bearish after previous net build-up
🧭 Gameplan
“Wait for the retest of broken support-turned-resistance to reject before entering short. Stick to the zone.”
🔔 Set alerts around 1.3460–1.3490 and monitor for bearish engulfing or pinbar confirmation.
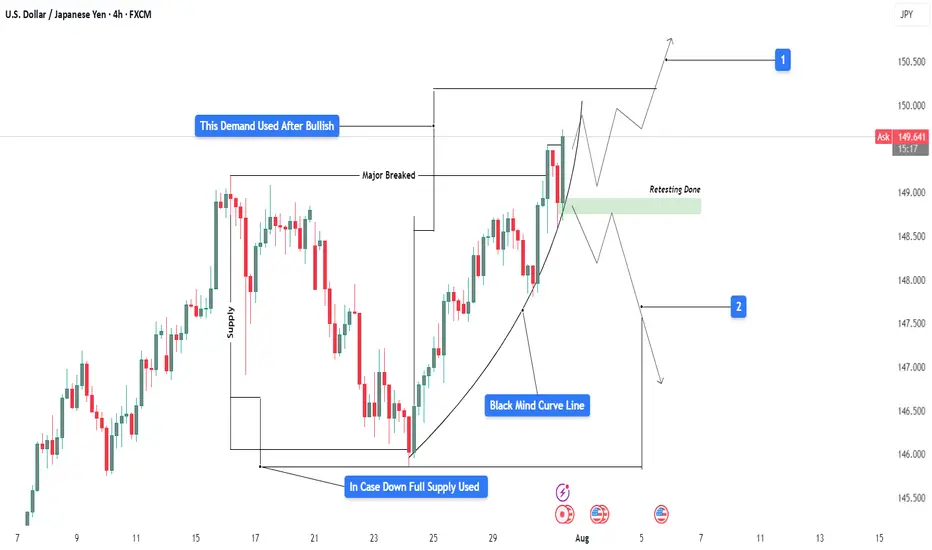
USDJPY 4H Analysis : Curve Breakout & Retest Completed + Bullish"Momentum Building Above Retested Demand – Will Bulls Take Control?"
📊 Market Structure Overview:
USDJPY has shown a clean bullish structure in recent sessions, supported by a strong demand retest and a steady parabolic curve formation (Black Mind Curve Line). The pair has successfully broken above a major resistance, retested it, and is now holding higher ground—suggesting potential for continued upside if current structure holds.
🧱 Detailed Technical Breakdown:
🔹 1. Demand & Retesting Behavior
The chart highlights a key demand zone (green box) that was previously used after a bullish move.
Price recently returned to this zone for a clean retest, validating its role as a strong support.
This type of retesting behavior is critical in smart money analysis, confirming that accumulation has occurred and sellers have been absorbed.
🔹 2. Major Breakout Confirmation
The previous major structure level has been decisively broken to the upside.
This level now acts as support, increasing the probability that the bullish move will sustain.
🔹 3. Black Mind Curve Line (Parabolic Structure)
A parabolic curved trendline supports the current price action, showing how bulls are gradually gaining momentum.
This curve represents buyer interest increasing over time, which often leads to an aggressive breakout when paired with retest confirmation.
📍 Key Price Zones:
Type Price Level (Approx.) Description
🔹 Retesting Zone ~148.800 – 149.100 Support zone after major breakout
🔺 Resistance Target (1) ~150.500 Bullish breakout target (short-term)
🔻 Downside Risk (2) ~147.000 – 146.500 Bearish invalidation zone if demand fails
🔹 Full Supply Area ~145.000 – 145.500 Historical supply zone if price fails completely
🔮 Trade Scenarios:
✅ Scenario 1 – Bullish Continuation (Primary Bias)
Retest is complete, and price is holding above the curve and demand zone.
If bullish momentum continues:
📈 Target 1: 150.50 – Near-term resistance and liquidity area
📈 Target 2: 151.20+ – Extension target if buyers dominate
Bullish Confirmation:
Price must stay above ~149.00 and continue forming higher highs.
Entry ideas: Wait for minor consolidation above current price or bullish breakout from mini range.
⚠️ Scenario 2 – Bearish Rejection
If price rejects from current level and breaks below the curve and demand zone (~148.80):
📉 First downside target: 147.00 (minor support)
📉 Final bearish target: 145.50 (full supply zone)
Bearish Confirmation:
Breakdown of curve support and close below the retesting zone with momentum.
Such a move would suggest buyers failed, and market may rotate lower.
🧠 Market Sentiment & Psychology:
Smart Money Behavior: Demand was filled cleanly and retested, indicating possible institutional interest at that level.
Momentum Curve: As shown by the black curve, momentum is rising gradually—this reflects confidence building among buyers.
However, price is near psychological resistance (150.00–150.50 zone), where heavy sell orders might be placed.
The market is in a decision zone, where confirmation of strength or failure will dictate the next 200–300 pip move.
🎯 Summary:
USDJPY is showing a bullish structure supported by:
A valid retest of demand
A clean breakout of major resistance
An ascending parabolic curve
If bulls defend the current zone, we may see a powerful continuation toward 150.50+. If price fails to hold above the retest zone, downside risks open toward 147.00 and potentially the full supply at 145.00.
📌 Trade Smart: Wait for price confirmation, manage risk with stop placement below the demand zone or structure lows, and avoid chasing the move.
XAUUSD – Strong Bullish Reversal from Key Support XAUUSD – Strong Bullish Reversal from Key Support
Chart Summary:
Gold (XAUUSD) has shown a clear reaction from a strong support zone near 3260, suggesting bullish momentum is gaining strength. The chart highlights multiple key market structure elements and confirms the potential for a bullish move.
Technical Highlights:
🔻 Strong Support Zone (3260–3280):
Price tapped into a well-defined demand zone with historical significance, initiating a bullish response.
🔺 Resistance Zone (3460+):
A strong resistance level lies ahead. This area may act as a potential target for bulls.
🔁 Break of Structure (BOS):
Multiple BOS marks on the chart indicate trend shifts and liquidity grabs. Most recent BOS aligns with potential reversal.
💹 Bullish Fair Value Gap (FVG):
A bullish FVG near mid-structure confirms institutional interest and adds confluence to the upside move.
📈 Target: 3,366.984 USD
Marked as the next probable short-term liquidity target. If momentum sustains, price may approach resistance above this.
Price Expectation:
If the current bullish momentum holds above the strong support zone, we may see a rally towards 3,366–3,400 USD.
This move could be driven by:
Buy-side liquidity grab above prior highs
Breakout traders entering above BOS
Reaction to macroeconomic calendar (highlighted on the chart)
✅ Educational Takeaway:
This is a textbook example of:
Support-resistance flip
Liquidity concepts (Buy-Side Liquidity)
Fair Value Gaps usage
Volume Profile confluence

GBP/USD Professional Analysis – “Trap Trigger at Support”GBP/USD Professional Analysis – “Trap Trigger at Support”
📈 Market Overview:
• Pair: GBP/USD
• Timeframe: Likely 1H or 2H based on candle spacing
• Date: July 28, 2025
• Current Price: 1.33529
⸻
🔍 Technical Breakdown
🔴 Resistance Zone: 1.35800 – 1.36200
• Strong supply area where the last bullish impulse failed.
• Price got rejected hard, initiating a new downtrend.
• Sell-side pressure was confirmed with Supertrend turning red.
🟤 Support Zone: 1.32860 – 1.33400
• Major demand area where price previously reversed sharply.
• Currently being tested again after a clean sweep into the Trap Trigger zone.
⚠ Trap Trigger Zone (Liquidity Sweep Area):
• Price wicked just below support, tapping into a low-volume/high-liquidity area.
• This wick likely cleared sell-side liquidity and trapped breakout sellers.
• Followed by a bullish rejection wick, implying smart money accumulation.
⸻
🛠 Indicators & Tools:
• Supertrend (10,3): Currently red, indicating short-term bearish momentum.
• However, if price closes above 1.34032 (Supertrend level), it could flip bullish.
• Volume Profile (VRVP):
• Low-volume node under support suggests a quick “stop hunt” move, not genuine selling.
• High-volume acceptance area sits higher, near 1.34500–1.35000.
⸻
🎯 Forecast:
🔴 Bearish Invalidations:
• Price closing below 1.32860 with volume would invalidate this setup.
• That could signal continuation to deeper liquidity (1.32500 or below).
⸻
🧠 Smart Money Perspective:
• Liquidity engineered beneath support
• Trap Trigger activated — ideal for institutional reversal setups
• This is a classic “Stop Hunt → Reclaim → Expand” model

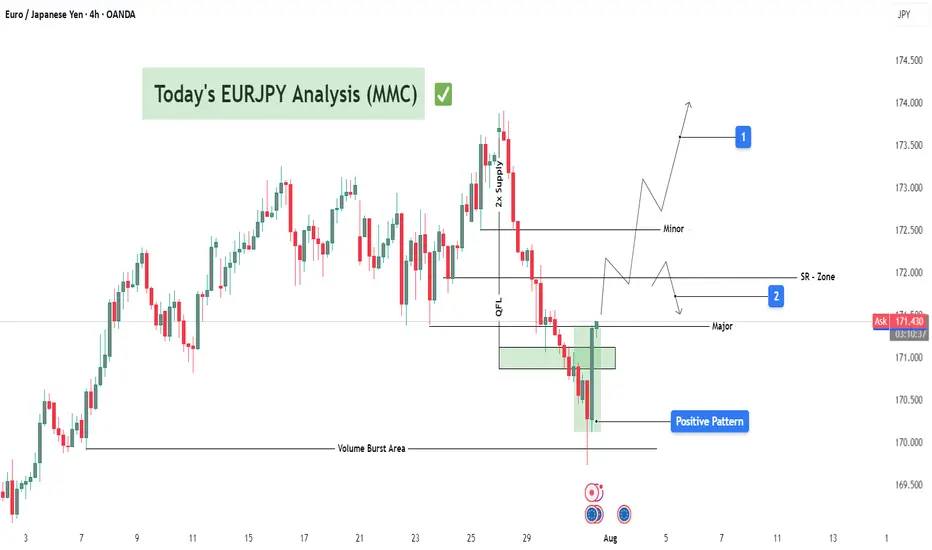
EURJPY Bullish Setup : EURJPY Forecast + Demand Zone🧠 Introduction: What's Happening on the Chart?
Today’s analysis on EURJPY is built on the MMC trading framework, which emphasizes the identification of institutional supply and demand zones, reaction points, QFL patterns, and volume bursts to map out high-probability trading paths.
We are currently observing a market in a corrective phase following a significant bearish drop. However, the presence of a major demand zone, along with a positive bullish pattern, suggests potential upside reversal or at least a short-term retracement.
🔍 Technical Breakdown – Zone by Zone
🔻 1. The Drop from 2x Supply Zone
EURJPY experienced a significant decline from the 173.60–174.00 area, which acted as a 2x confirmed supply zone.
Sellers took control with strong bearish candles that broke through previous minor support levels.
This drop was impulsive, showing momentum-driven selling, often linked with institutional activity.
🟩 2. Demand Reaction at Major Zone
Price entered a key demand zone marked in green (170.80–171.00), where historically buyers have stepped in.
A "Volume Burst" is visible here—large volume candles with long wicks to the downside, which typically indicate accumulation.
A positive pattern (possibly engulfing or a pin bar structure) has formed, signaling a potential bullish reversal or relief rally.
🧱 3. QFL Structure (Quantum Flat Line)
The chart highlights a QFL base, where the price consolidates after an initial drop, then continues lower before a sharp bounce.
QFL is often used to identify trap zones where retail traders are shaken out, and smart money enters.
The recent bounce from the QFL base suggests smart money might be accumulating for a reversal move.
📐 Key Levels and Zones
Type Zone/Level Role
🔵 Volume Burst Area ~170.80–171.00 Aggressive buyer entry; accumulation zone
🟢 Major Demand 170.80–171.20 Key structural low supporting bullish bias
🟠 SR Flip Zone 171.80–172.00 Crucial breakout/retest level
🔴 Minor Resistance 172.60–173.00 Short-term pullback zone
🟥 2x Supply 173.60–174.00 Strong reversal point; ideal target
🔁 Scenarios to Watch
📈 Scenario 1: Bullish Breakout and Rally (Blue Box 1)
If price breaks above 172.00, we expect:
A potential retest (bullish confirmation).
Continuation toward minor resistance at 173.00, and possibly the 2x supply zone at 174.00.
This aligns with the positive pattern formed at the base and the idea of a market rotation from bearish to bullish structure.
📉 Scenario 2: Rejection and Retest of Lows (Blue Box 2)
If the price fails to sustain above 172.00, sellers may step in:
Price could revisit the major demand zone again or even break down to 170.50.
This would invalidate the bullish setup in the short term and imply a larger continuation of the bearish trend.
🧠 Strategic Insights (MMC-Based Thinking)
The MMC approach teaches us to mirror the market’s emotion and behavior.
In this case, we see signs of:
Panic selling → smart money accumulation.
Institutional traps (QFL drop) → bullish absorption.
Traders applying MMC would anticipate reactive setups at the SR Flip Zone to determine next directional bias.
💡 Trade Ideas (For Educational Purposes Only)
Strategy Entry SL TP1 TP2
Aggressive Long 171.30–171.50 170.70 172.50 173.50
Breakout Retest Long 172.10 (after breakout) 171.50 173.00 174.00
Sell on Rejection 172.00 (bearish confirmation) 172.60 171.00 170.40
📌 Conclusion & Final Thoughts
EURJPY is showing a potential bullish reversal setup from a well-defined demand zone, supported by volume bursts and positive price action patterns. However, the SR Zone at 172.00 remains the key pivot—how the price reacts here will determine whether we see a deeper pullback or a continuation to test upper resistance levels.
Stay flexible and responsive. Let the market give confirmation before execution. As always, follow proper risk management and trade the reaction, not the prediction.
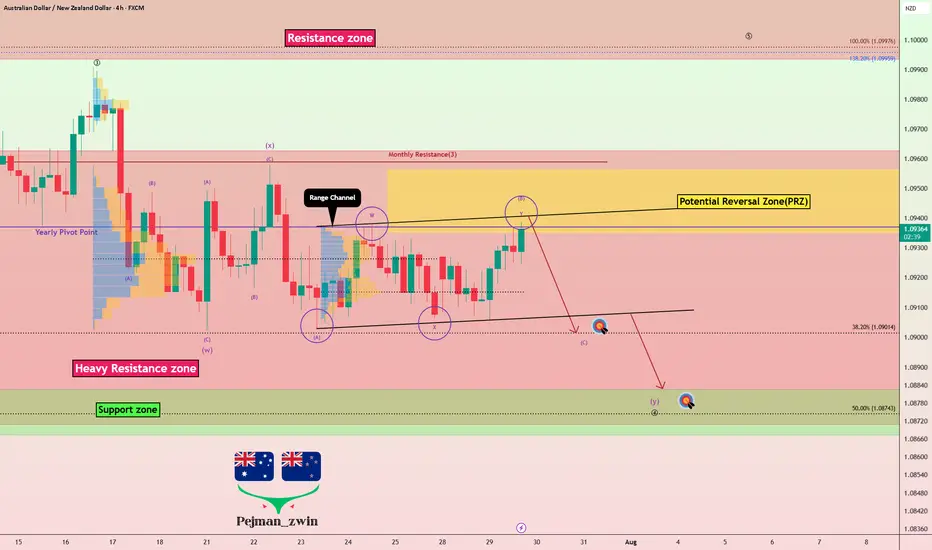
AUDNZD Technical + Fundamental Align for DownsideToday I want to analyze a short position on the AUDNZD ( OANDA:AUDNZD ) pair, first, let's look at it from a fundamental analysis perspective .
Fundamental View on AUDNZD
Key reasons to short AUDNZD:
Australian weakness:
Recent data show weakening consumer sentiment and declining building approvals. The RBA seems hesitant to hike further, putting pressure on the Aussie.
New Zealand resilience:
The RBNZ maintains a relatively hawkish stance. Inflation is still a concern, and the central bank is committed to keeping rates high, supporting NZD strength.
Monetary policy divergence:
The divergence between RBA’s dovish stance and RBNZ’s hawkish approach supports further downside in AUDNZD.
----------------------
Now let's take a look at AUDNZD from a technical analysis perspective on the 4-hour timeframe .
AUDNZD is currently trading in a Heavy Resistance zone(1.0963 NZD-1.0870 NZD) near the upper line of the Range Channel , Potential Reversal Zone(PRZ) and Yearly Pivot Point .
In terms of Elliott Wave theory , AUDNZD appears to be completing microwave B of microwave Y of the main wave 4 .
I expect AUDNZD to drop to at least 1.0904 NZD(First Target) based on the above explanation .
Second Target: 1.0886 NZD
Note: Stop Loss(SL): 1.0963 NZD
Please respect each other's ideas and express them politely if you agree or disagree.
Australian Dollar/New Zealand Dollar Analyze (AUDNZD), 4-hour time frame.
Be sure to follow the updated ideas.
Do not forget to put a Stop loss for your positions (For every position you want to open).
Please follow your strategy and updates; this is just my Idea, and I will gladly see your ideas in this post.
Please do not forget the ✅' like '✅ button 🙏😊 & Share it with your friends; thanks, and Trade safe.
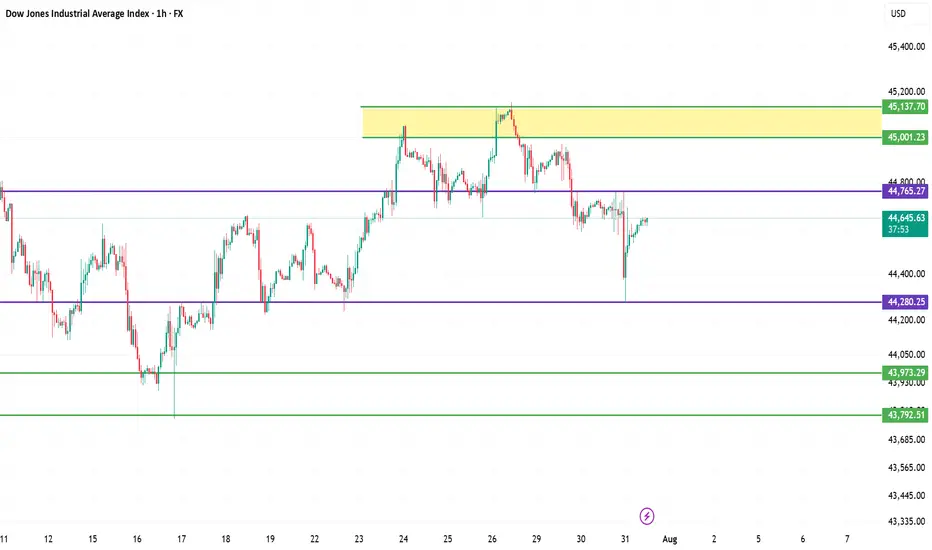
Dow Jones Industrial Average (DJI) – 1H Chart Analysis 1. Structure: Broad Range Consolidation
Price remains within a wide horizontal range between 45,137 resistance and 43,792 support. This shows indecision and distribution at highs.
2. Key Rejection Zone
The yellow zone around 45,001–45,137 acted as a strong supply area. Multiple rejections indicate heavy selling interest here.
3. Mid-Zone Compression
Current price is hovering just below 44,765 resistance — acting as a decision point. Break above it may retest the supply zone; rejection could send price lower.
4. Demand Holding at 44,280
The strong bounce from 44,280.25 shows buyers defending this demand zone. It's the key support to watch for bulls.
5. Next Play
Bullish: Break and hold above 44,765 targets 45,001–45,137.
Bearish: Failure leads to 44,280, then 43,973 → 43,792.
Neutral bias unless a clean breakout confirms direction.
U.S. Dollar Index (DXY) – Pro Analysis | 1H Chart |1. Strong Bullish Momentum
DXY broke out sharply above the 99.41 resistance, showing clear strength from bulls with minimal pullbacks during the rally.
2. Short-Term Rejection at Supply
Price was rejected from the 99.978 zone — a key supply area. This indicates the presence of active sellers near the psychological 100 level.
3. Retesting Breakout Structure
Currently hovering just above 99.669, the DXY is retesting the previous breakout level. This could act as short-term support if bullish momentum resumes.
4. Next Key Zones
Resistance: 99.978 → 100.534
Support: 99.411 → 98.92
Break below 99.411 may invalidate the breakout.
5. Outlook
Bias remains bullish above 99.41. However, failure to reclaim 99.978 soon may signal temporary exhaustion or consolidation before next leg up.

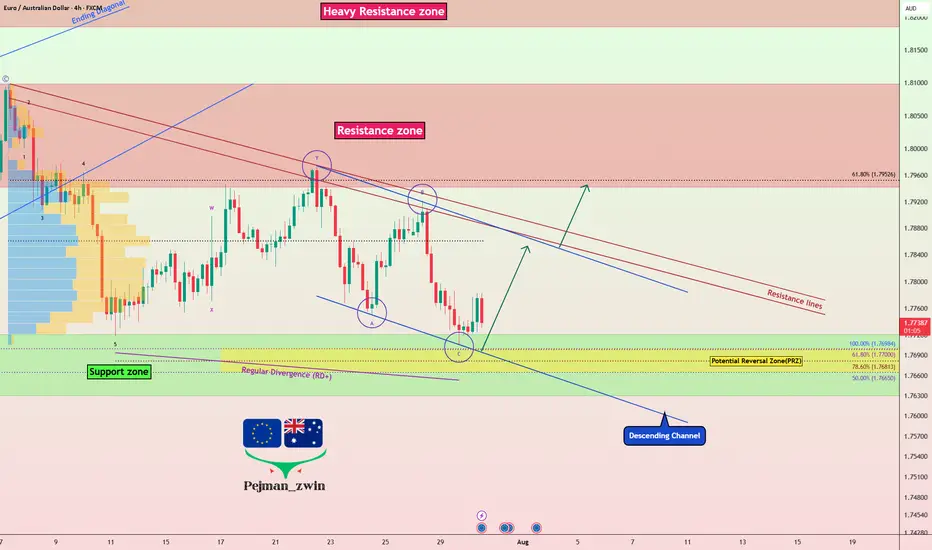
EURAUD Ready to Bounce? Key Support & Fundamentals Aligned!Today I want to share a Long position idea on EURAUD ( OANDA:EURAUD ) with you.
From a fundamental perspective , both the Euro (EUR) and Australian Dollar (AUD) are currently under pressure. However, the Aussie appears fundamentally weaker in the short term, making the EURAUD Long setup more favorable at this stage.
AUD Weakness :
The Reserve Bank of Australia (RBA) has held rates steady at 3.85%, but recent inflation data has dropped to 2.7%, the lowest in over 3 years.
Most economists now expect the RBA to cut rates in its next meeting in August, possibly by 25 basis points.
Slowing economic growth and dovish forward guidance from the central bank are weighing heavily on AUD sentiment.
EUR Outlook :
The European Central Bank (ECB) is also facing weak economic data, but is taking a more cautious approach toward cutting rates.
Despite softer PMIs and sluggish growth in countries like Germany and France, the ECB has not confirmed a near-term rate cut, keeping EUR relatively stable.
This divergence between the RBA’s dovish stance and the ECB’s pause is supportive of EUR strength against AUD.
Summary :
With the RBA likely to ease policy soon and the ECB holding ground for now, the interest rate differential favors EURAUD upside. Fundamentals point toward further weakness in AUD, making the EURAUD Long a strategically sound trade idea for the coming days.
-------------------------------------------
Now let's analyze the conditions of the EURAUD chart on the 4-hour time frame .
EURAUD is currently trading near the Support zone(1.772 AUD-1.763 AUD) , Potential Reversal Zone(PRZ) , and near the lower line of the descending channel .
According to Elliott Wave theory , EURAUD appears to have completed a Zigzag Correction(ABC/5-3-5) .
Also, we can see the Regular Divergence(RD+) between Consecutive Valleys .
I expect EURAUD to rise to at least 1.784 AUD .
Second Target: 1.792 AUD
Note: Stop Loss(SL): 1.762 AUD
Please respect each other's ideas and express them politely if you agree or disagree.
Euro/Australian Dollar Analyze (EURAUD), 4-hour time frame.
Be sure to follow the updated ideas.
Do not forget to put a Stop loss for your positions (For every position you want to open).
Please follow your strategy and updates; this is just my Idea, and I will gladly see your ideas in this post.
Please do not forget the ✅' like '✅ button 🙏😊 & Share it with your friends; thanks, and Trade safe.
USDJPY Forming Bullish Reversal | MMC Analysis + Target🧠 Chart Overview (2H Timeframe)
🔸 1. Head and Shoulders Inverse Pattern – MMC Bullish Blueprint
The chart beautifully shows an Inverse Head & Shoulders pattern, one of the most powerful reversal signals under MMC logic:
Left Shoulder: Formed after the initial drop and quick recovery.
Head : Deep liquidity grab and reversal from the lowest point (demand zone).
Right Shoulder: Higher low structure, indicating reduced selling pressure and shift in momentum.
This pattern is forming around a previous liquidity zone, which makes it more valid and aligned with smart money behavior.
🔸 2. Retesting Zone – Critical MMC Demand Area
Price is now retesting a highlighted demand zone, which acted as the springboard for the previous bullish move:
Bullish Pattern marked aligns with MMC’s concept of “Return to Origin”.
This zone also sits just above the right shoulder, confirming that buyers are defending aggressively.
If this level holds, we may see a strong continuation move to the upside.
🔸 3. Previous Reversal Zone (Supply) – Next Target Area
Marked in light green, this area is the next critical resistance:
Acts as liquidity target for institutions if price rallies.
Historically acted as a major reversal point.
Price is likely to show reactions or profit-taking behavior here.
Once broken and retested, it becomes a new support for further upside continuation (as marked on the chart).
🔸 4. Dual Scenarios – Bullish vs Bearish Pathways
Your chart correctly outlines two strategic possibilities:
✅ Bullish Scenario:
Price respects demand zone.
Breaks above previous reversal zone (149.000+).
Bullish continuation toward 149.800–150.500 range.
MMC tip: “If it goes bullish, use previous demand or double it” = Add confluence or stack demand zones for scale-in entries.
❌ Bearish Scenario:
If price breaks below retesting zone, bullish invalidation triggers.
Look to the previous all supply zone (Zone Pattern Must) for next reaction.
This scenario reflects smart money rejection of upside continuation.
🗂️ MMC Structural Elements Identified:
Zone/Pattern Role in Analysis
Inverse H&S Trend reversal signal
Retesting Zone Demand/entry area
Previous Reversal Zone First key resistance / next liquidity pool
Supply Zone Below Target in case of downside breakdown
MMC Logic Follow price structure, fakeouts, demand/supply traps
📈 Summary Outlook:
USDJPY is showing a technical bullish structure backed by MMC-based price psychology. The current pullback into a demand zone gives traders an excellent R:R opportunity for long positions, targeting higher zones upon breakout confirmation.
🟩 If bullish, breakout >149.000 will likely lead toward 150.000+
🟥 If bearish, breakdown <147.600 opens doors to deeper drop toward 146.000 zone (watch for reversal pattern).
🔑 Key Levels to Watch:
Type Level Range Notes
Support 147.600–147.800 Current retesting demand
Resistance 148.800–149.300 Previous Reversal Zone (Profit booking area)
Higher Resistance 150.500+ Final upside objective
Breakdown Zone <147.500 Flip to bearish scenario

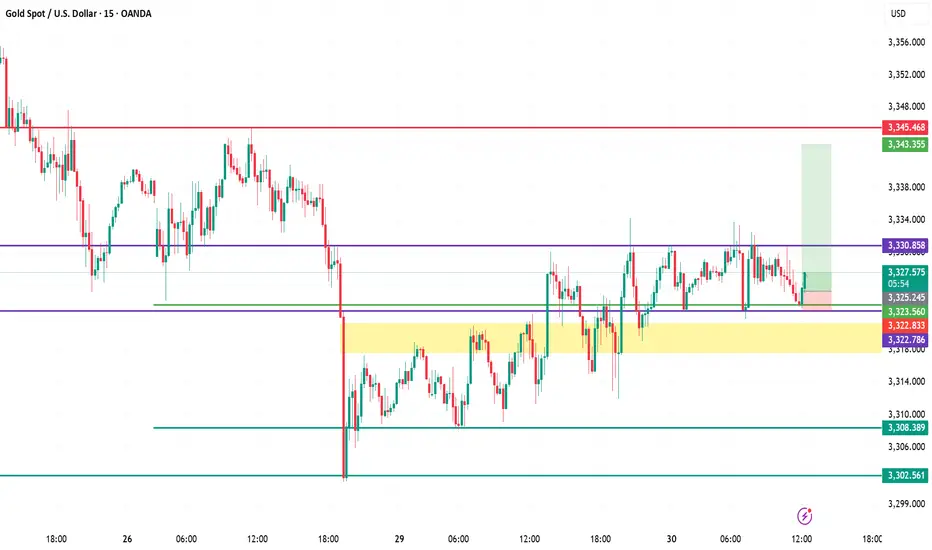
XAUUSD (Gold) Analysis – July 30, 2025 | 15-Min ChartStructure & Context
Gold is consolidating just above the key intraday support of $3,323, following a bounce from the high-demand zone ($3,322–$3,323.5).
Demand Zone Validity
The yellow zone has consistently attracted buyers, defending it multiple times with sharp rejections. This confirms it as a short-term demand base.
Resistance Still Capping Upside
$3,330.85 acts as immediate resistance. Price has failed to close above it despite several wicks testing this zone — showing strong seller presence.
Scalp Long Idea In Play
A buy setup is in motion with entry near $3,323.5, stop below $3,322, and target at $3,337.5. Risk-to-reward remains favorable while above demand.
Critical Levels to Watch
Support: $3,322.8 → $3,308.3 → $3,302.5
Resistance: $3,330.8 → $3,337.5 → $3,345.4
🎯 Bias: Bullish above $3,322, bearish if broken.
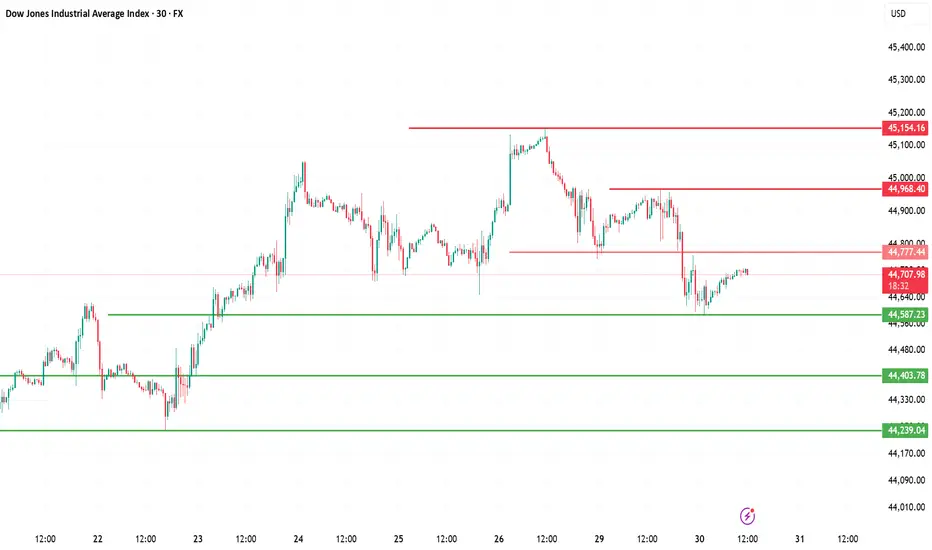
Dow Jones Index (DJI) – July 30, 2025 | 30-Min Chart Analysis
1. Current Market Structure
DJI is consolidating just below the intraday resistance at 44,777. Price is attempting to recover after a sharp drop from the 45,154 high.
2. Supply Zone Rejection
Price faced strong rejection near 45,154 and again at 44,968 — confirming this area as an active seller zone.
3. Support Zone Defense
Buyers stepped in at 44,587 and 44,403, creating a short-term demand base. These levels have provided stability for now.
4. Trend Outlook
The lower high formation and recent sharp sell-off hint at bearish pressure. Price is currently in a retracement — unless 44,968 breaks cleanly, sellers remain in control.
5. Key Levels to Watch
Resistance 44,777 → 44,968 → 45,154
Support 44,587 → 44,403 → 44,239
🔁 Bias: Short-term bearish unless price breaks above 44,968 and holds.
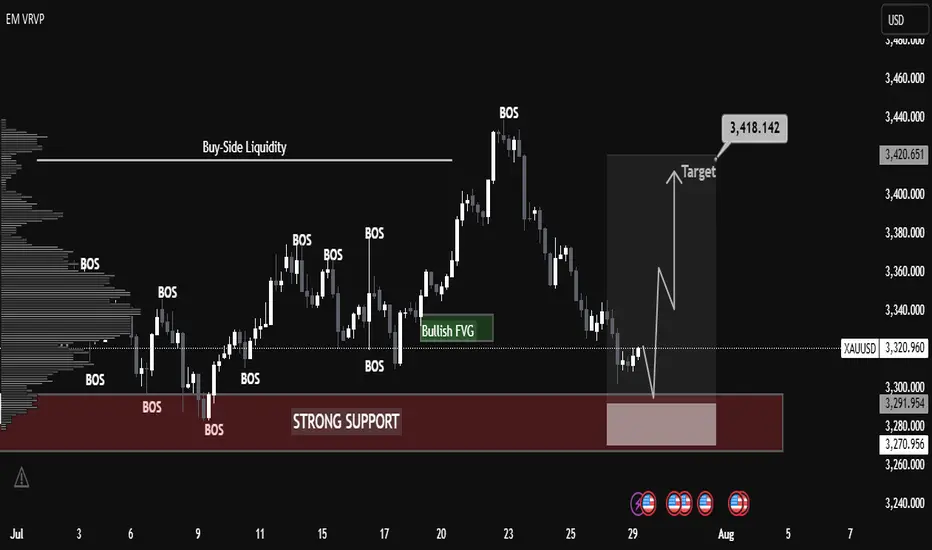
XAUUSD Technical Analysis – Strong Bullish Move Expected XAUUSD Technical Analysis – Strong Bullish Move Expected from Support Zone
Date: July 29, 2025
Chart Type: Price Action | Smart Money Concept (SMC) | Volume Profile
🧠 Educational Breakdown:
1. Strong Support Zone (Demand Area):
Price has entered a clearly marked strong support zone around $3,270 - $3,292.
This zone has previously acted as a major demand level, where buyers stepped in to reverse bearish pressure.
High volume node from the Volume Profile on the left confirms significant historical interest in this price region.
2. BOS – Break of Structure:
Multiple Break of Structures (BOS) throughout the uptrend confirm bullish market intent.
The recent decline appears corrective, not impulsive, suggesting a potential bullish continuation.
3. Bullish Fair Value Gap (FVG):
A Bullish FVG is visible just above current price, acting as a magnet for price action.
This imbalance is often targeted before further market movement, supporting the idea of an upcoming bullish move.
4. Liquidity Grab Setup:
Price dipped into the support area likely to sweep liquidity (stop losses) before a reversal.
This is a common Smart Money trap, where institutional players grab liquidity before moving the market in the intended direction.
5. Target Zone:
A clear target is set around $3,418, aligning with previous highs and potential Buy-Side Liquidity.
The projected move represents a clean higher high, following the higher low formed at the support zone.
Confirmation: Wait for bullish engulfing or displacement candle on lower timeframe (M15-H1).
Volume Support: Look for rising volume during the reversal to confirm smart money participation.
📘 Conclusion:
Gold (XAUUSD) is showing a textbook bullish reversal setup from a high-demand zone. With strong structural support, fair value gap targeting, and buy-side liquidity above, the setup favors bullish continuation toward $3,418.
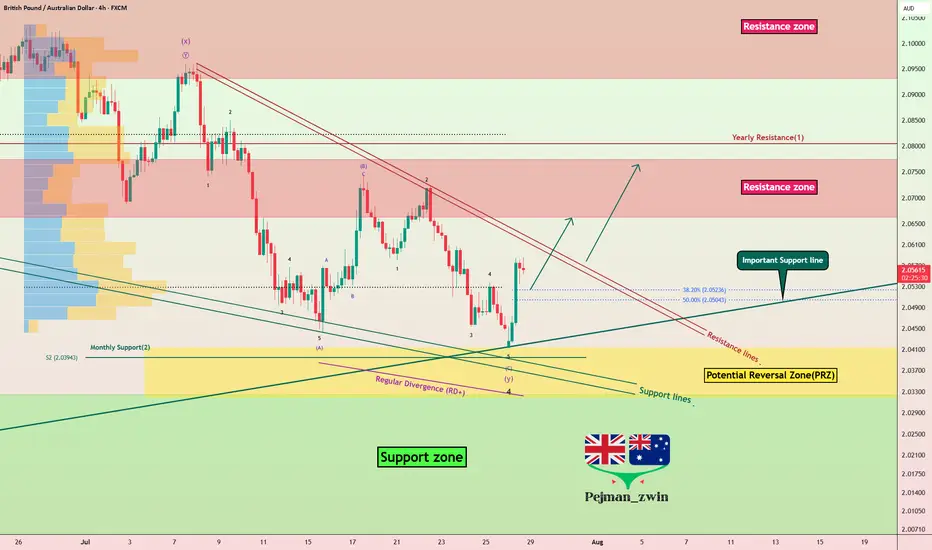
GBPAUD Reverses from Key Zone – Long Setup in Play!Today I want to share with you a Long position on GBPAUD ( OANDA:GBPAUD ).
GBPAUD started to rise well from the Important Support line , Support zone(2.032 AUD-1.987 AUD) , and Potential Reversal Zone(PRZ) and managed to close the 4-hour candle above 2.053 AUD (important) .
In terms of Elliott wave theory , GBPAUD seems to have completed the main wave 4 . The main wave 4 structure was a Double Three Correction(WXY) .
Also, along the way, we can see a Bullish Marubozu candle , which could indicate a continuation of the uptrend .
I expect GBPAUD to break the Resistance lines soon and attack the Resistance zone(2.078 AUD-2.066 AUD) .
First Target: 2.065 AUD
Second Target: 2.076 AUD
Note: Stop Loss(SL): 2.040 =Worst SL
Please respect each other's ideas and express them politely if you agree or disagree.
British Pound/ Australian Dollar Analyze (GBPAUD), 4-hour time frame.
Be sure to follow the updated ideas.
Do not forget to put a Stop loss for your positions (For every position you want to open).
Please follow your strategy and updates; this is just my Idea, and I will gladly see your ideas in this post.
Please do not forget the ✅' like '✅ button 🙏😊 & Share it with your friends; thanks, and Trade safe.
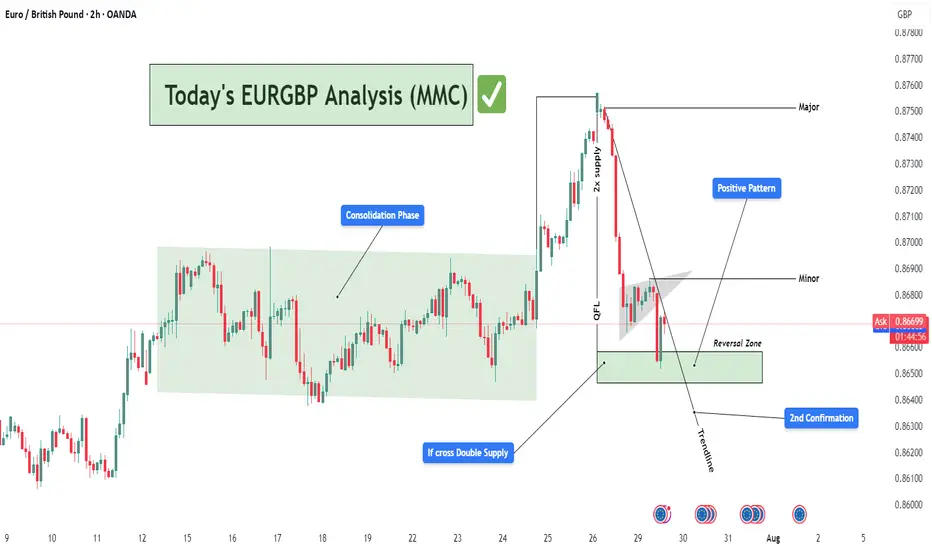
EURGBP Bullish Reversal Setup from Demand Zone (MMC Strategy)📊 Detailed Technical Analysis:
The EURGBP pair on the 2-hour chart is currently at a critical technical juncture, showing signs of a potential bullish reversal. This analysis follows Market Maker Concepts (MMC), which combines liquidity engineering, smart money movements, and structure shifts. Let’s break it down:
🔄 1. Consolidation Phase – Accumulation in Action (Smart Money Footprint)
Between July 15 to 24, the price moved within a tight range — classic consolidation behavior.
This phase suggests accumulation by institutional players, quietly building long positions while trapping retail shorts and longs.
This kind of sideways structure typically precedes a high-volume breakout, which happened right after.
📌 Lesson: Consolidation is often the calm before the storm — prepare for a breakout when this phase completes.
🚀 2. Breakout with QFL Pattern – Aggressive Bullish Shift
The price broke above the consolidation range and surged strongly.
This breakout followed a classic QFL (Quick Flip Level) structure — where price forms a base, drops temporarily, and then explodes upward.
The area of breakout aligns with a “2x Supply” zone — meaning this zone acted as a magnet for stop orders, and once breached, added more fuel to the rally.
📌 Why QFL Matters: It marks a shift in market sentiment — from balanced to strongly biased, in this case toward bulls.
📉 3. Pullback Phase – Structural Correction Begins
After reaching a high near 0.87500 (major resistance), price began to pull back sharply.
It formed a minor descending flag/channel, a classic corrective pattern, often a pause before resuming the larger trend.
A descending trendline has been drawn to capture this pullback structure.
📌 Important: Pullbacks are healthy — they allow for re-entries and provide better R:R setups.
📍 4. Reversal Zone – Key Demand Revisited
Price now sits within a Reversal Zone (Demand Area), marked in green on the chart.
This level previously served as the base for the breakout and aligns with institutional buying interest.
The area acts as a high-probability buy zone, supported by:
Trendline support
Price rejecting lower levels
Historical reaction at this zone
📌 Why It’s Crucial: If price respects this demand zone, it confirms bullish intent and creates a low-risk buying opportunity.
✅ 5. 2nd Confirmation – Price Action Support
The chart marks a "2nd Confirmation" label at a slightly lower level — this is a final support level, a safety net.
If price dips and bounces here again, it confirms buyer strength.
Strong price reaction at this level would validate a trend continuation setup back toward highs.
💹 6. Positive Pattern – Early Reversal Signs
Inside the demand zone, a bullish structure is forming.
This could be an inverted head & shoulders, or a double bottom pattern.
These patterns often act as launch pads for upward moves, especially when combined with institutional demand.
📌 MMC Insight: Market Makers engineer dips to induce panic, only to reverse aggressively once liquidity is absorbed.
🎯 Trade Plan Based on the Analysis:
Buy Zone: Between 0.86450 – 0.86700 (Reversal Zone)
Stop-Loss: Below 0.86250 (beneath 2nd confirmation)
Take Profits:
🎯 TP1: 0.86900 (Minor resistance)
🎯 TP2: 0.87500 (Major swing high)
Risk-to-Reward: 1:2 or higher depending on entry timing
🧠 MMC Strategy Summary for Minds:
This EURGBP 2H chart is a textbook example of MMC-based trading. We saw:
Institutional accumulation (consolidation phase)
QFL breakout (confirmation of bullish intent)
Return to demand (market maker’s discount area)
Early bullish signals (positive price action patterns)
Multiple confluences at the Reversal Zone (trendline, demand, confirmation zone)
Such a combination offers a high-probability swing trade setup. Patient traders can wait for the structure to break upward and join the trend with tight risk and clear targets.
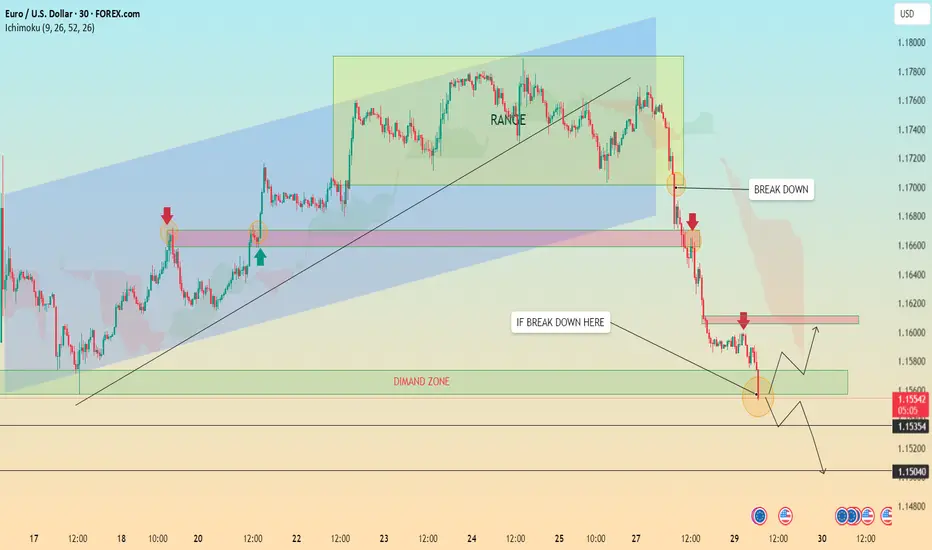
EURUSD Breakdown Bearish Trend Continues or Demand Zone Reversal🔍 Chart Breakdown: EUR/USD (30-min TF)
Trend Overview:
Previous Trend: Bullish channel structure (highlighted in blue).
Current Momentum: Strong bearish breakdown following a clear range phase.
The chart shifted from consolidation → breakdown → aggressive bearish continuation.
🧱 Key Technical Highlights:
1. Bearish Breakout:
Price broke below the ascending trendline and exited the ranging box, confirming a bearish shift.
Multiple Breakdown Retests (highlighted with red arrows) confirming structure failures and validating resistance zones.
2. Range Zone (Distribution Phase):
Price moved sideways within the green rectangle (“RANGE”), indicating accumulation/distribution before the selloff.
The breakdown from this range confirmed bearish momentum.
3. Demand Zone Test (Now in Play):
Price is approaching/hovering around a demand zone (green box) marked as a critical support.
Buyers may react here, offering two key scenarios:
Bounce back to retest resistance around 1.1600 (highlighted).
Breakdown below demand, leading to further decline toward next major support zones (1.15354 and 1.15040).
4. Price Reaction Zones:
🔴 Resistance zones are clearly marked where breakdown retests occurred.
🟢 Demand zone with bounce-or-break logic provides directional bias.
🧭 Potential Scenarios (Marked on Chart):
✅ Bullish Case:
If demand zone holds, expect:
A corrective rally toward 1.1600–1.1620.
Watch for rejection signals here (could be ideal for re-entering shorts).
❌ Bearish Case:
If breakdown below green demand zone occurs, targets:
1.1535 (local structure support)
1.1504 (next confluence level; possible long-term bounce area)
📈 Indicators:
Ichimoku Cloud: Price is well below the cloud, confirming bearish control.
Structure: Lower highs & lower lows = confirmed bearish trend.
EURUSD at Make-or-Break Zone: Time to Short?EURUSD – Key Data Out Today, Short Setup Confirmed?
Today, several important economic indexes were released for both the Euro(EUR) and the Dollar(USD) . Let’s break them down in a simple way:
Eurozone PMI Data: Mixed to Weak
France:
Manufacturing PMI: 48.4 (slightly lower than forecast)
Services PMI : 49.7 (flat, but below 50 = contraction)
Germany:
Manufacturing PMI: 49.2 (weaker than expected)
Services PMI : 50.1(slightly expansionary)
Eurozone Overall:
Manufacturing PMI: 49.8 (still below 50)
Services PMI : 51.2 (slightly stronger than forecast)
ECB left the Main Refinancing Rate unchanged at 2.15% , which was widely expected.
U.S. Data( TVC:DXY ): Strong and Surprising
Unemployment Claims: 217K (better than expected 227K)
Manufacturing PMI: 49.5 (below forecast of 52.7 – a negative surprise)
Services PMI: 55.2 (well above forecast and previous – bullish for USD)
Interpretation :
The Eurozone's growth remains sluggish, especially in France and Germany.
Despite a drop in U.S. manufacturing, the services sector remains strong, and unemployment data confirms labor market resilience.
This mixed picture slightly tilts the balance in favor of the U.S. dollar, especially as the ECB remains on hold while the Fed may still consider being restrictive.
Bias: Short EURUSD ( FX:EURUSD )
Fundamentals support a Short position in EURUSD, in line with the current technical setup.
---------------------------------
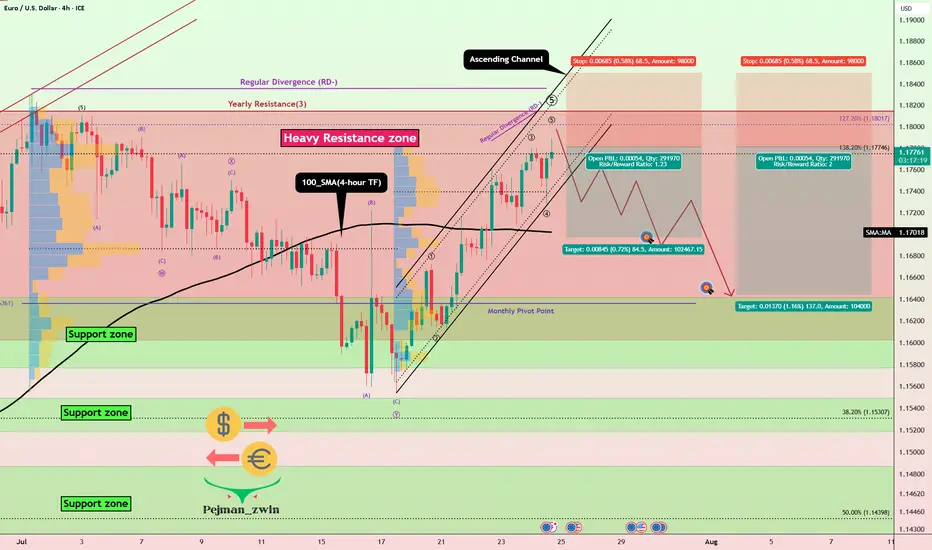
Now let's take a look at the EURUSD chart on the 4-hour time frame to find the best Short position .
EURUSD is currently trading in an Ascending Channel and at a Heavy Resistance zone($1.1845-$1.1602) .
Also, in terms of Elliott wave theory , it seems that EURUSD is completing a microwave 5 of the main wave 5 .
One of the most important supports ahead for EURUSD could be the 100_SMA(4-hour TF) .
If the currently 4-hour candlestick forms a Shooting Star Candlestick Pattern , it is a better sign for EURUSD to fall .
Also, we can see the Regular Divergence(RD-) between Consecutive Peaks .
I expect EURUSD to decline to at least $1.169 AFTER breaking the lower line of the ascending channel .
Second Target: Support zone($1.1642-$1.158) and Monthly Pivot Point.
Note: Stop Loss(SL)= $1.1850
Please respect each other's ideas and express them politely if you agree or disagree.
Euro/U.S. Dollar Analyze (EURUSD), 4-hour time frame.
Be sure to follow the updated ideas.
Do not forget to put a Stop loss for your positions (For every position you want to open).
Please follow your strategy and updates; this is just my Idea, and I will gladly see your ideas in this post.
Please do not forget the ✅' like '✅ button 🙏😊 & Share it with your friends; thanks, and Trade safe.
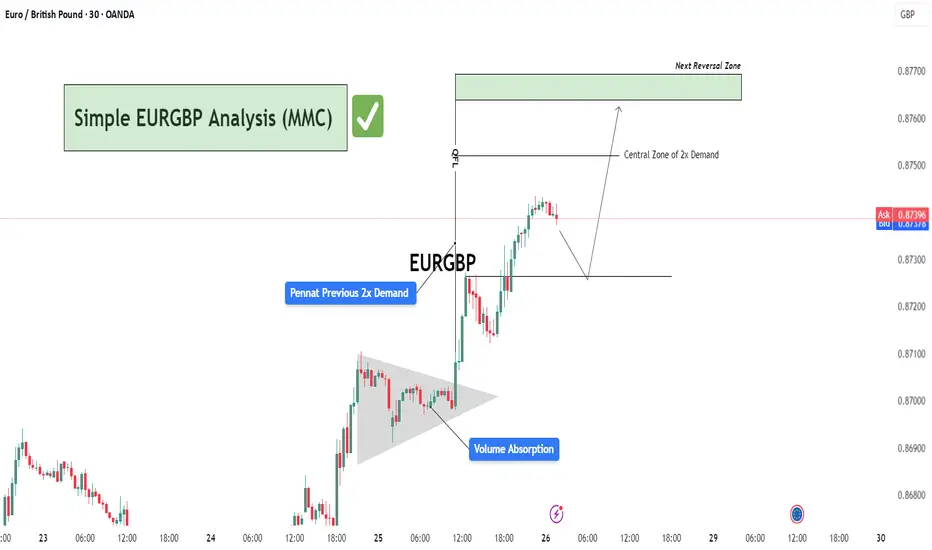
Simple EURGBP Analysis (MMC) – Bullish Continuation or Reversal?🕵️♂️ Chart Overview – 30-Min Timeframe (OANDA)
This EURGBP chart illustrates a classic bullish continuation structure following a volume absorption phase and pennant formation, leading into a vertical price expansion toward a potential reversal zone. The technical flow demonstrates smart money accumulation and re-accumulation before a sharp bullish leg.
🔷 Phase 1: Bullish Accumulation via Pennant Formation
The chart begins with a tight consolidation structure marked as a pennant, typically a continuation pattern.
This area coincides with “Previous 2x Demand”, hinting at a strong institutional buying interest.
The Volume Absorption label suggests that sell-side liquidity was efficiently absorbed—often a precursor to bullish breakouts.
📈 Phase 2: Breakout & Price Expansion
Price breaks out of the pennant aggressively, validating the absorption theory.
The post-breakout rally continues with minimal retracement, showcasing impulsive bullish momentum.
The QFL (Quasimodo Failure Level) is also marked—this serves as a structural footprint left by trapped sellers.
🟩 Next Levels to Watch: Reversal or Re-Entry Zones
As the price approaches the green "Next Reversal Zone" (0.87650–0.87700), watch for potential exhaustion or a reaction.
The Central Zone of 2x Demand (just below 0.87500) could act as a re-entry level for continuation long setups.
Anticipated short-term correction before continuation, as depicted by the projected path.
🧠 Strategic Insight & Trade Planning
Aggressive Bulls: May target breakout pullbacks near the Central Zone of Demand for intraday continuation.
Conservative Traders: Should wait for a clean reaction from the green Reversal Zone. If rejection is confirmed, short opportunities with tight stops become favorable.
Watch the price behavior around 0.87300–0.87500—this will likely dictate whether continuation or correction prevails.
Short Opportunity on GBPUSD – Technical & Fundamentals AlignToday I want to look at the Short position opportunity in GBPUSD ( FX:GBPUSD ). So let's take a look at the GBPUSD pair from a fundamental and technical perspective.
Fundamental Analysis:
The British Pound remains under pressure due to growing expectations of a 25–50 bps rate cut by the Bank of England in early August. Markets are increasingly leaning toward easing as UK inflation hit 3.6% in June, the highest in over a year, while economic growth weakened and consumer confidence dropped to its lowest since early 2024
Ongoing fiscal concerns, including potential tax hikes and budget instability, continue to weigh on the pound. In contrast, the US Dollar( TVC:DXY ) remains relatively robust—supported by strong economic data and a safe-haven preference amid global uncertainty
Summary:
BoE easing becomes more likely due to weak UK data and inflation.
Fiscal risks and low consumer sentiment add downward pressure on GBP.
USD strength from solid data and safe-haven demand supports further GBPUSD downside.
-------------------------
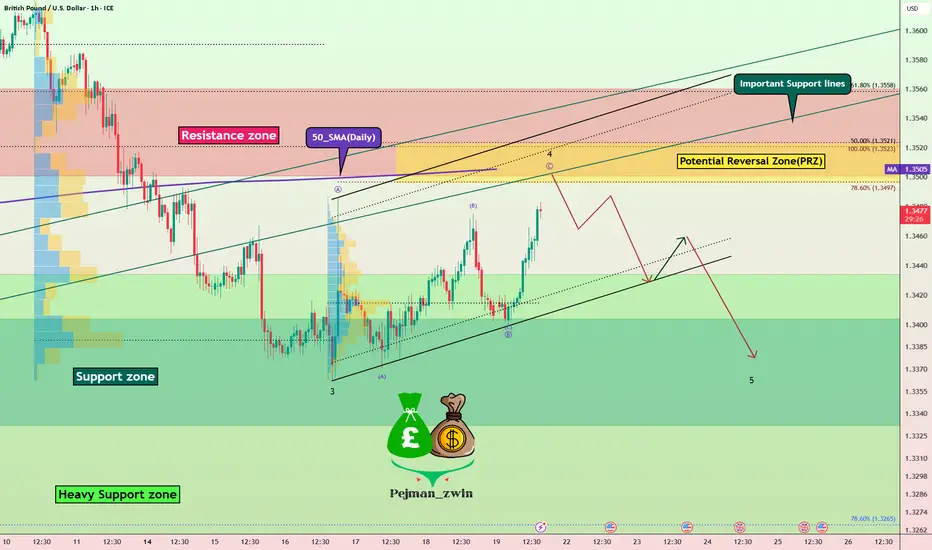
In terms of technical analysis , in the 1-hour timeframe , GBPUSD is approaching the Resistance zone($1.356-$1.350) , the Potential Reversal Zone(PRZ) , and the 50_SMA(Daily) . Meanwhile, this return to Important Support lines could act as a pullback to these lines. Important support lines and 50_SMA(Daily) were broken last week.
In terms of Elliott Wave theory , GBPUSD appears to be completing a main wave 4 . Main wave 4 is likely to have a Zigzag Correction(ABC/5-3-5) .
I expect GBPUSD to start declining from the Potential Reversal Zone(PRZ) and reach the targets I have marked on the chart.
Note: Stop Loss(SL): 1.3575USD = Worst Stop Loss(SL)
Please respect each other's ideas and express them politely if you agree or disagree.
British Pound / U.S Dollar Analysis (GBPUSD), 1-hour time frame.
Be sure to follow the updated ideas.
Do not forget to put a Stop loss for your positions (For every position you want to open).
Please follow your strategy and updates; this is just my Idea, and I will gladly see your ideas in this post.
Please do not forget the ✅' like '✅ button 🙏😊 & Share it with your friends; thanks, and Trade safe.
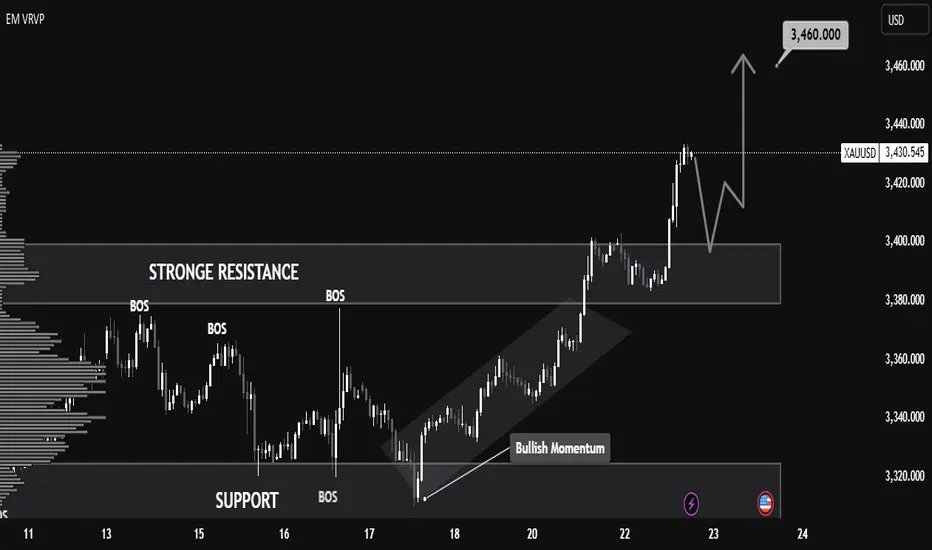
XAUUSD Technical Analysis – Resistance Turned Support, 📈 XAUUSD Technical Analysis – Resistance Turned Support, Bullish Continuation Expected
Gold (XAUUSD) has shown strong bullish momentum after breaking above the key resistance zone around $3,400, which now appears to be acting as a new support level. This structure shift signals a classic break-and-retest scenario, commonly observed in bullish continuations.
🔍 Key Observations:
Structure Shift: Previous resistance near $3,400 has been broken with strong bullish candles, suggesting buyer dominance. This level is now expected to serve as support.
Bullish Momentum: The move from the $3,320 support zone to above $3,430 was accompanied by clear trend formation and clean market structure, indicating sustained momentum.
Retest in Progress: Price is currently pulling back toward the new support zone ($3,400). If this area holds, a bullish reaction is expected.
Next Target: If support at $3,400 holds as expected, price could rally back toward the next resistance and projected target of $3,460.
📚 Educational Insight:
This setup illustrates the principle of resistance becoming support (RBS)—a foundational concept in technical analysis. After a breakout, a successful retest of former resistance often provides a high-probability entry point for trend continuation trades.
Gold 22/07 – Reversal in Sight After $3400? Watch These Key Zone XAUUSD – Intraday Market Outlook (22/07)
Gold posted a strong rally in the previous session, completing its short-term impulsive wave structure. However, as price approached the psychological resistance at $3400, it began to lose momentum, and a clear reversal candle appeared — a signal that today’s session may favour a pullback or correction.
🔍 Technical Overview
After printing a short-term top, gold is now retracing and has reached a critical support area: the FVG High Zone on the H1 chart. If bearish pressure continues and this level fails to hold, price is likely to drop further in search of deeper liquidity zones.
🔽 Key BUY Zones to Monitor Today
✅ Zone 1 – EL (End Liquidity within FVG): 3367 – 3350
→ A zone with strong potential for short-term rebounds due to previous liquidity sweeps.
✅ Zone 2 – Confluence of FIBO 0.5–0.618 + VPOC (3350 – 3335)
→ A technically significant area where multiple factors align — ideal for medium-to-long term entries.
📌 Trade Setup Ideas
🔸 BUY ZONE: 3351 – 3349
Stop Loss: 3344
Take Profit Targets:
3355 – 3360 – 3365 – 3370 – 3375 – 3380 – 3390 – 3400 – ???
🔸 BUY SCALP ZONE: 3366 – 3364
Stop Loss: 3360
Targets: 3370 – 3375 – 3380 – 3385 – 3390
🔻 SELL ZONE: 3420 – 3422
Stop Loss: 3427
Targets: 3415 – 3410 – 3405 – 3400 – 3390 – 3385
⚠️ Market Risk Reminder
While no major economic data is expected today, that doesn’t mean the market will stay calm. Unexpected volatility can still arise from geopolitical tensions or unscheduled central bank comments. Gold tends to compress and break out aggressively in low-news environments.
📌 Protect your capital with disciplined Stop Loss and Take Profit levels — no forecast is ever 100% certain.
📈 Strategic Outlook
Short-term bias: Market is likely to continue correcting
Medium to long-term plan: A deeper pullback could offer an excellent opportunity to build long positions from key demand zones, especially as markets begin to price in potential Fed rate cuts and gold continues its long-term bullish trend.
💬 Be patient, wait for confirmations, and trade with a clear plan — that’s what separates consistency from chaos.

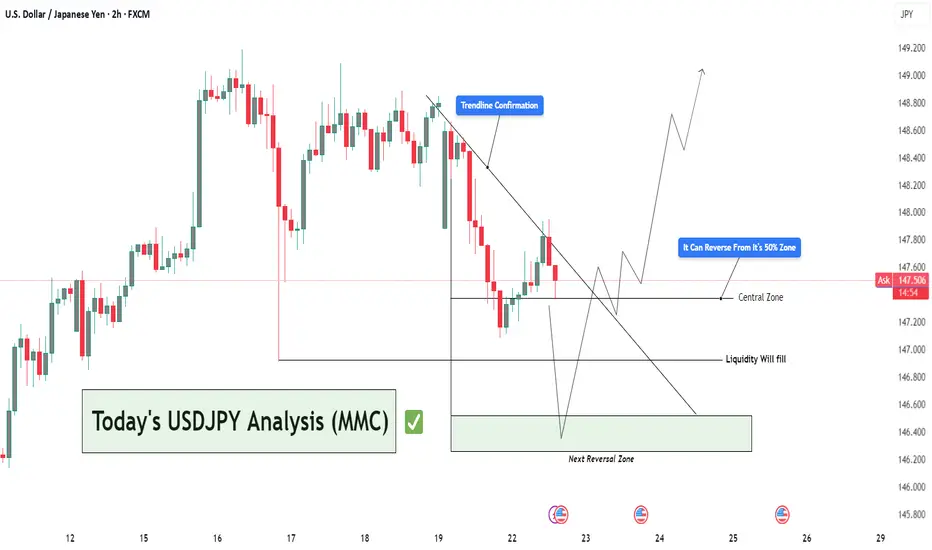
USDJPY Analysis : Trendline Breakout, Liquidity Trap & MMC Zone🔍 Full Technical Breakdown:
In today’s USDJPY 2H chart, the market is unfolding exactly as per Mirror Market Concepts (MMC). We’ve identified a clean trendline breakout, and now price is reacting between the Central Zone (50%) and the Next Reversal Zone, where liquidity is expected to be filled. Let's break down each zone and movement to understand how price is being manipulated and where we can take action.
🔵 1. Trendline Confirmation – The First Sign of Strength
The trendline was tested multiple times from the top, acting as resistance. But recently, price broke above this line with strength, signaling a potential bullish reversal. You've rightly marked it as "Trendline Confirmation" — this is where structure shifted from bearish to bullish.
This is a classic MMC principle — breakout above manipulated resistance, followed by a pullback for re-entry.
The breakout wasn’t just a wick; it had body strength, indicating real buyer presence.
Now, price is pulling back to retest the trendline from above, a typical MMC behavior before continuing upward.
⚖️ 2. Central Zone – The 50% Trap
This zone represents the midpoint of the last major impulsive move. It's where most traders get confused, and institutions re-balance their entries.
You've highlighted: “It Can Reverse From Its 50% Zone” – and that’s accurate.
According to MMC, this is where smart money traps late sellers, takes liquidity, and initiates the next bullish leg.
If price holds above the 147.200–147.500 zone, we could see buyers stepping in aggressively.
🟩 3. Liquidity Fill – Next Reversal Zone
If price doesn’t hold the Central Zone, we don’t panic — this is where MMC becomes powerful.
Beneath current structure lies liquidity — previous stop hunts and unfilled orders.
That area is your Next Reversal Zone around 146.200–146.400.
It’s a liquidity trap — market might dip there just to manipulate emotional traders, then reverse with force.
This is exactly where you’ve written “Liquidity Will Fill” — meaning smart money might fill orders there before moving up.
🧭 Possible Price Paths:
🔼 Bullish Scenario (High Probability):
Trendline retest holds as support.
Price bounces from the 50% Central Zone.
Targets: 148.800 – 149.200 (previous highs and clean breakout zone).
Confirmation: Bullish engulfing candle or strong wick rejection at Central Zone.
🔽 Bearish Trap Scenario (MMC-Based):
Price dips below Central Zone into liquidity zone.
Traps sellers and triggers stop-losses.
Reverses sharply from Next Reversal Zone (Liquidity Zone).
This is where smart money positions themselves for the real move up.
🧠 MMC Insight:
This structure is textbook MMC – clean manipulation zones, false breakout traps, and a trending bias powered by smart liquidity plays.
Trendline breakout = initial intent
Central zone = confusion zone
Liquidity trap = entry for smart money
📢 The goal is not to predict, but to react with precision when the market reveals its hand.
🕒 Timeframe: 2H
📌 Strategy: Mirror Market Concepts (MMC) | Trendline + Liquidity + Midpoint Trap
📈 Bias: Bullish, but waiting for confirmation at either Central or Liquidity Zone
🔍 Sentiment: Cautiously Optimistic