"EUR/USD Technical Blueprint: Bullish Continuation EUR/USD Technical Blueprint: Bullish Continuation Patterns and Strategic Price Zones Explained
🔹 Market Structure & Trend
The chart shows a clear shift from a ranging phase into a bullish breakout:
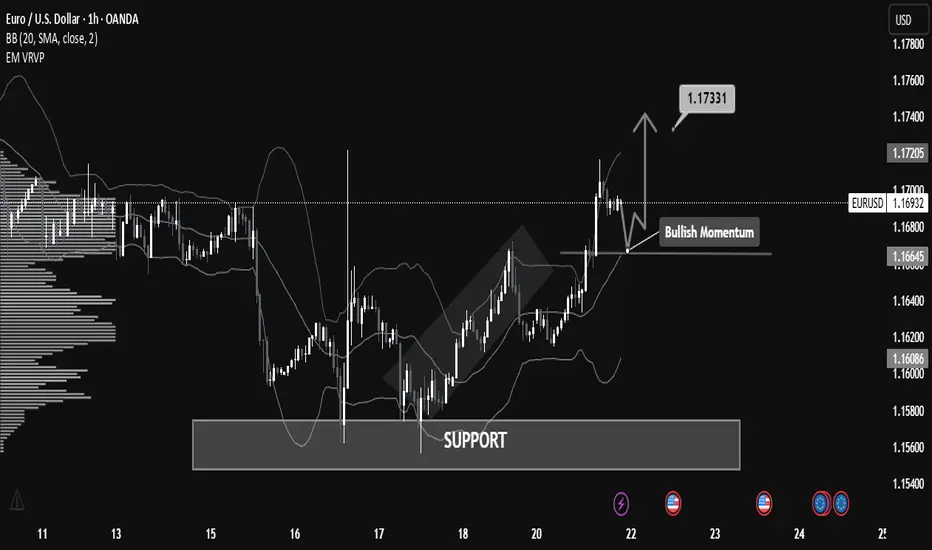
Price previously consolidated in a broad horizontal channel, with a strong demand zone (support) established between 1.16000 – 1.16600.
Following a deep liquidity grab on July 17-18, the price bounced sharply from support, creating higher highs and higher lows – a classic bullish structure.
Current momentum shows bullish continuation, as the price broke above local resistance around 1.16645 and is now forming a potential bull flag or bullish pennant pattern.
🟢 Bullish Momentum Confirmation
Price is currently retesting the broken resistance (now acting as support at 1.16645).
If the support holds and bullish momentum continues, the measured move target projects a price move toward 1.17331, the next significant resistance level.
This is also supported by increased volume activity in the breakout zone, as seen on the VPVR.
📊 Key Technical Levels
Level Type Description
1.16000 Major Support Historical demand zone + liquidity grab
1.16645 Support Zone Previous resistance, now retest area
1.16926 Current Price Bullish consolidation forming
1.17331 Resistance Bullish target based on breakout projection
1.17700+ Extension Potential continuation level if momentum persists
🧠 Volume & Volatility Insight
Bollinger Bands are expanding post-breakout, indicating increasing volatility and a potential trend continuation.
VPVR shows a high-volume node around 1.166, confirming it as a strong demand zone.
🔎 Outlook & Strategy
✅ Bullish Bias
As long as the price remains above 1.16645, buying dips could be a favorable strategy.
A break above 1.17000 with strong volume could open a path toward 1.1733 and higher.
❌ Invalidation Level
A strong close below 1.16600 would invalidate the bullish setup and could return price to the lower support around 1.16000.
📌 Conclusion
EUR/USD is displaying strong bullish momentum after breaking a key resistance level and forming a solid support base. A breakout above 1.17000 may lead to a continuation toward 1.17331 and potentially higher. This setup favors bullish positioning with tight risk management.
Forexeurusd
EUR/USD Bearish Setup: QM + Breakout Play Targeting Demand Zone!Hello guys!
I think eurusd is bearish! why?
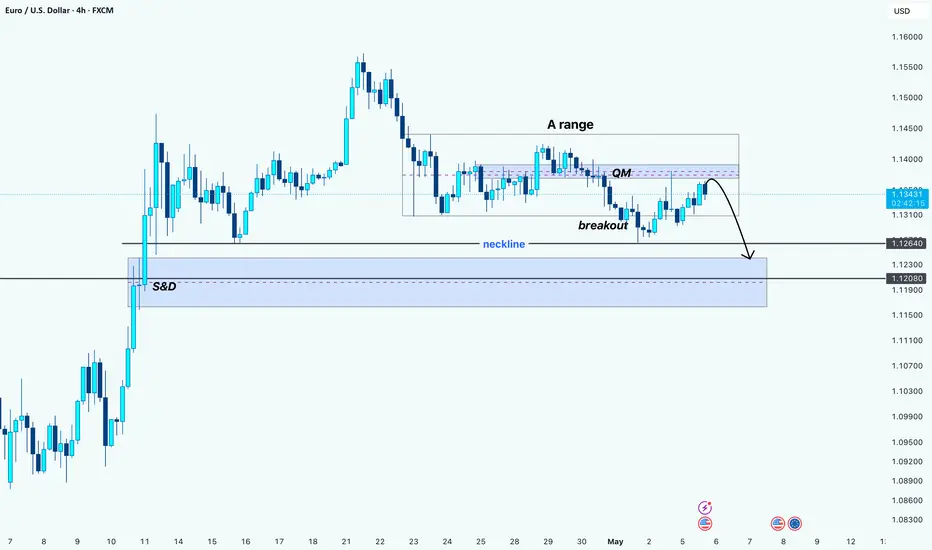
A Range: Market consolidated in a tight horizontal range before breaking out.
QM Pattern: A lower high and lower low structure indicates potential for a trend reversal.
Neckline Break: Bearish confirmation with a strong break and close below neckline support.
Retest Zone: Price is now revisiting the QM supply zone, offering a high-probability short setup.
Bearish Projection: The next expected move is a drop toward the S&D (Support & Demand) zone between 1.12640 and 1.11900, which aligns with historical demand and previous accumulation.
________________________
🎯 Bearish Target Zone:
First TP: 1.12640
Final TP: 1.11900 - 1.12080 (Demand Zone)
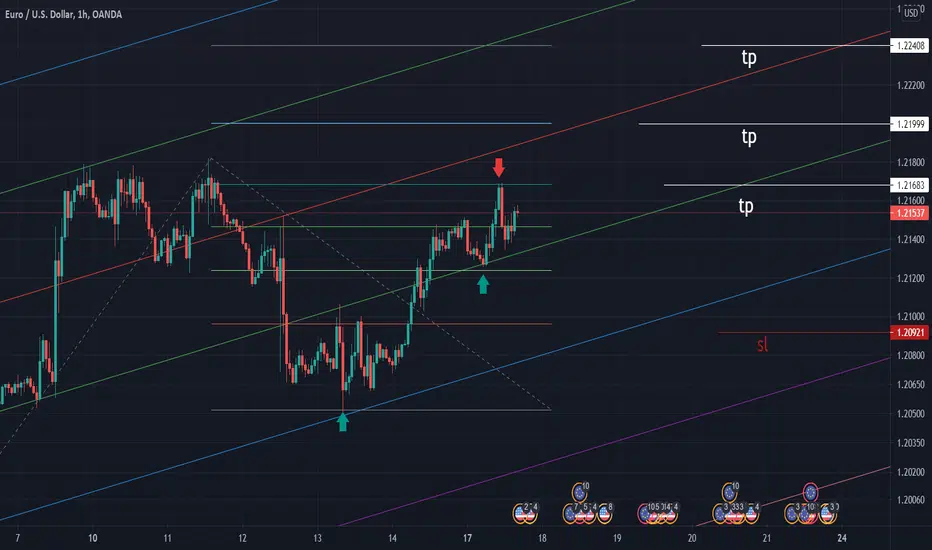
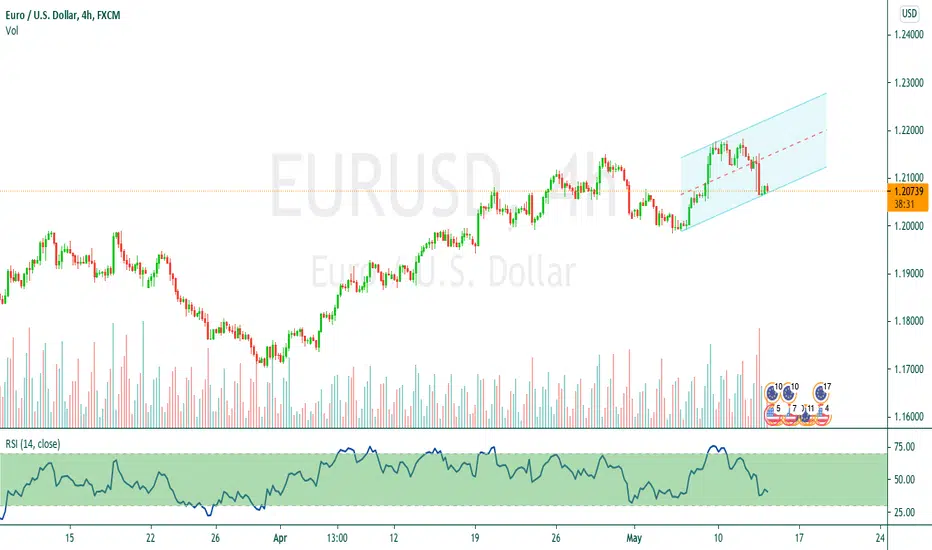
EURUSD - DAY TRADE VIEWEURUSD - As per the parallel channel it's running around a support zone and potential likely to reverse from here,
Go for buy here around 1.20740
Potential upside target 1.21250
Maintain stop loss around 1.20350
Follow the levels as mentioned in the chart.
Hit the like button and write in the comment section to get more such signals.