#XAUUSD 1DAYXAUUSD (1D Timeframe) Analysis
Market Structure:
The price is currently approaching a descending trendline resistance, which has consistently limited upward movement in the past. This suggests that the trendline may act as a barrier again, potentially leading to a reversal.
Forecast:
A sell opportunity is expected if the price respects the trendline resistance and shows signs of rejection, signaling a possible move to the downside.
Key Levels to Watch:
Entry Zone: Near the trendline resistance after confirmation of rejection.
Risk Management:
Stop Loss: Placed above the trendline resistance or the recent swing high to manage risk.
Take Profit: Target the next support levels or Fibonacci retracement areas for potential downside objectives.
Market Sentiment:
Bearish sentiment is likely to dominate as long as the price remains below the trendline resistance, maintaining a downward bias in the short term. Proper confirmation is recommended before entering the trade.
Forexmarket

#AUDCHF 1DAYAUDCHF (1D Timeframe) Analysis
Market Structure:
The price is currently testing a descending trendline resistance, which has consistently acted as a barrier to upward movement. This suggests the potential for selling pressure to emerge at this level.
Forecast:
A sell opportunity may arise if the price fails to break above the trendline and shows signs of rejection, indicating a likely move to the downside.
Key Levels to Watch:
Entry Zone: Near the trendline resistance after confirmation of rejection.
Risk Management:
Stop Loss: Placed above the trendline resistance or recent swing high to minimize risk.
Take Profit: Target the next support levels or Fibonacci retracement zones for potential downside movement.
Market Sentiment:
The price action at the trendline indicates bearish sentiment, with sellers likely to dominate if the resistance holds firm.

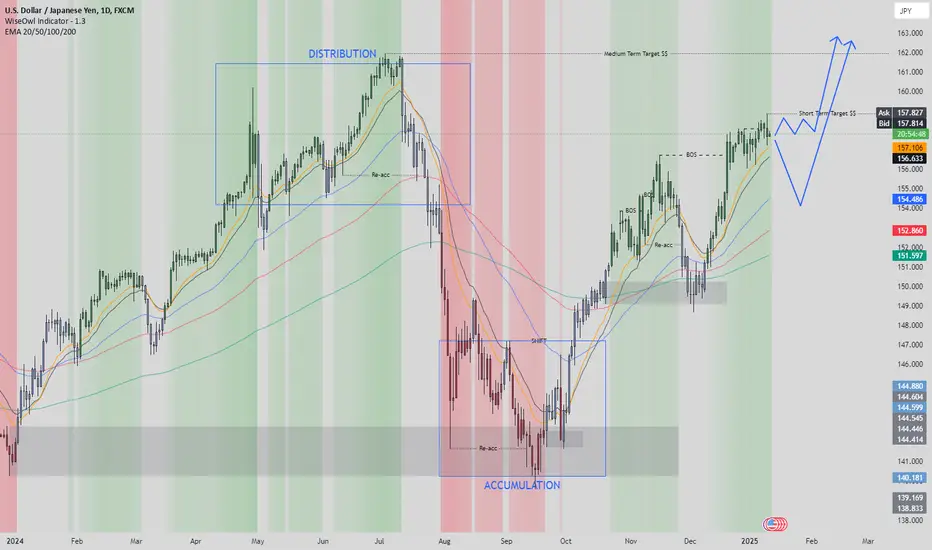
USD/JPY (UJ) Analysis (Daily Timeframe)The USD/JPY pair has been following a clear market cycle, transitioning from distribution to markdown , followed by accumulation , and now entering a bullish markup phase , showcasing strong bullish momentum.
Key Observations:
Market Phases:
Distribution Phase: The bullish move ended near the 162 level , where sellers gained control, initiating a markdown.
Accumulation Phase: After a significant markdown, UJ found a base around the 140 level, forming an accumulation phase with demand coming back into the market.
Current Phase: The pair has now broken out of accumulation and is in a bullish move, with a well-defined structure of higher highs and higher lows.
EMA Surfing and Momentum:
The price is currently surfing upward along the EMAs , showing strong trend-following behavior with EMAs acting as dynamic support.
The tightening of the EMAs during the accumulation phase has now expanded , supporting the continuation of the bullish move.
Scenarios to Watch:
Continuation to Targets:
USD/JPY could continue its bullish momentum toward the short-term target near 159 and potentially the medium-term target around 162. This aligns with the ongoing strength in the USD and the current bullish structure .
Pullback for Reaccumulation:
A potential retracement could act as a reaccumulation phase, gathering liquidity before resuming the uptrend.
eurjpy buy signal. Don't forget about stop-loss.
Write in the comments all your questions and instruments analysis of which you want to see.
Friends, push the like button, write a comment, and share with your mates - that would be the best THANK YOU.
P.S. I personally will open entry if the price will show it according to my strategy.
Always make your analysis before a trade

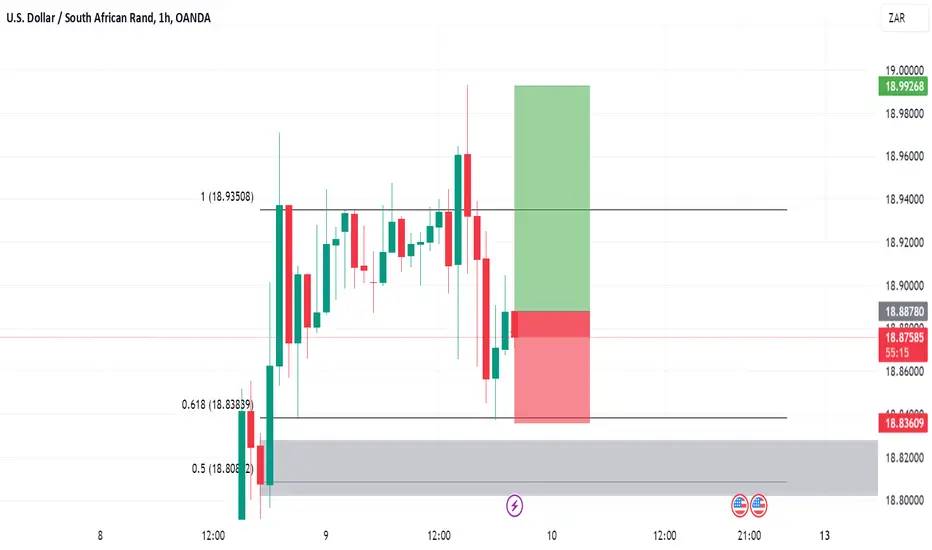
USDZAR BUYOANDA:USDZAR BUY
CONCULUSION. WEAKLY UPTRENT
DAILY UPTRENT
4HR golden zone rejection but not close
early entry or candle close entry
USDZAR BUYOANDA:USDZAR BUY
CONCULUSION. WEAKLY UPTRENT
DAILY UPTRENT
4HR golden zone rejection but not close
early entry or candle close entry

NZD/USD Poised for a Breakout ?The NZD/USD pair shows signs of potential bullish momentum following a bounce from a key support level near 0.55900. Price is currently challenging the 0.56028 resistance, with further upside likely if this level is broken and sustained. The downward sloping moving average indicates a prevailing bearish trend, so this move could be a short-term retracement or a possible trend reversal depending on market strength.
Key Insights
Entry Area: Around 0.55940 – 0.56028
Stop-Loss: 0.55103 to manage downside risk
First Target: 0.56156
Second Target: 0.56370
Final Target: 0.56781
Watch for a confirmed breakout above 0.56028 for a continuation toward higher levels. A failure to hold above 0.55900 could trigger further downside movement. Market volatility and U.S. dollar news should be closely monitored for momentum shifts. This setup offers a solid risk-to-reward ratio, balancing caution and opportunity in the current market structure.

#AUDNZD 1DAYAUDNZD (1D Timeframe) Analysis
Market Structure:
A bearish engulfing candlestick pattern has formed, indicating strong selling pressure at the current price level. This pattern suggests that the bulls have lost control, and the bears are likely to dominate in the near term.
Forecast:
A sell opportunity is expected as the price shows signs of reversal following the bearish engulfing pattern, signaling potential downside movement.
Key Levels to Watch:
Entry Zone: After confirmation of the bearish engulfing pattern.
Risk Management:
Stop Loss: Placed above the high of the engulfing candle to limit risk.
Take Profit: Target the next support levels for potential downside targets.
Market Sentiment:
The bearish engulfing pattern signals a shift in market sentiment, with selling pressure expected to continue as long as the price stays below the recent high.

#USDJPY 2HUSDJPY (2H Timeframe) Analysis
Market Structure:
The price is currently testing a key resistance level, which has previously acted as a barrier to upward movement. Signs of rejection at this level indicate potential selling pressure.
Forecast:
A sell opportunity is anticipated if the price continues to face rejection from the resistance zone, signaling a possible move downward.
Key Levels to Watch:
Entry Zone: Near the resistance level after confirmation of rejection.
Risk Management:
Stop Loss: Placed above the resistance zone or recent swing high to minimize risk.
Take Profit: Target the nearest support levels for potential downside movement.
Market Sentiment:
Selling pressure is expected to dominate as long as the price remains below the resistance level, maintaining a bearish outlook.

#XAGUSD 2HXAGUSD (2H Timeframe) Analysis
Market Structure:
The price has broken above a key resistance level, which is now acting as support. This change in role indicates potential bullish momentum, with buyers likely to dominate if the level holds.
Forecast:
A buy opportunity is expected as the price respects the new support level, confirming the breakout and signaling further upward movement.
Key Levels to Watch:
Entry Zone: Near the support level after confirmation that the price is holding above it.
Risk Management:
Stop Loss: Placed below the support level to limit downside risk.
Take Profit: Target the next resistance levels or Fibonacci extensions for potential upside movement.
Market Sentiment:
The transition of resistance into support reflects strengthening buying interest, favoring upward continuation as long as the support holds.

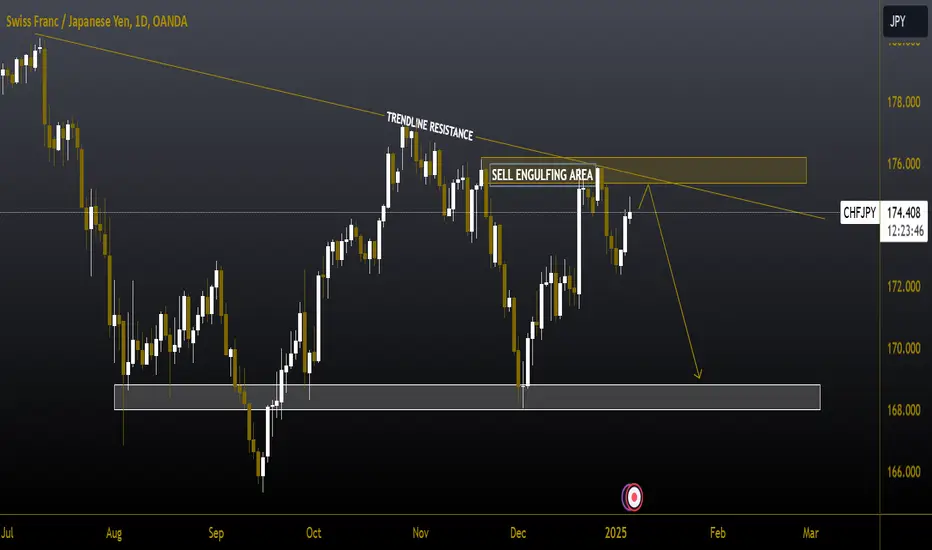
#CHFJPY 1DAYCHFJPY (1D Timeframe) Analysis
Market Structure:
The price is testing a trendline resistance, which has previously acted as a barrier to upward movement. A bearish engulfing candlestick pattern has also formed near this resistance zone, indicating potential selling pressure.
Forecast:
A sell opportunity is anticipated as the price faces rejection from the trendline resistance, supported by the bearish engulfing pattern signaling downside potential.
Key Levels to Watch:
Entry Zone: Near the trendline resistance after confirmation of rejection.
Risk Management:
Stop Loss: Placed above the trendline resistance or the high of the bearish engulfing candle.
Take Profit: Target the next support levels or Fibonacci retracement zones for potential downside targets.
Market Sentiment:
Bearish signals suggest sellers may take control if the price remains below the trendline resistance, maintaining downward momentum.
#GBPCHF 1DAYGBPCHF (1D Timeframe) Analysis
Market Structure:
The price is trading within a descending channel, respecting both resistance and support levels. It is currently near the upper boundary of the channel, suggesting potential selling pressure.
Forecast:
A sell opportunity may develop if the price respects the channel resistance and shows signs of rejection, indicating a possible move toward the lower boundary of the channel.
Key Levels to Watch:
Entry Zone: Near the channel resistance after confirmation of rejection.
Risk Management:
Stop Loss: Placed above the channel resistance or recent swing high to minimize risk.
Take Profit: Target the midline or lower boundary of the channel for potential downside movement.
Market Sentiment:
The price structure within the channel indicates a bearish outlook, with selling pressure likely to continue as long as the price remains below the resistance level.

#USDJPY 2HUSDJPY (2H Timeframe) Analysis
Market Structure:
The price is trading within a channel pattern, respecting both support and resistance levels. Currently, it is near the upper boundary of the channel, indicating possible resistance.
Forecast:
Wait for a retest of the channel resistance before considering a sell position, as confirmation is required to validate a potential move downward.
Key Levels to Watch:
Entry Zone: After a retest and rejection from the upper boundary of the channel.
Risk Management:
Stop Loss: Placed above the channel resistance or recent swing high.
Take Profit: Target the midline or lower boundary of the channel for potential downside movement.
Market Sentiment:
The setup suggests a cautious bearish bias, but confirmation signals are needed before executing a trade.

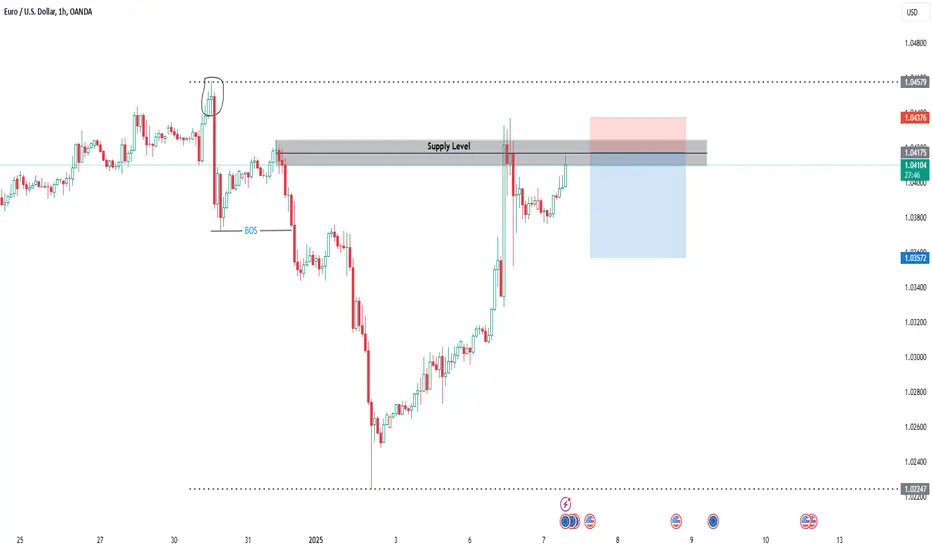
EUR USD Trade Setup 1 hour timeframe EUR USD Entry Setup 1 hour timeframe
On the 1 hour timeframe EUR USD has formed a supply level + a Double Top pattern at the supply level, now we wait for candlestick pattern for entry confirmation.
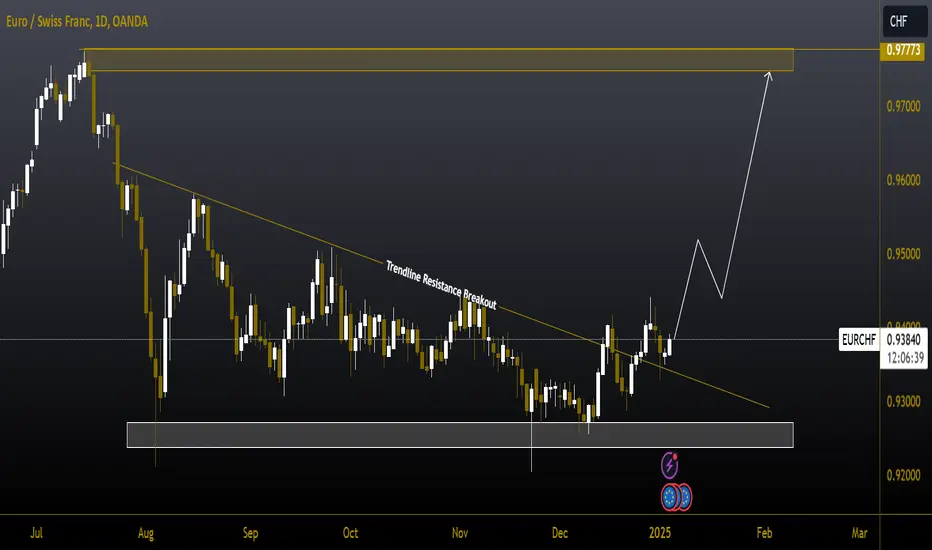
#EURCHF 1DAYEURCHF (1D Timeframe) Analysis
Market Structure:
Trendline Resistance Breakout: The price has broken above a key descending trendline resistance, signaling a potential shift towards bullish momentum.
Forecast:
Buy Opportunity: The breakout suggests increased buying interest, with expectations for further upward movement if the price sustains above the broken trendline.
Key Levels to Watch:
Entry Zone: Consider buying after confirmation of the breakout or on a retest of the trendline as new support.
Risk Management:
Stop Loss: Placed below the broken trendline or recent swing low to minimize risk.
Take Profit Zones: Focus on the next resistance levels or Fibonacci extensions for potential targets.
Market Sentiment:
Bullish Bias: The breakout indicates a potential trend reversal, favoring buyers as long as the price remains above the trendline support.
#EURCAD 1DAYEURCAD (1D Timeframe) Analysis
Market Structure:
Support Trendline Breakdown: The price has broken below a key ascending trendline support, indicating potential weakness and bearish pressure.
Forecast:
Wait for Retest, Then Sell: A retest of the broken trendline as new resistance could provide confirmation for a selling opportunity.
Key Levels to Watch:
Entry Zone: Look for price rejection at the retest of the trendline or near resistance areas before entering a sell position.
Risk Management:
Stop Loss: Placed above the retest zone or recent swing high to limit risk.
Take Profit Zones: Target nearby support levels or Fibonacci extensions for potential downside moves.
Market Sentiment:
Bearish Bias: The breakdown suggests sellers are gaining control, but waiting for a retest offers a safer entry point to confirm the trend reversal.

#XAGUSD 4HXAGUSD (4H Timeframe) Analysis
Market Structure:
Resistance Trendline Breakout: The price has broken above a key descending trendline resistance, indicating a potential shift in momentum toward the upside.
Forecast:
Buy Opportunity: The breakout suggests bullish momentum, with further upward movement likely as long as the price holds above the broken trendline.
Key Levels to Watch:
Entry Zone: After breakout confirmation or a retest of the trendline as new support.
Risk Management:
Stop Loss: Placed below the broken trendline or recent swing low to limit downside risk.
Take Profit Zones: Focus on the next resistance levels or Fibonacci projections for potential targets.
Market Sentiment:
Bullish Bias: The breakout above trendline resistance reflects increased buying interest, supporting expectations for further gains.

#BTCUSD 4HBTCUSD (4H Timeframe) Analysis
Market Structure:
Resistance Zone: The price is currently testing a key resistance area, showing signs of selling pressure.
Bearish Engulfing Area: A bearish engulfing candlestick pattern has formed near the resistance level, indicating potential downside movement.
Forecast:
Sell Opportunity: The presence of a bearish engulfing pattern at resistance suggests a possible rejection, signaling a short-term sell setup.
Key Levels to Watch:
Entry Zone: Near the resistance area after bearish confirmation.
Risk Management:
Stop Loss: Above the resistance zone or the high of the bearish engulfing candle to limit risk.
Take Profit Zones: Target the nearest support levels or Fibonacci retracement areas for downside targets.
Market Sentiment:
Bearish Bias: Selling pressure at resistance highlights a potential reversal, favoring short positions as long as the price stays below the resistance zone.

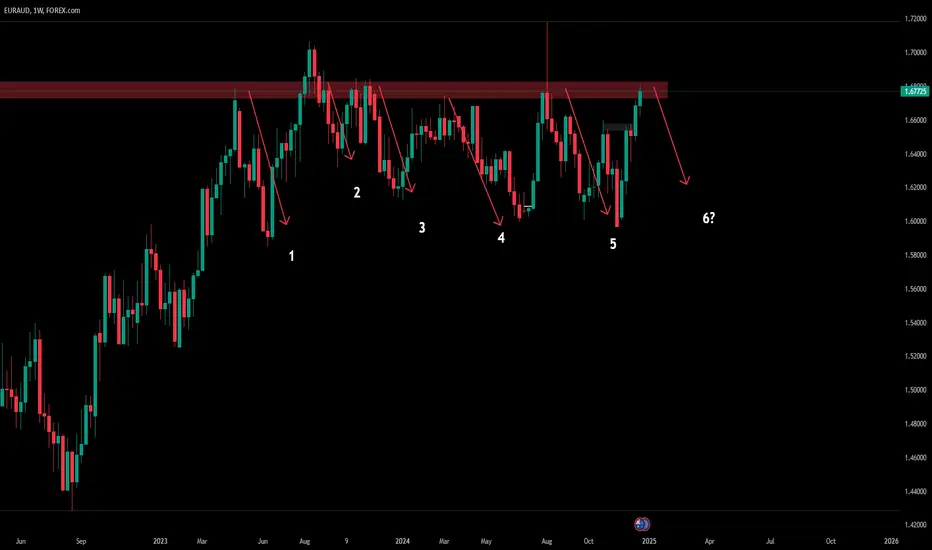
EURAUD | Big Resistance Zone EURAUD is heading in this big resistance zone. Since last year price has been rejected up to 5 times.
Last 5 weeks I was looking for long positions but will be looking for a shift of the trend.
Let me know what you think!
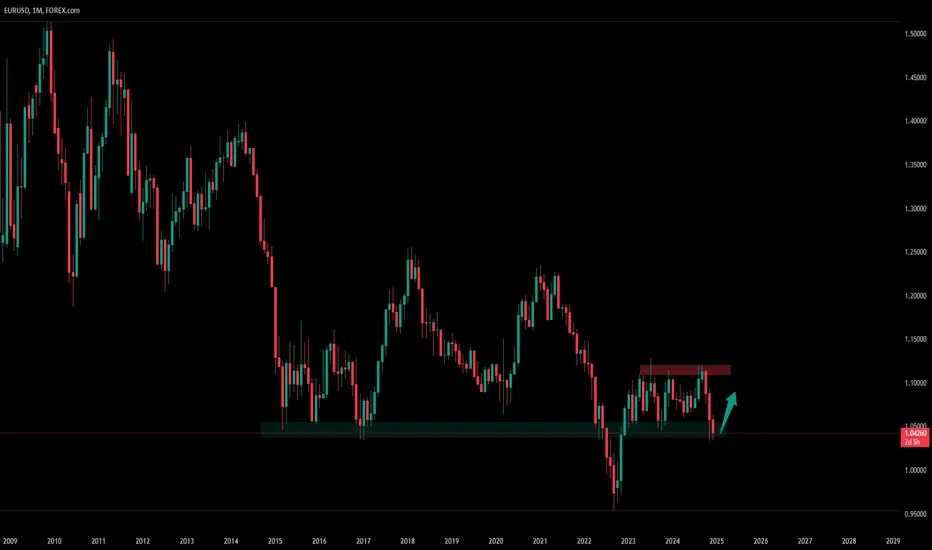
EURUSD | Big Monthly Support ZoneWe have seen the first monthly candle close with a big wick showing there is some kind of reaction to this zone. Will be looking on the lower time frames for bullish chart patterns for an entry.
Let me know what your outlook is!
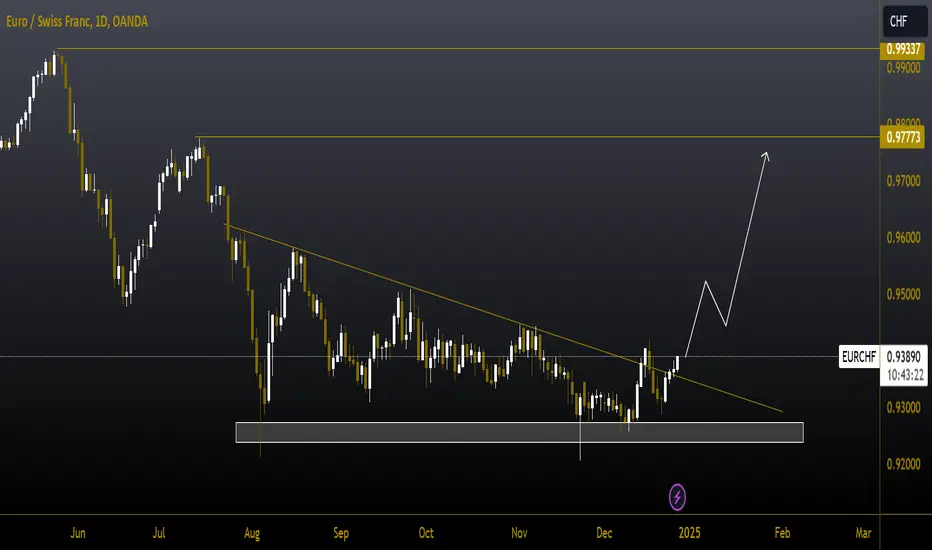
#EURCHF 1DAYEURCHF (1D Timeframe) Analysis
Market Structure:
-Trendline Resistance Breakout: The price has successfully broken above a key trendline resistance, signaling a potential shift in momentum to the upside.
Forecast:
-Buy Opportunity: The breakout suggests bullish momentum, and further upward movement is likely as long as the price stays above the broken resistance.
Key Levels to Watch:
-Entry Zone: After confirmation of the breakout or on a retest of the trendline as new support.
-Risk Management:
- Stop Loss: Placed below the broken trendline or recent swing low to manage risk.
-Take Profit Zones: Target the next resistance levels or Fibonacci projections for potential gains.
Market Sentiment:
Bullish Bias: The breakout above resistance highlights strengthening buying pressure, supporting further upside potential.
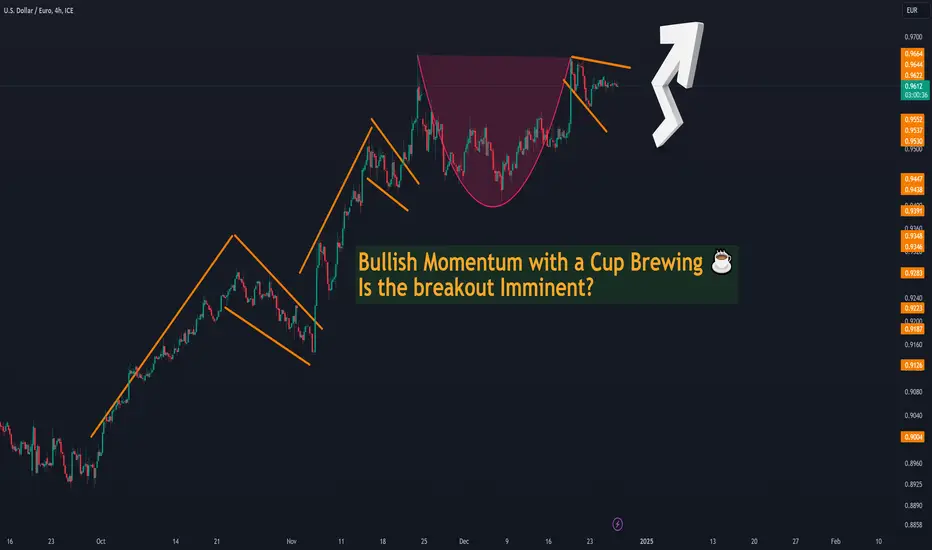
The Market Never Sleeps, and Neither Should Your Edge!Check this out, folks: The chart is looking like a bull’s playground 🐂 with more flags than an Olympic opening ceremony! 🏳️🌈 Let's break it down:
📈 Trend On Fire: Those sharp orange lines? That’s the market saying, “Pullbacks? Sure. But I’m not done climbing!” It’s a stairway to profits, baby! 💸
☕ Cup and Handle Brewing: See that big, juicy magenta cup? 🍵 This chart’s serving up a potential breakout recipe: a little consolidation, a lot of momentum, and maybe a moonshot. 🌕
🤔 But Wait, There’s More: The top triangle is throwing shade like, “I’m running out of steam.” ⚡ Could this be a fakeout before a shakeout? Or just the market catching its breath? Time will tell! ⏳
🎯 Key Levels to Watch:
Breakout above consolidation = 🚀 to new highs.
Failure? It’s time to re-test the base. 🛑
🔥 Remember, the market rewards the prepared, not the hopeful. Stay sharp, stay disciplined, and always trade with an edge. Let’s crush it, fam! 💪
#RoadToAMillion #BullishAF #CupAndHandle #GeorgeKnowsGraphs 🎄✨
Daily Analysis of GBP to USD – Issue 177The analyst believes that the price of { GBPUSD } will increase in the next 24 hours. This prediction is based on quantitative analysis of the price trend.
Please note that the specified take-profit level does not imply a prediction that the price will reach that point. In this framework of analysis and trading, unlike the stop-loss, which is mandatory, setting a take-profit level is optional. Whether the price reaches the take-profit level or not is of no significance, as the results are calculated based on the start and end times. The take-profit level merely indicates the potential maximum price fluctuation within that time frame.
