#XAUUSD #GOLD 4H#XAUUSD 4H Trade Update
Gold continues to respect its bullish market structure, with clear Breaks of Structure (BOS) and formation of higher lows. Currently, price is consolidating around a key ascending trendline and demand zone.
📍 Entry Zone: 3,340 – 3,345
🎯 Targets: 3,370 / 3,390 / 3,400
❌ Stop-Loss: Below 3,315
This setup was shared yesterday and has since been perfectly activated as price tapped into our marked demand zone.
#Gold #Silver #ForexTrading #XAUUSD #PriceAction
Forexmarket

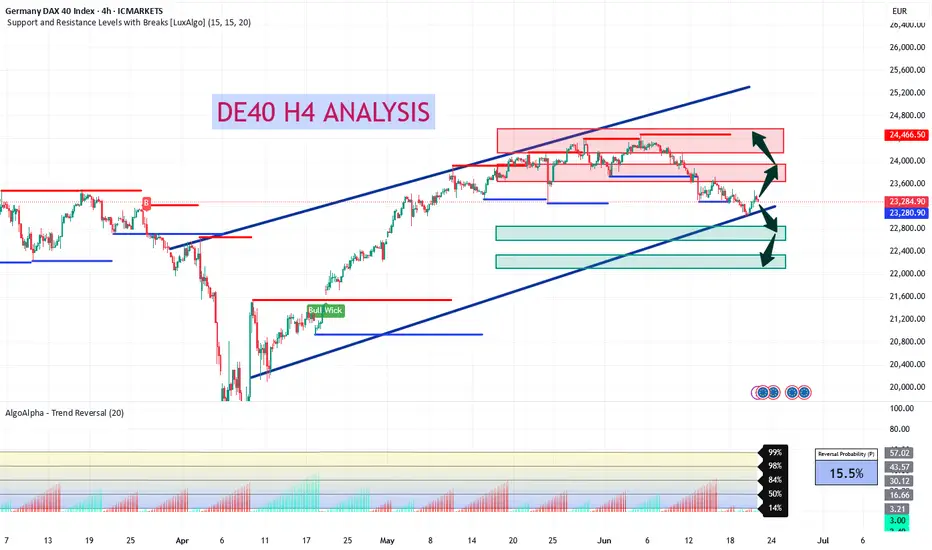
DE40 H4 Analysis 23 Jul to 27 Jul - Bullish FlagDE40 Showing a bullish Flag 23,735 - 23,800. If it breaks this zone, Most probably can fly upto 24,466 and higher. Take your risk under control and wait for market to break support or resistance on smaller time frame. Best of luck everyone and happy trading.🤗
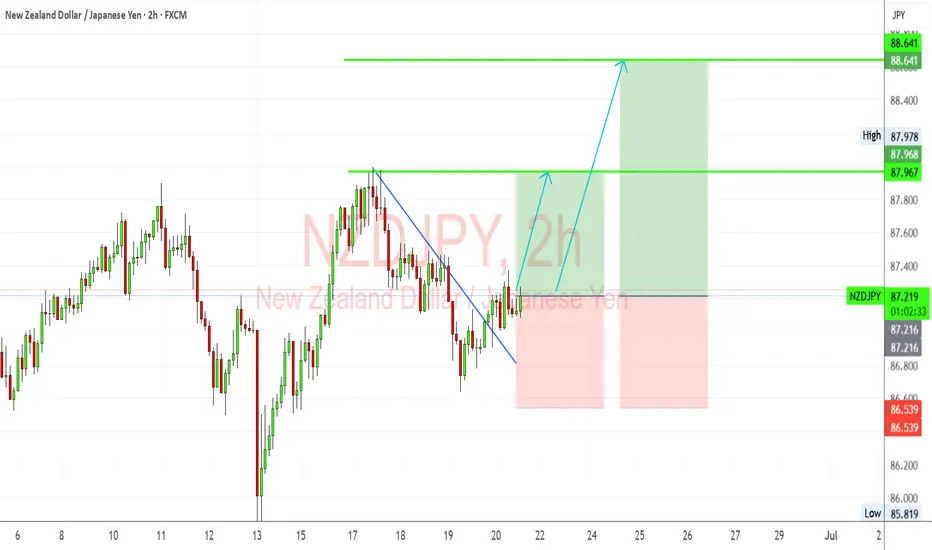
NZDJPY “Kiwi Poised to Fly as Japan Muddles ThroughNZDJPY shows a bullish breakout from a descending trendline, with bullish structure holding near 87.20–87.25.
Key resistance targets:
87.97 (Previous high)
88.64 (Next resistance / projected fib target)
Two upside scenarios are shown:
Conservative target: ~87.97
Aggressive swing: ~88.64
If 87.00–87.20 zone holds as support, expect bullish continuation.
🧩 Current Bias: Bullish
📌 Key Fundamentals Driving NZDJPY
NZD Side (Strengthening):
RBNZ hawkish hold: RBNZ recently kept rates at 5.50% and warned that inflation remains persistent, requiring prolonged tight policy.
Resilient NZ GDP: Stronger-than-expected GDP print signals economic resilience.
Terms of trade improvement: Commodity exports holding firm, China consumption rebound showing hints of demand recovery (see recent 618 festival sales data).
AUD correlation: AUD and NZD are moving together; if AUD strengthens, NZD often follows.
JPY Side (Weakening):
BoJ remains ultra-dovish: Despite inflation trends, BoJ is hesitant to tighten further, preferring gradual tapering.
Yen under pressure from yield differentials: Global central banks (like RBNZ, Fed) remain hawkish while BoJ is not.
Geopolitical funding flows: JPY used as a funding currency amid global volatility (carry trade boost for NZDJPY).
⚠️ Risks That May Reverse the Trend
BoJ surprise tightening rhetoric (e.g. bond purchase taper announcement).
China data deterioration, hurting Kiwi sentiment.
Sharp equity sell-off and geopolitical escalation (Yen safe-haven reversal).
📅 Important News to Watch
🇳🇿 NZ Trade Balance (upcoming)
🇯🇵 Tokyo Core CPI (Jun 28) – Critical for BoJ policy speculation.
RBNZ or BoJ member speeches (hawkish or dovish shifts)
Fed tone shift or US dollar strength spillover
🏁 Who Leads the Move?
NZDJPY could lead among yen crosses due to the RBNZ’s clear inflation fight versus BoJ’s passive stance. NZDJPY is also more responsive to commodity and global risk-on flows than EURJPY or USDJPY.
Trading at the Market OpenTrading at the Market Open
The market open marks a critical juncture in the financial world, presenting a unique blend of opportunities and challenges for traders. This article explores the essence of trading at the open across stocks, forex, and commodities. It delves into the heightened volatility and liquidity characteristic of this period, offering insights and strategies to navigate these early market hours effectively, setting the stage for trading opportunities.
What Does the Open Mean in Stocks, Forex, and Commodities?
The open signifies the start of the trading day for various financial markets. It's a time when trading activity surges, marked by a rush of orders that have accumulated since the previous close. In stock markets, this includes shares, indices, and Exchange-Traded Funds (ETFs). The influx of orders often leads to significant price movements as the market absorbs overnight news and global economic developments.
For forex and commodity markets, the open can vary by region, reflecting their 24-hour nature. This period is crucial for setting the tone of the trading day, offering insights into sentiment and potential trends. Traders closely watch the market open to gauge the strength of these movements, which can indicate broader market trends or sector-specific shifts.
Volatility and Liquidity at Market Open
Trading at the open is often marked by enhanced volatility and liquidity. Heightened volatility is primarily due to the influx of orders accumulated overnight, reacting to various global events and news. As traders and investors assimilate this information, rapid price movements are common, especially in the first few minutes of the session. These price fluctuations can present both opportunities and risks for traders.
Increased liquidity, which refers to the ease with which assets can be bought or sold without causing significant price movements, is also a characteristic of the open. A higher number of market participants during this period may result in better order execution and tighter bid-ask spreads, particularly in highly liquid markets like forex and major stock indices.
What to Know Before the Market Opens
In terms of things to know before the stock market opens, it's essential to review the overnight and early morning news that can affect stocks. This includes company earnings reports, economic data releases, and geopolitical events. Traders also check pre-market trading activity to gauge sentiment and potential opening price movements.
For forex and commodities, understanding global events is crucial. Developments in different time zones, like policy changes by central banks or shifts in political scenarios, can significantly impact these markets. Additionally, reviewing the performance of international markets can provide insights, as they often influence the US open.
It's also vital to analyse futures markets, as they can indicate how stock indices might open. Lastly, around the forex, commodity, and stock market openings, indicators and other technical analysis tools applied to the previous day can also offer valuable context for the day ahead.
Market Open in Different Time Zones
Market open times vary globally due to different time zones, significantly impacting trading strategies. For instance, the New York Stock Exchange (NYSE) opens at 9:30 AM Eastern Time, which corresponds to different times in other parts of the world. For traders in London, this translates to an afternoon session, while for those in Asian markets like Tokyo, it's late evening.
Forex, operating 24 hours a day during weekdays, see overlapping sessions across different regions. For example, when the Asian trading session is concluding, the European session begins and later overlaps with the North American session. Such global interconnectivity ensures that forex markets are active round the clock, offering continuous trading opportunities but also requiring traders to be mindful of time zone differences and their impact on liquidity and volatility.
Strategies for Trading at Market Open
Trading at market open requires strategies that can handle rapid price movements across all markets. Here are some effective approaches:
- Pay Attention to Pre-Market Trends: This helps traders assess how a stock might behave at the market open. If a stock is fading from post-market highs, it might be wise to wait for a trend change before entering.
- Gap and Go Strategy: This involves focusing on stocks that gap up on positive news at market open, an indicator of potential further bullishness. Traders look for high relative volume in pre-market and enter trades on a break of pre-market highs. This strategy is fast-paced and requires quick decision-making.
- Opening Range Breakout (ORB): The ORB strategy uses the early trading range (high and low) to set entry points for breakout trades across all types of assets. The breakout from this range, typically the first 30 to 60 minutes of the session, often indicates the price direction for the rest of the session. Time frames like 5-minute, 15-minute, and 30-minute are commonly used for ORB.
- Gap Reversal: The gap reversal method is used when the price creates a gap, but then the range breaks in the opposite direction. If the gap is bullish and the price breaks the lower level of the opening range, it signals a gap reversal. The same concept applies to bearish gaps but in reverse.
The Bottom Line
In essence, understanding unique features of market open trading is vital for those participating in stock, forex, and commodity markets. The opening moments are characterised by heightened volatility and liquidity, driven by global events and sentiment. However, savvy traders may capitalise on these early market dynamics with effective strategies.
This article represents the opinion of the Companies operating under the FXOpen brand only. It is not to be construed as an offer, solicitation, or recommendation with respect to products and services provided by the Companies operating under the FXOpen brand, nor is it to be considered financial advice.
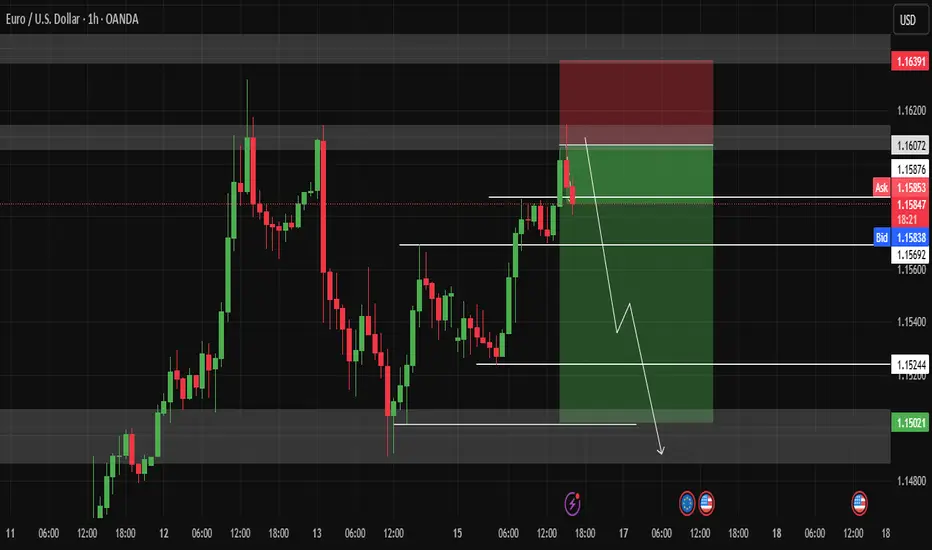
Opportunity for selling EURUSDI see that EURUSD has confirmed strong resistance, so I took a sell trade with it.
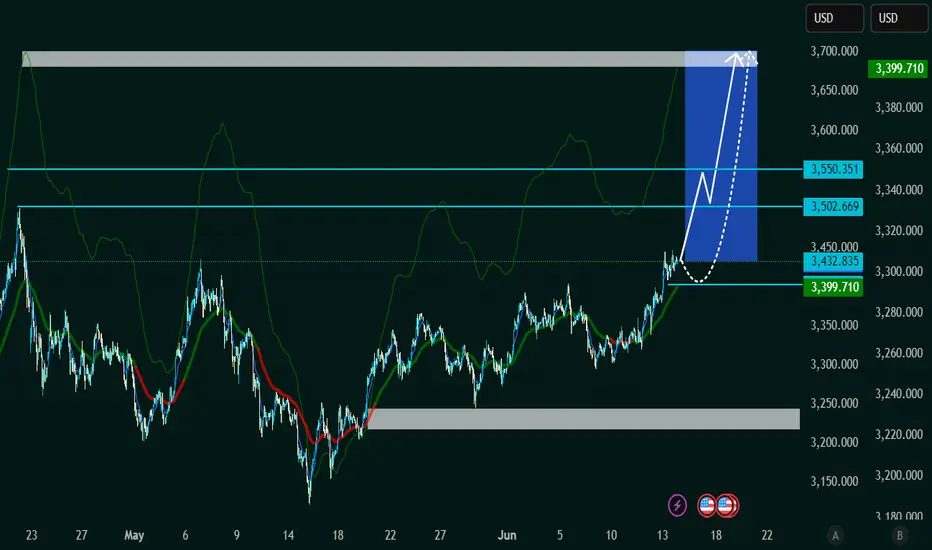
XAU/USD Bullish Continuation SetupThe chart illustrates a bullish market structure for XAU/USD, with price action currently trending upwards. Key technical observations:
Support Zone:
Price has recently bounced from a support zone around 3,399.710, indicating strong buying interest.
Bullish Projection:
A bullish continuation is expected. The chart outlines a potential scenario with a minor retracement towards 3,432.835 or 3,399.710, followed by a strong upward move.
Targets:
Immediate resistance is around 3,502.669.
If broken, price may aim for 3,550.351.
Final projected target lies near 3,680.000, which aligns with a historical supply zone.
Indicators:
The green enveloping bands suggest increasing volatility, with the price respecting the upper band, supporting bullish momentum.
Conclusion:
XAU/USD appears poised for a bullish breakout continuation. A potential pullback could offer a buy opportunity, targeting higher resistance zones as long as the structure remains intact
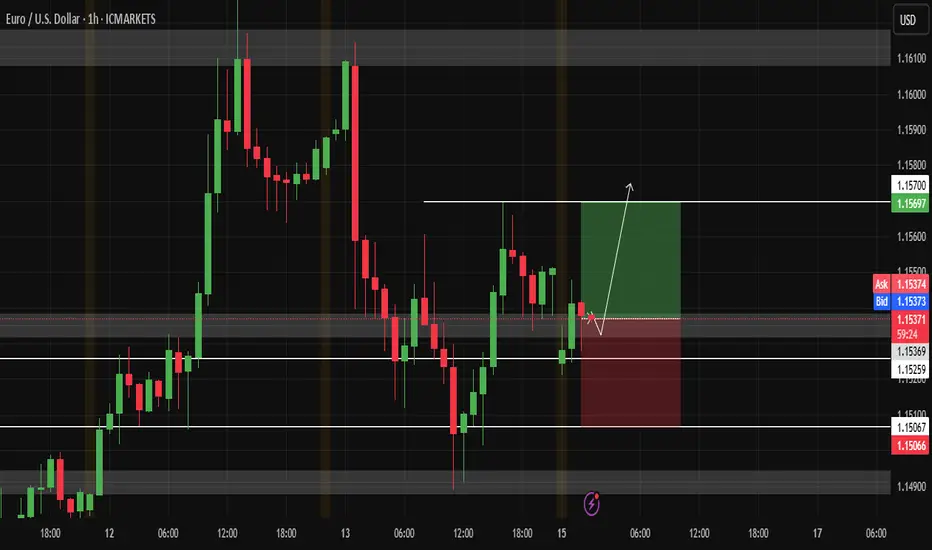
Opportunity for buying EURUSDEURUSD touched strong support, so I think it will rise further, as shown.
Week of 6/15/25: EU AnalysisEU continues to have clean market structure and has all time frames aligned for bullish movement. Looking for price to retrace to the prime 1h POI for an A+ setup.
Major News:
FOMC - Wednesday

Week of 6/15/25: AU AnalysisLast week took the prior week's high and showed large rejection. Expecting this week to take the weak low and liquidity from all the lows to at least the extreme of the daily swing.
Major news:
FOMC - Wednesday

EURGBP possible long for 0.8675 even highereurgbp weekly chart formed double bottom. eurgbp retraced back to 0.8356 and hold the previous HL (higher low)0.8317, weekly key reversal bar formed , made a new low closed on the high. indication for long for coming days and weeks. stop loss below 0.8317, target 0.8675.

EURJPY ANALYSIS After seeing the previous week close really bullish on the daily and weekly timeframes, we could expect that momentum to continue pushing but since the pair is at a HH area on the daily we could expect a pull back before the bullish move kicks in

Week of 6/8/25: EU AnalysisPrice has reached the extreme of daily bearish structure and we can see a rejection of the 4h latest push to make another high. We're following 1h internal bearish structure to at least take out the weak low, thus making 1h structure bearish and following that to the 4h extreme swing low.
Major news:
Core CPI - Wednesday

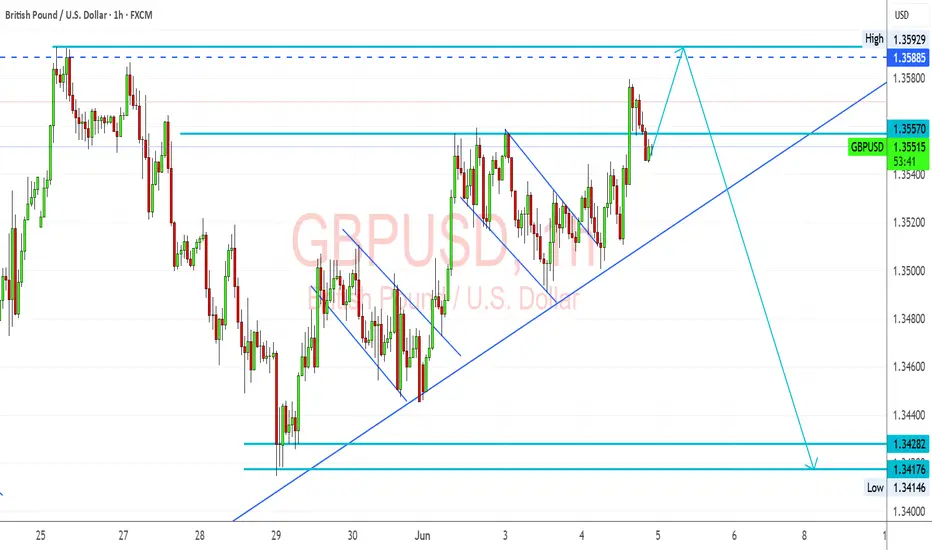
GBPUSD Approaches Key Resistance: Watch for Bearish ReversalGBPUSD pair is trading within a clearly defined ascending channel on the 1-hour chart, showing a short-term bullish structure. However, this bullish move appears corrective within a broader consolidation range capped near the 1.3590 resistance zone.
🔍 Technical Breakdown:
Current Price: 1.35535
Immediate Resistance: 1.35885–1.35929 (previous highs and psychological level)
Support Levels:
Trendline support near 1.3530
Horizontal support: 1.34282, 1.34176
Structure:
Price has formed a bullish flag breakout and is now approaching key resistance.
A new higher high is anticipated toward 1.3590, but this level has repeatedly rejected price in the past.
The projected path indicates a potential liquidity grab above 1.3590 followed by a sell-off toward 1.3420–1.3410 area, aligning with a trendline break scenario.
Bearish Scenario:
A strong rejection from the 1.3590 zone, especially if accompanied by bearish divergence or a strong candle close, could trigger a shift back down to the 1.3417–1.3428 support zone.
This would confirm a short-term top and potential retracement toward lower liquidity zones.
📊 Fundamental Backdrop:
USD-side:
Recent U.S. labor market strength (e.g. ADP report and low jobless claims) supports a hawkish bias, favoring USD upside.
However, Fed policymakers remain cautious due to trade tensions and tariff uncertainty. This has injected short-term volatility into USD pairs.
GBP-side:
UK economic data has been mixed, with GDP growth forecasts under scrutiny.
BoE policymakers are dovish, emphasizing weak productivity and wage pressures, making the pound vulnerable to downside catalysts.
📌 Conclusion:
Watch for a potential bull trap near 1.3590, followed by a bearish reversal toward 1.3420–1.3410 if momentum weakens and sellers step in. This would complete the expected technical leg down and align with broader risk sentiment if dollar strength returns.
EURO-USD BUY STRONG 1. "EUR/USD Strong Buy Alert 🚀 | Key support zone holding firm – bulls eyeing the next leg up!"
2. "Strong Buy Zone ✅ | EUR/USD showing bullish momentum from this support level – eyes on 1.09+"
3. "EUR/USD Reversal Zone 💥 | Buyers stepping in strong – potential rally ahead!"
4. "Watch this zone! EUR/USD strong buy setup forming – bullish confirmation underway 📈"
5. "EUR/USD bouncing from key demand zone 🔥 | Technicals align for a strong buy signal!"

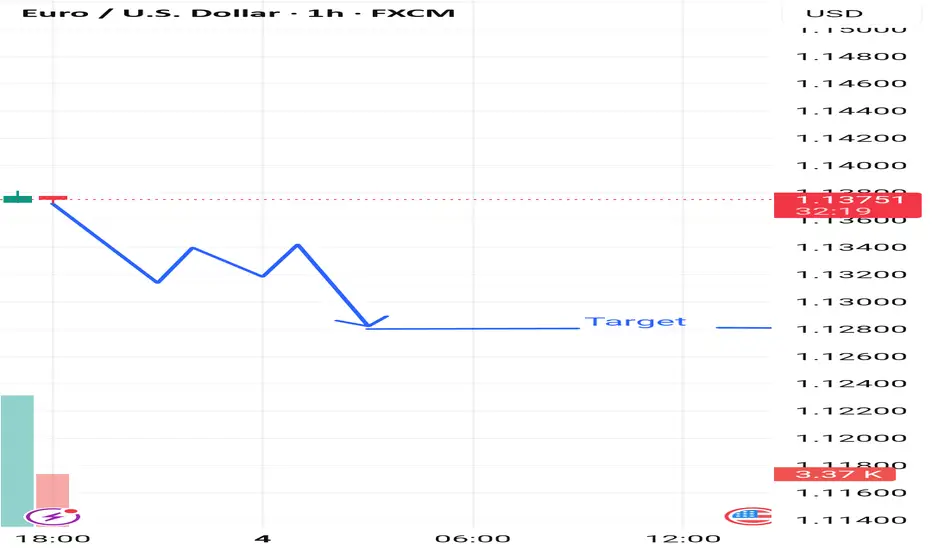
Market next move Disruption of the Downtrend Analysis
The chart currently suggests a bearish breakout with a downside target near 1.12900. Let’s challenge that:
---
🟩 Bullish Reversal Possibility
1. Support Zone Near 1.1370:
Price has shown signs of stabilizing around the 1.1370 level.
Multiple wicks below the candles suggest buyer interest at this level.
2. Low Volume on Recent Red Candles:
A decreasing volume trend on recent red candles can indicate weak bearish momentum.
Bulls may be waiting to enter on a breakout above the 1.1380–1.1390 zone.
3. Potential for Fakeout:
The sharp expected drop might be a bear trap.
If price breaks back above 1.1385 with strong volume, it could invalidate the bearish thesis.
4. RSI/Momentum Divergence (Assumed):
If momentum indicators (not shown) display bullish divergence, this strengthens the case for a reversal
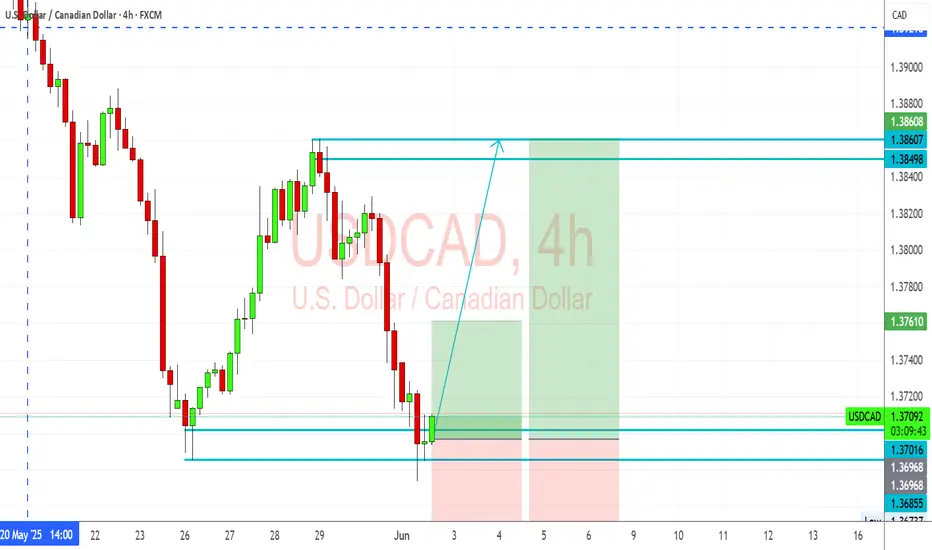
USDCAD Rebound from Key Support – Bullish Setup in PlayUSDCAD pair has reached a technical inflection point at key support around 1.3700, where it is attempting a rebound after several days of bearish momentum. With recent Canadian data showing underlying economic strain and the U.S. dollar reacting to rate expectations and tariff news, this area becomes crucial for the next directional move.
🔍 Technical Analysis
Support Level: Price has respected the horizontal support at 1.3700–1.3685, forming a possible double-bottom structure on the 4H chart.
Bullish Reversal Zone: The latest candle shows a strong rejection wick at the support zone, suggesting bullish interest. The structure aligns with a classic bullish reversal pattern.
Target Zones:
First TP: 1.3849 (previous high / supply zone).
Second TP: 1.3860–1.3870 (Fibonacci extension + minor resistance).
Invalidation (SL): Below 1.3685, further downside may open to 1.3632.
🧠 Fundamental Context
U.S. Side:
GDP and NFP data have recently come out mixed, reducing the immediate pressure on the Fed to hike rates further.
Tariff uncertainty and appeal plans by the Trump administration are increasing near-term USD volatility.
US bond yields are firming again, giving the dollar mild support.
Canada Side:
Canadian Q1 GDP disappointed at 0.1%, lower than expected.
BoC is likely to hold rates steady, but the economy shows weak business investment and softening consumption growth.
Crude oil, Canada’s key export, is still under pressure, slightly weakening CAD.
✅ Conclusion
This setup favors a short-term long on USDCAD from current levels, targeting the upper resistance zone at 1.3849–1.3860. A break and close above 1.3870 could extend toward 1.3900. However, caution should be exercised with upcoming U.S. labor and trade data that may fuel volatility.
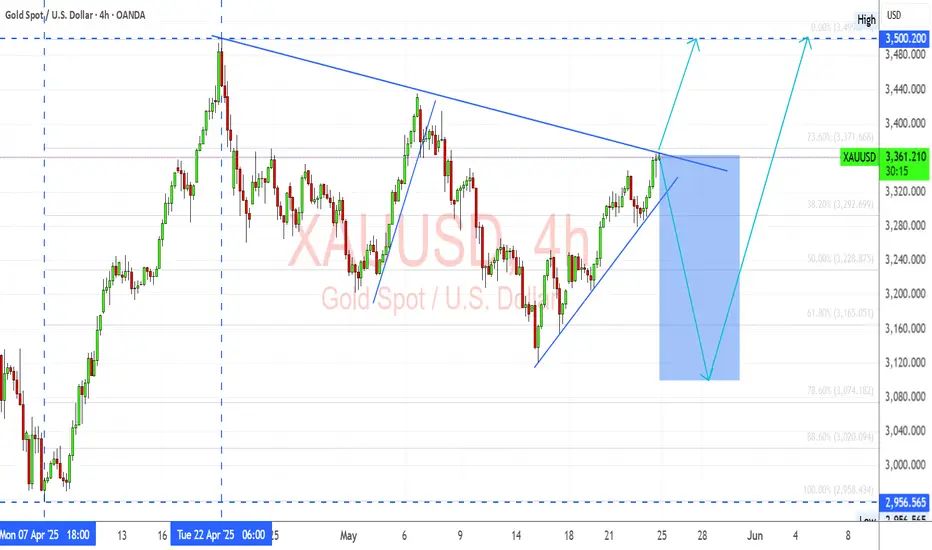
XAUUSD: Break or Bounce at ResistanceGold has reached a critical technical zone near a long-term descending trendline and horizontal resistance around $3360–3380. Price action suggests a make-or-break moment is unfolding.
Key Technical Structure:
Descending Trendline Resistance from the April high capped the rally.
Current move has formed a rising wedge — typically bearish if broken.
Price is testing resistance confluence — a rejection could send Gold lower.
Scenarios to Watch:
🔹 Bullish Breakout:
Clean breakout and close above $3380 confirms trendline invalidation.
Upside projection points to $3500 — previous high and psychological level.
🔹 Bearish Rejection:
Failure to break the trendline + wedge breakdown can drag price to:
$3280 (38.2% Fib)
$3160–3200 zone (61.8% Fib + demand area)
Macro Factors to Watch:
Tariff escalation between US–EU could trigger risk-off → bullish for Gold.
FOMC policy pause, weak job data, or inflation rebound also support upside.
Stronger USD or yield spike may trigger wedge breakdown → bearish.
Conclusion:
XAUUSD is at a key inflection point. Wait for confirmation: either a clean breakout or a clear reversal rejection. Trade the resolution, not the anticipation.
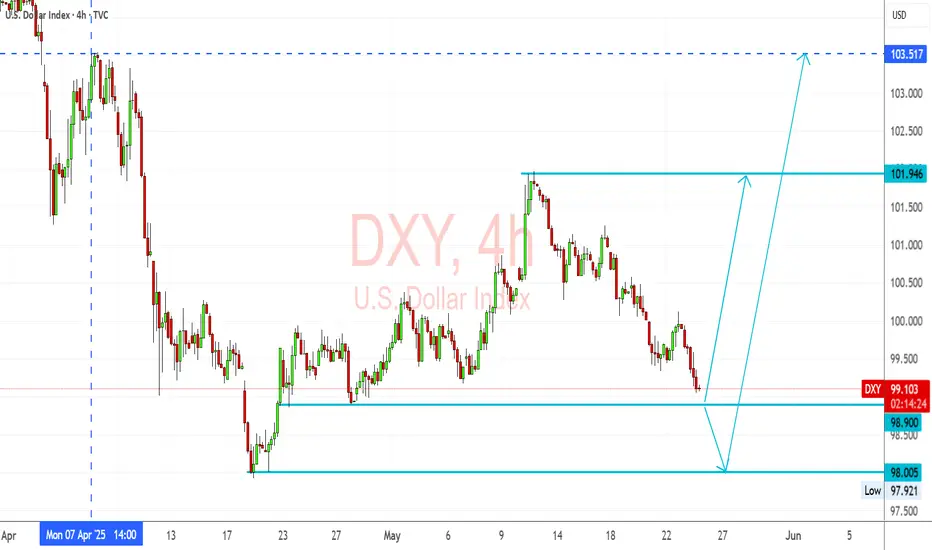
DXY Short-Term Reversal Zone in SightUS Dollar Index (DXY) is approaching a strong support zone at 98.90–98.00, which has historically acted as a base for bullish reversals. The price is now testing the lower bound of this zone after a steady downtrend from the 101.94 high.
Key Technical Structure:
Support Zone: 98.90–98.00 (tested 3+ times)
Double Bottom Potential forming if bulls hold the zone
Upside Targets:
101.94: Key horizontal resistance
103.50: Swing high from early April
Scenarios to Watch:
🔹 Bullish Rebound:
Price bounces off 98.90–98.00 support
Confirmation: Break and close above 100.50 near-term resistance
Could fuel move back to 101.94, possibly 103.50
🔹 Bearish Breakdown:
Daily close below 98.00 would invalidate bullish setup
Opens downside to 97.00 and even 95.50
Macro Drivers to Watch:
FOMC speakers and interest rate guidance
US jobless claims or inflation surprise
Risk-off sentiment (benefits USD) vs. continued global risk appetite
Conclusion:
DXY is trading at a make-or-break support zone. Watch for clear bullish reaction or bearish breakdown before committing. The setup favors a bounce unless 98.00 fails.
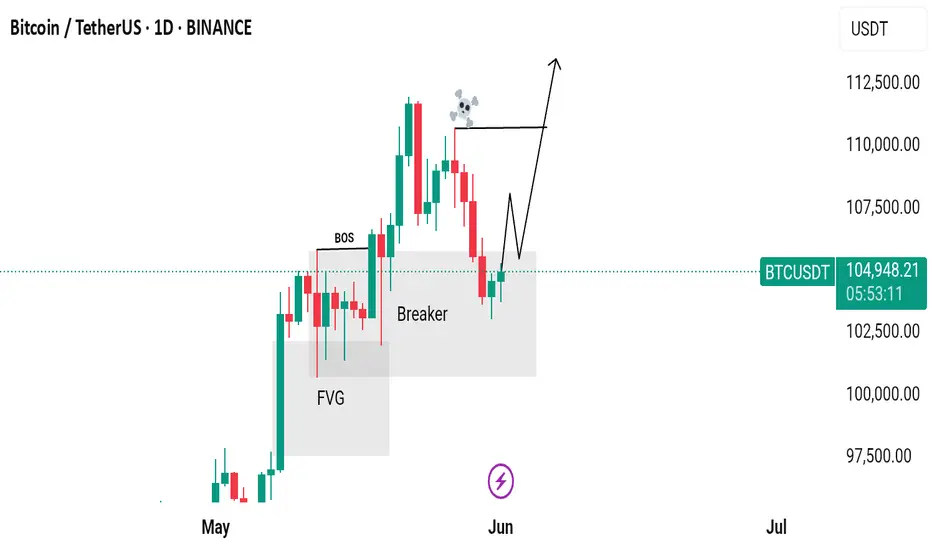
Can Potentially move upwards from here?Bitcoin just created an inducement and it has been hunted. Now the structure is also broken and the inducement is also taken out. The market is in a discount zone, and there's an overlap of a Breaker Block and FVG (Fair Value Gap), which indicates that the market can potentially move upwards from here.
Wait for bullish confirmations here, such as MSS (Market Structure Shift), CISD (Change in Character/Continuation of Internal Structure Dynamics), and failed selling PD Arrays!
Do Your Own Research (DYOR)! This is not financial advice.
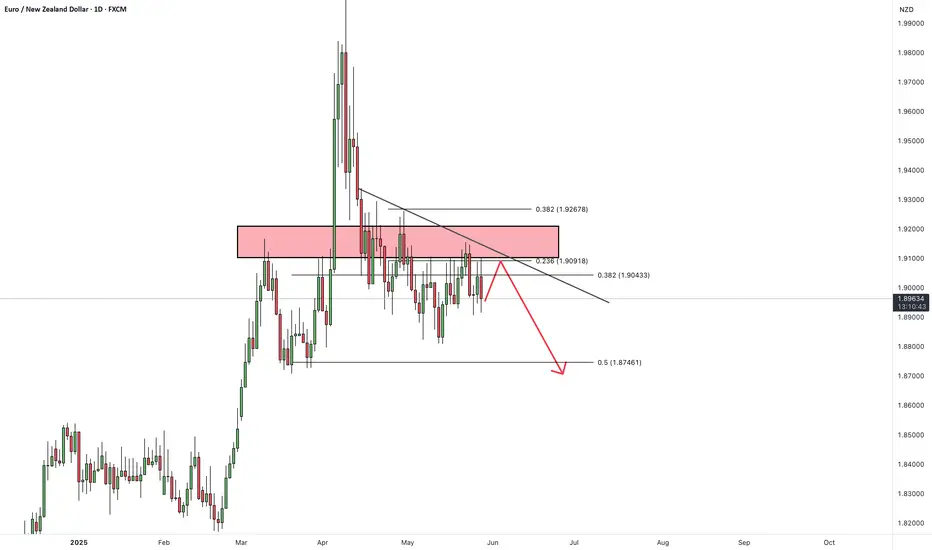
EURNZDHello Traders! 👋
What are your thoughts on EURNZD?
The EURNZD pair is currently trading below a key resistance zone, showing signs of hesitation near this level.
We expect the price to consolidate briefly within this area, and then decline toward the specified support level if the resistance holds.
As long as the pair remains below resistance, the bearish bias remains intact, and a move lower is likely.
Don’t forget to like and share your thoughts in the comments! ❤️
May 25 2025- BUY TRADE LIMIT order activated GBPUSDHi folks!
-Been busy lately so I dont consistently post. Attached here is the chart of GBPUSD, A classic re-accumulation in 1H timeframe. Before I got this trade It took me 1 week to monitor the schematics of this wyckoff re-accumulation. It came to fruition last Thursday so I monitor for buy Limit order entry within 1H to 15 min. charts. Validity here was the liquidity grab of re-accumulation ( check the image for clear caption).
TP: 8RR
Risk: 0.05% of Account
-Proprietary Trader
#wyckoff
#supplyanddemand
#refinement

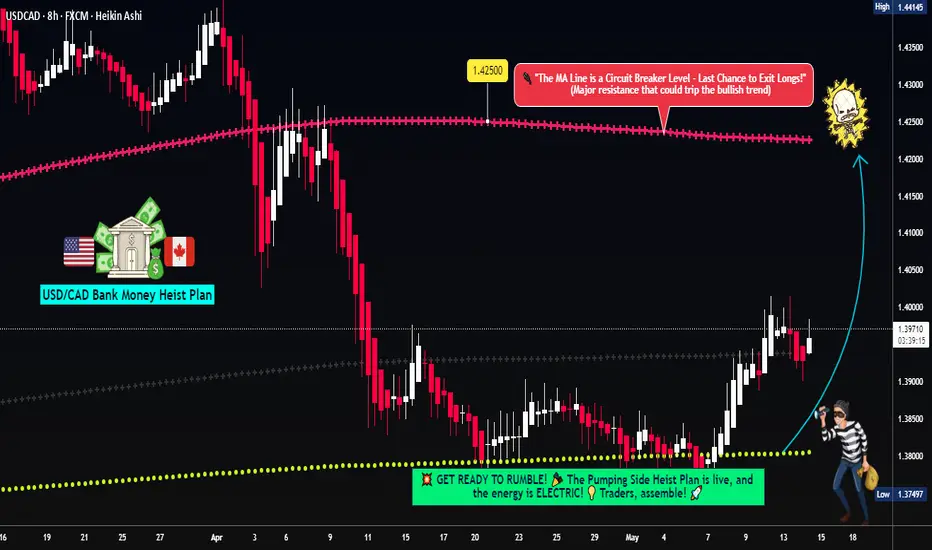
How to Rob the Bank (of Canada) – Legally! (USD/CAD Swing Trade)🌍 Hello Global Traders! 🌟
Money Makers, Risk Takers, and Market Shakers! 🤑💸✈️
Dive into our USD/CAD "The Loonie" Forex heist, crafted with the signature 🔥Thief Trading Style🔥, blending sharp technicals and deep fundamentals. Follow the strategy outlined in the TradingView chart, focusing on a long entry targeting the high-risk MA Zone. Expect a wild ride with overbought conditions, consolidation, and potential trend reversals where bearish players lurk. 🏆💰 Celebrate your wins, traders—you’ve earned it! 💪🎉
Entry 📈: The vault’s open! Grab bullish opportunities at any price, but for precision, set buy limit orders on a 15 or 30-minute timeframe near swing lows or highs for pullback entries.
Stop Loss 🛑:
📍 Place your Thief SL at the recent swing low on the 4H timeframe (1.38500) for scalping or day trades.
📍 Adjust SL based on your risk tolerance, lot size, and number of open orders.
Target 🎯: Aim for 1.42500
💵 USD/CAD "The Loonie" is riding a bullish wave, fueled by key market drivers. ☝
Unlock the full picture—dive into Fundamentals, Macro Insights, COT Reports, Quantitative Analysis, Sentiment Outlook, Intermarket Trends, and Future Targets. Check 👉🌎🔗.
⚠️ Trading Alert: News & Position Management 📰🚨
News can shake the market hard. Protect your trades by:
Avoiding new entries during news releases.
Using trailing stops to lock in profits and shield running positions.
📌 Markets move fast—stay sharp, keep learning, and adapt your strategy as conditions evolve.
💖 Power up our heist! 🚀 Tap the Boost Button to amplify our Thief Trading Style and make stealing profits a breeze. Join our crew, grow stronger, and conquer the markets daily with ease. 🏆🤝❤️
Catch you at the next heist, traders—stay ready! 🤑🐱👤🤩
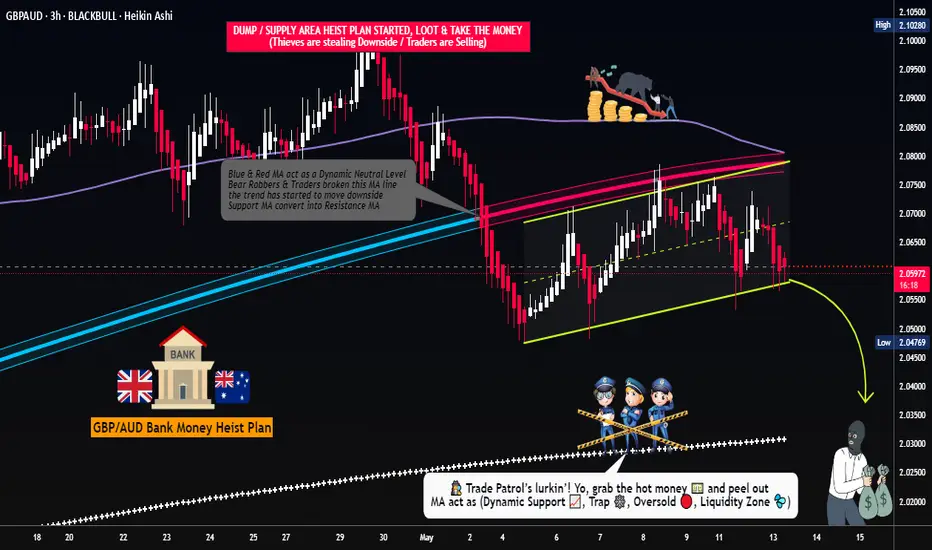
GBP/AUD Forex Heist - Bearish Breakout Blitz!🔥 Thief Trading Style: GBP/AUD Bearish Heist Plan 🔥
Hello, Profit Pirates & Market Marauders! 🤑
Get ready to raid the GBP/AUD (Pound vs. Aussie) forex market with a slick bearish strategy! 📊 Our Thief Trading Style fuses technical precision and fundamental insights to target a sharp downside move. Follow this charted plan to hit the high-risk Blue MA Zone and slip away with profits. Let’s make this heist count! 💪🎯
---
📊 Heist Blueprint: Trade Setup
- Market: GBP/AUD (Forex) 🌐
- Bias: Bearish Breakout 🌟
- Timeframe: 4H (Scalping/Day Trade) ⏰
Entry 📉:
- Breakout Move: Wait for a confirmed break below the Neutral Level at 2.05300. Place Sell Stop orders just below 2.05300 to ride the bearish wave. 🚀
- Pullback Play: For safer entries, set Sell Limit orders at the nearest 15M/30M swing high (e.g., 2.05600-2.05800) after a support break for pullback trades. 📍
- Trader Tip: Set a TradingView alert for the 2.05300 breakout to catch the action live! 🔔
Stop Loss 🛑:
- Breakout Traders: After the break confirms, place your Stop Loss above the recent 4H swing high at 2.08000 to shield against reversals. ⚠️
- Pullback Traders: Adjust Stop Loss based on your risk (e.g., 1-2% of account). Factor in lot size and multiple orders for precision. 📏
- Risk Alert: This is a high-octane heist! Keep position sizes tight to protect your capital. 🔥
Target 🎯:
- Aim for 2.03200, near the risky Blue MA Zone (an oversold area with potential consolidation or reversal). 🏴☠️
- Exit Strategy: Take profits early if bullish signals (e.g., pin bars, high volume) appear near 2.03200. 💸
Scalpers 👀:
- Focus on short-side scalps with tight trailing stops. Pair with day traders for the full heist or snag quick pips if your account supports it. 💰
---
📡 Why This Heist Could Pay Off
GBP/AUD is showing bearish momentum, fueled by:
- Technicals: A break below 2.05300, backed by lower highs on the 4H chart, signals strong downside potential. 📊
- Fundamentals: Weak UK economic data and Aussie strength (check COT reports) support a bearish outlook. 📰
- Seasonal Trends: GBP/AUD often softens in Q2 due to macroeconomic shifts. 📅
- Intermarket Factors: AUD’s correlation with commodity prices could pressure GBP lower. 🌎
---
⚠️ Risk Management: Guard Your Loot
- News Caution: Avoid new trades during high-impact events (e.g., UK CPI, RBA minutes) to sidestep volatility spikes. 🗞️
- Trailing Stops: Use trailing Stop Loss to secure profits as price approaches 2.03200. 🔒
- Position Sizing: Cap risk at 1-2% of your account per trade to stay in the game. 🚨
---
💥 Fuel the Heist! 💥
Join our Thief Trading Style crew by liking, commenting, and following for more electrifying trade plans! 🚀 Your support powers our market raids, helping us score profits with flair. Let’s dominate GBP/AUD together! 🤝🏆🎉
Hashtags: #GBPAUD #Forex #Bearish #DayTrading #Scalping #Breakout
Stay Alert: Another heist is brewing. Keep your charts primed, traders! 🐱👤😎