#XAUUSD 1DAYXAUUSD (1D Timeframe) Analysis
Market Structure:
The price is testing a trendline resistance, which has consistently acted as a strong barrier to upward movements. Additionally, a sell engulfing candlestick pattern has formed in this area, indicating increased selling pressure and a potential reversal to the downside.
Forecast:
A sell opportunity is expected as the confluence of trendline resistance and the sell engulfing pattern signals a bearish shift in market sentiment.
Key Levels to Watch:
- Entry Zone: Near the trendline resistance or after confirmation of sustained bearish momentum.
- Risk Management:
- Stop Loss: Placed above the trendline resistance or the high of the engulfing candlestick to manage risk.
- Take Profit: Target the next key support levels or significant price zones below for potential downside movement.
Market Sentiment:
The combination of the trendline resistance and the sell engulfing pattern reflects a bearish outlook, with sellers likely to dominate if the resistance holds. Confirmation of continued selling pressure is recommended before entering the trade.
Forexmarket

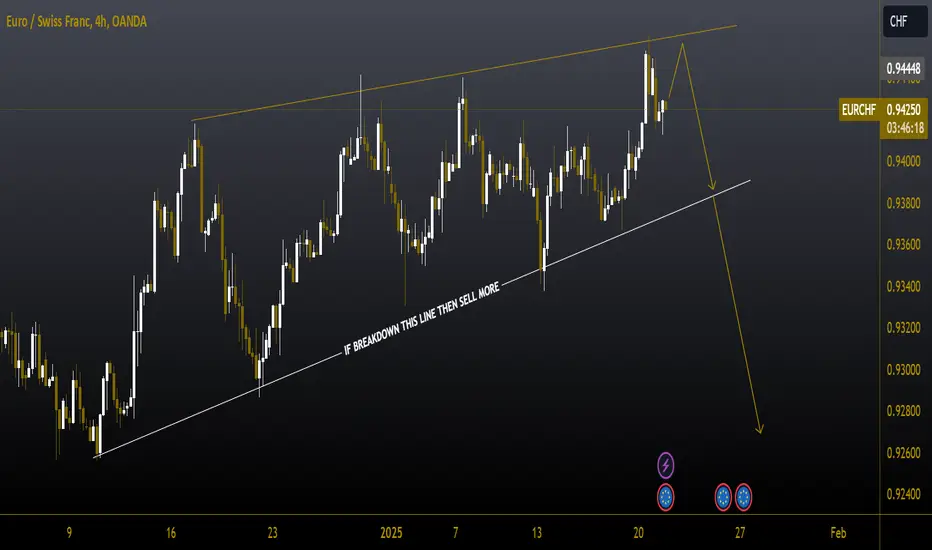
#EURCHF 4HEURCHF (4H Timeframe) Analysis
Market Structure:
The price is forming a rising wedge pattern, which is a bearish reversal setup. This pattern indicates weakening bullish momentum as the price narrows toward the upper boundary. A breakout below the wedge support suggests the potential for a bearish move.
Forecast:
A sell opportunity is anticipated if the price breaks below the rising wedge support, signaling the start of a downtrend.
Key Levels to Watch:
- Entry Zone: After the price breaks below the wedge support and confirms the breakout with a retest.
- Risk Management:
- Stop Loss: Placed above the recent swing high or the upper boundary of the wedge.
- Take Profit: Target key support levels below or Fibonacci retracement levels for potential downside movement.
Market Sentiment:
The rising wedge pattern suggests bearish sentiment as buying momentum weakens. Waiting for a confirmed breakout and retest ensures a more strategic entry aligned with market direction.
#XAUUSD 4HXAUUSD (4H Timeframe) Analysis
Market Structure:
The price has formed a sell engulfing candlestick pattern in a key resistance area, indicating a potential shift in market sentiment toward the downside. This bearish candlestick pattern reflects strong selling pressure overpowering buyers at this level.
Forecast:
A sell opportunity is anticipated as the sell engulfing pattern suggests further bearish momentum. The price may continue to move lower toward nearby support levels.
Key Levels to Watch:
- Entry Zone: Near the engulfing area after confirmation of sustained selling pressure.
- Risk Management:
- Stop Loss: Placed above the high of the engulfing candlestick to manage risk.
- Take Profit: Target the next support levels or significant price zones below for potential downside objectives.
Market Sentiment:
The sell engulfing pattern at a resistance level signals bearish sentiment, with sellers likely to maintain control in the short term. Proper confirmation is recommended before entering the trade to ensure alignment with market conditions.

#EURNZD 2HEURNZD (2H Timeframe) Analysis
Market Structure:
The price is currently testing the upper boundary of a channel, which acts as a key resistance level. This indicates a potential bearish scenario if the price fails to break above and instead respects the resistance.
Forecast:
A sell opportunity may arise if the price retests the channel resistance and confirms rejection, signaling the potential for a move toward the channel's lower boundary.
Key Levels to Watch:
- Entry Zone: After the price retests the channel resistance and shows signs of rejection.
- Risk Management:
- Stop Loss: Placed above the channel resistance or the recent swing high to minimize risk.
- Take Profit: Target the midline or the lower boundary of the channel for potential downside movement.
Market Sentiment:
The current price action at the channel resistance indicates a bearish bias, with sellers likely to dominate if the resistance holds. Waiting for confirmation of a retest ensures a strategic entry aligned with market momentum.

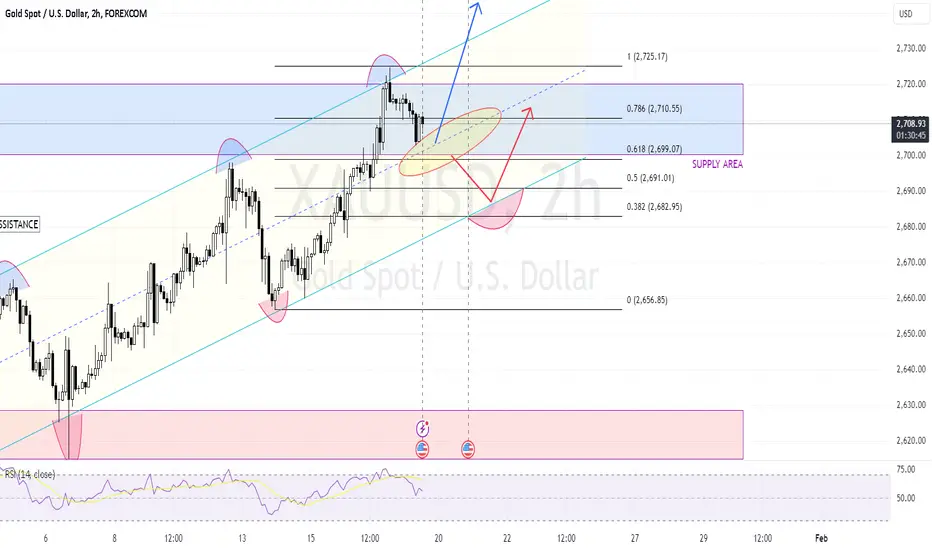
XAUUSD ON A BULLISH TREND PARALLELFX:XAUUSD Good Afternoon trader, my idea for DOGEUSDT. 2H on 17/01/2025.
I think this pair is strong bullish, but i have 2 opinion about this pair ;
1. XAUUSD will bounce up and break the parallel trend to chase the price at 2,743.75 and create support at the price of 2,702
2. XAUUSD will continue to fall after passing Fibonacci 0.618 at the price of 2,699.07 and looking for new support in the 2,691-2,699 price area before continuing the bullish trend.
Lets discuss about this, comment on below
#USDCHF WEEKLYUSDCHF (Weekly Timeframe) Analysis
Market Structure:
The price is currently testing two significant resistance levels: the first being the upper boundary of a channel, and the second a key horizontal resistance zone. Additionally, the formation of a sell engulfing candlestick pattern suggests increased selling pressure at these levels.
Forecast:
A sell opportunity is expected as the price reacts to the dual resistance zones, with bearish momentum likely to push the price lower.
Key Levels to Watch:
- Entry Zone: Near the resistance levels or after confirmation of bearish rejection.
- Risk Management:
- Stop Loss: Placed above the second resistance level or the recent swing high to manage risk.
- Take Profit: Target the midline or lower boundary of the channel for potential downside movement.
Market Sentiment:
The confluence of the channel resistance, horizontal resistance, and the sell engulfing pattern reflects a bearish sentiment, with sellers likely to dominate the market in the short term. Proper confirmation is recommended before entering the trade to ensure alignment with market momentum.

#AUDUSD WEEKLYAUDUSD (Weekly Timeframe) Analysis
Market Structure:
The price is currently testing a channel support level that has consistently acted as a strong base for upward movements in the past. This indicates a potential area for bullish momentum to emerge if the support holds.
Forecast:
A buy opportunity is anticipated if the price confirms a bounce from the channel support, signaling a potential move toward the upper boundary of the channel.
Key Levels to Watch:
- Entry Zone: Near the channel support level after confirmation of a bounce.
- Risk Management:
- Stop Loss: Placed below the channel support to limit downside risk in case the pattern fails.
- Take Profit: Target the midline or the upper boundary of the channel for potential upside gains.
Market Sentiment:
The price action at the channel support reflects a possible bullish sentiment, with buyers likely to regain control if the support remains intact. Waiting for confirmation of a bounce is recommended before entering the trade to ensure alignment with market direction.

#AUDUSD 1HAUDUSD (1H Timeframe) Analysis
Market Structure:
The price has broken below a key trendline support, indicating a potential shift in market momentum toward the downside. The breakdown suggests that buyers could not maintain control, and selling pressure has begun to dominate.
Forecast:
A sell opportunity may arise if the price retests the broken trendline as resistance and confirms rejection, signaling further bearish movement.
Key Levels to Watch:
- Entry Zone: After the price retests the broken trendline and shows signs of rejection.
- Risk Management:
- Stop Loss: Placed above the retest level or the recent swing high to manage risk.
- Take Profit: Target the next support levels or significant price zones below for potential downside objectives.
Market Sentiment:
The breakdown of the trendline support highlights a bearish sentiment in the short term. Waiting for a retest provides a more strategic entry point, minimizing risk and aligning with market confirmation. Proper risk management is essential.

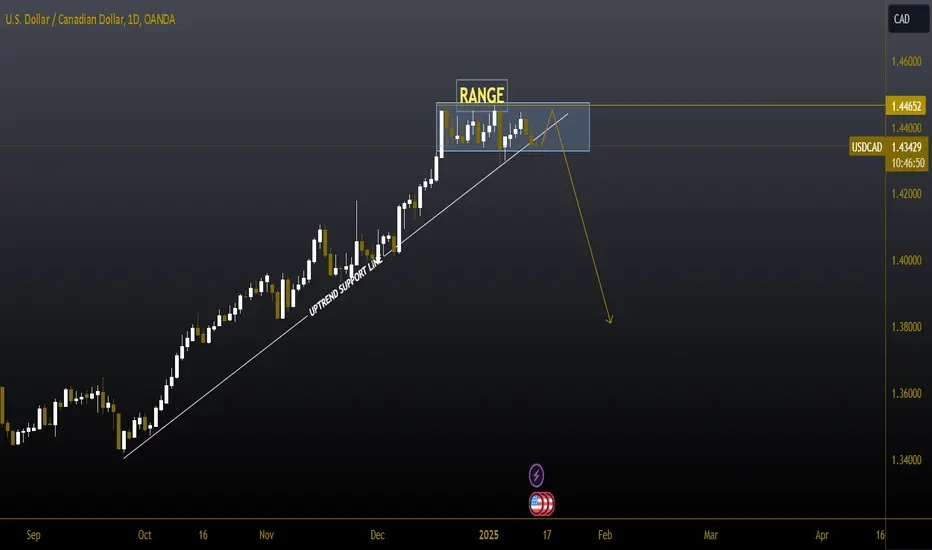
#USDCAD 1DAYUSDCAD (1D Timeframe) Analysis
Market Structure:
The price was supported by a trendline, but after forming a consolidation range near this Resistance, it has broken down, indicating potential bearish momentum. The breakdown suggests that the buyers were unable to hold the trendline, and selling pressure has increased.
Forecast:
A sell opportunity is anticipated as the breakdown below the trendline and range indicates a shift in market sentiment toward the downside.
Key Levels to Watch:
- Entry Zone: Consider entering a sell position after a retest of the broken trendline or consolidation range as resistance.
- Risk Management:
- Stop Loss: Placed above the retest level or recent swing high to manage risk.
- Take Profit: Target the next support levels or Fibonacci retracement areas for potential downside targets.
Market Sentiment:
The breakdown of the trendline support signals bearish sentiment, with further downside likely if the price remains below the retest level. Proper confirmation is recommended before entering the trade.
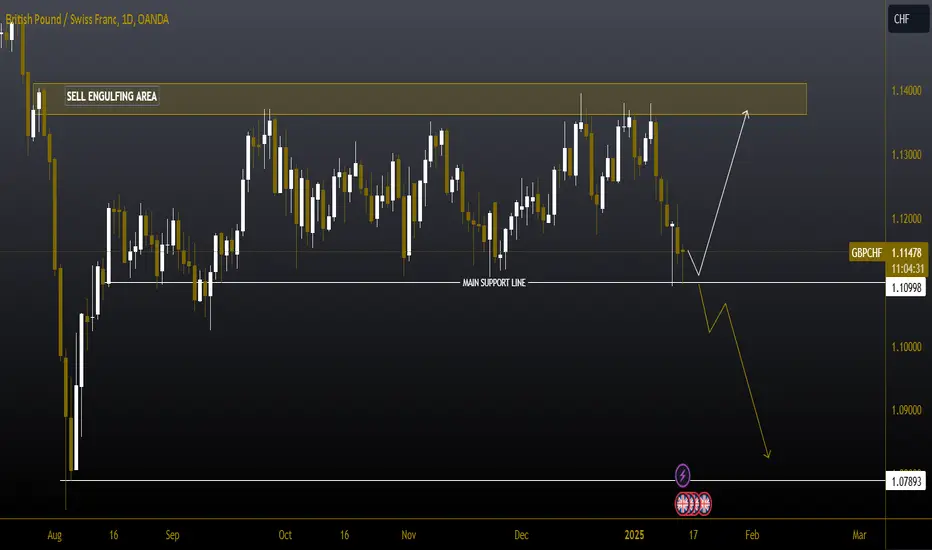
#GBPCHF 1DAYGBPCHF (1D Timeframe) Analysis
Market Structure:
The price is currently consolidating within a rectangle pattern, with the support level acting as a key area of interest. This zone represents a potential turning point for either a bounce or a breakdown, depending on price action.
Forecast:
- Buy Scenario: If the price bounces back from the rectangle support, it signals a continuation of the range, offering a potential buying opportunity.
- Sell Scenario: If the price breaks below the support line and retests it as resistance, it signals bearish momentum, creating a potential selling opportunity.
Key Levels to Watch:
- Entry Zone for Buying: Near the support level after confirmation of a bounce.
- Entry Zone for Selling: After a breakdown and successful retest of the support line as resistance.
Risk Management:
- Stop Loss for Buying: Placed below the support level to limit downside risk.
- Stop Loss for Selling: Placed above the retested support level.
- Take Profit:
- For Buy: Target the upper boundary of the rectangle or nearby resistance.
- For Sell: Target lower support levels or Fibonacci extension zones.
Market Sentiment:
The rectangle pattern reflects a neutral sentiment, with opportunities for both buying and selling depending on how the price reacts to the support zone. Proper confirmation is essential before executing any trades.
#XAUUSD 1DAYXAUUSD (1D Timeframe) Analysis
Market Structure:
The price is currently approaching a descending trendline resistance, which has consistently limited upward movement in the past. This suggests that the trendline may act as a barrier again, potentially leading to a reversal.
Forecast:
A sell opportunity is expected if the price respects the trendline resistance and shows signs of rejection, signaling a possible move to the downside.
Key Levels to Watch:
Entry Zone: Near the trendline resistance after confirmation of rejection.
Risk Management:
Stop Loss: Placed above the trendline resistance or the recent swing high to manage risk.
Take Profit: Target the next support levels or Fibonacci retracement areas for potential downside objectives.
Market Sentiment:
Bearish sentiment is likely to dominate as long as the price remains below the trendline resistance, maintaining a downward bias in the short term. Proper confirmation is recommended before entering the trade.

#AUDCHF 1DAYAUDCHF (1D Timeframe) Analysis
Market Structure:
The price is currently testing a descending trendline resistance, which has consistently acted as a barrier to upward movement. This suggests the potential for selling pressure to emerge at this level.
Forecast:
A sell opportunity may arise if the price fails to break above the trendline and shows signs of rejection, indicating a likely move to the downside.
Key Levels to Watch:
Entry Zone: Near the trendline resistance after confirmation of rejection.
Risk Management:
Stop Loss: Placed above the trendline resistance or recent swing high to minimize risk.
Take Profit: Target the next support levels or Fibonacci retracement zones for potential downside movement.
Market Sentiment:
The price action at the trendline indicates bearish sentiment, with sellers likely to dominate if the resistance holds firm.

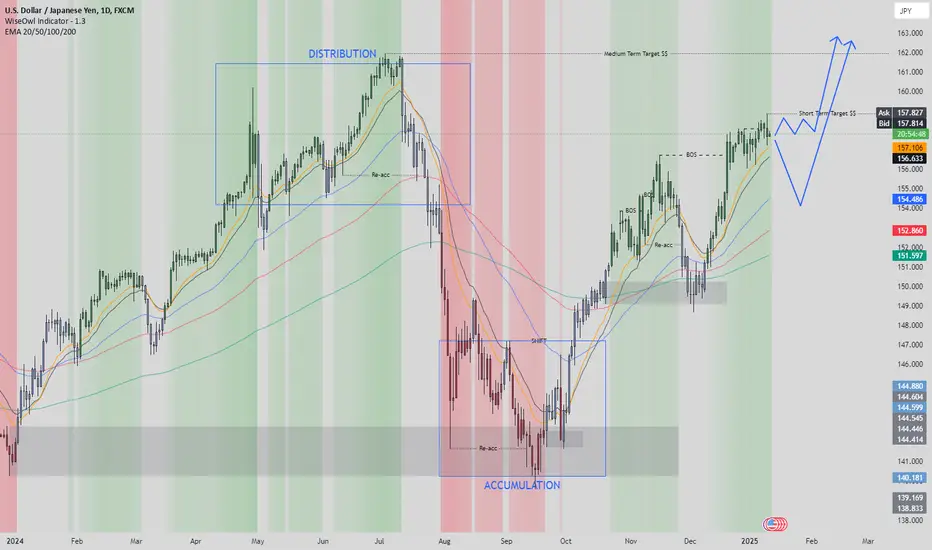
USD/JPY (UJ) Analysis (Daily Timeframe)The USD/JPY pair has been following a clear market cycle, transitioning from distribution to markdown , followed by accumulation , and now entering a bullish markup phase , showcasing strong bullish momentum.
Key Observations:
Market Phases:
Distribution Phase: The bullish move ended near the 162 level , where sellers gained control, initiating a markdown.
Accumulation Phase: After a significant markdown, UJ found a base around the 140 level, forming an accumulation phase with demand coming back into the market.
Current Phase: The pair has now broken out of accumulation and is in a bullish move, with a well-defined structure of higher highs and higher lows.
EMA Surfing and Momentum:
The price is currently surfing upward along the EMAs , showing strong trend-following behavior with EMAs acting as dynamic support.
The tightening of the EMAs during the accumulation phase has now expanded , supporting the continuation of the bullish move.
Scenarios to Watch:
Continuation to Targets:
USD/JPY could continue its bullish momentum toward the short-term target near 159 and potentially the medium-term target around 162. This aligns with the ongoing strength in the USD and the current bullish structure .
Pullback for Reaccumulation:
A potential retracement could act as a reaccumulation phase, gathering liquidity before resuming the uptrend.
eurjpy buy signal. Don't forget about stop-loss.
Write in the comments all your questions and instruments analysis of which you want to see.
Friends, push the like button, write a comment, and share with your mates - that would be the best THANK YOU.
P.S. I personally will open entry if the price will show it according to my strategy.
Always make your analysis before a trade

USDZAR BUYOANDA:USDZAR BUY
CONCULUSION. WEAKLY UPTRENT
DAILY UPTRENT
4HR golden zone rejection but not close
early entry or candle close entry
USDZAR BUYOANDA:USDZAR BUY
CONCULUSION. WEAKLY UPTRENT
DAILY UPTRENT
4HR golden zone rejection but not close
early entry or candle close entry

NZD/USD Poised for a Breakout ?The NZD/USD pair shows signs of potential bullish momentum following a bounce from a key support level near 0.55900. Price is currently challenging the 0.56028 resistance, with further upside likely if this level is broken and sustained. The downward sloping moving average indicates a prevailing bearish trend, so this move could be a short-term retracement or a possible trend reversal depending on market strength.
Key Insights
Entry Area: Around 0.55940 – 0.56028
Stop-Loss: 0.55103 to manage downside risk
First Target: 0.56156
Second Target: 0.56370
Final Target: 0.56781
Watch for a confirmed breakout above 0.56028 for a continuation toward higher levels. A failure to hold above 0.55900 could trigger further downside movement. Market volatility and U.S. dollar news should be closely monitored for momentum shifts. This setup offers a solid risk-to-reward ratio, balancing caution and opportunity in the current market structure.

#AUDNZD 1DAYAUDNZD (1D Timeframe) Analysis
Market Structure:
A bearish engulfing candlestick pattern has formed, indicating strong selling pressure at the current price level. This pattern suggests that the bulls have lost control, and the bears are likely to dominate in the near term.
Forecast:
A sell opportunity is expected as the price shows signs of reversal following the bearish engulfing pattern, signaling potential downside movement.
Key Levels to Watch:
Entry Zone: After confirmation of the bearish engulfing pattern.
Risk Management:
Stop Loss: Placed above the high of the engulfing candle to limit risk.
Take Profit: Target the next support levels for potential downside targets.
Market Sentiment:
The bearish engulfing pattern signals a shift in market sentiment, with selling pressure expected to continue as long as the price stays below the recent high.

#USDJPY 2HUSDJPY (2H Timeframe) Analysis
Market Structure:
The price is currently testing a key resistance level, which has previously acted as a barrier to upward movement. Signs of rejection at this level indicate potential selling pressure.
Forecast:
A sell opportunity is anticipated if the price continues to face rejection from the resistance zone, signaling a possible move downward.
Key Levels to Watch:
Entry Zone: Near the resistance level after confirmation of rejection.
Risk Management:
Stop Loss: Placed above the resistance zone or recent swing high to minimize risk.
Take Profit: Target the nearest support levels for potential downside movement.
Market Sentiment:
Selling pressure is expected to dominate as long as the price remains below the resistance level, maintaining a bearish outlook.

#XAGUSD 2HXAGUSD (2H Timeframe) Analysis
Market Structure:
The price has broken above a key resistance level, which is now acting as support. This change in role indicates potential bullish momentum, with buyers likely to dominate if the level holds.
Forecast:
A buy opportunity is expected as the price respects the new support level, confirming the breakout and signaling further upward movement.
Key Levels to Watch:
Entry Zone: Near the support level after confirmation that the price is holding above it.
Risk Management:
Stop Loss: Placed below the support level to limit downside risk.
Take Profit: Target the next resistance levels or Fibonacci extensions for potential upside movement.
Market Sentiment:
The transition of resistance into support reflects strengthening buying interest, favoring upward continuation as long as the support holds.

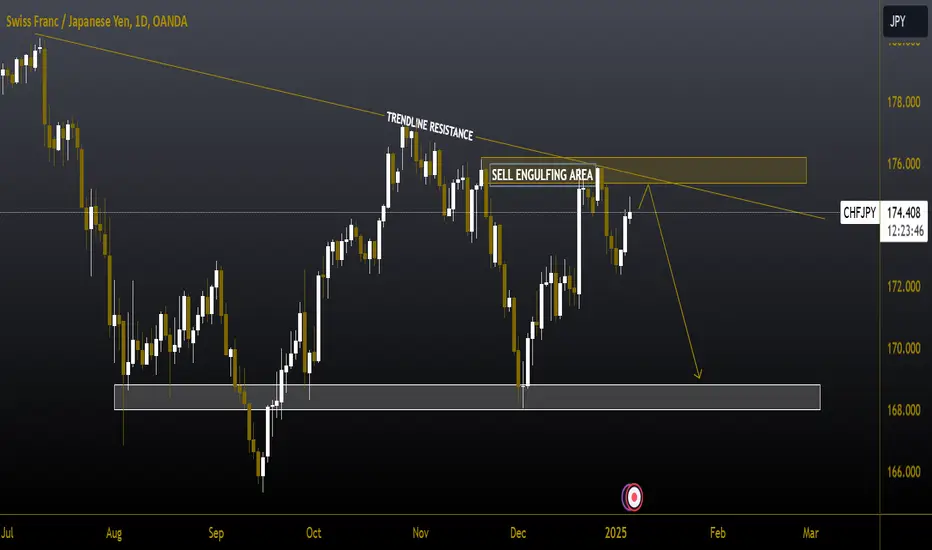
#CHFJPY 1DAYCHFJPY (1D Timeframe) Analysis
Market Structure:
The price is testing a trendline resistance, which has previously acted as a barrier to upward movement. A bearish engulfing candlestick pattern has also formed near this resistance zone, indicating potential selling pressure.
Forecast:
A sell opportunity is anticipated as the price faces rejection from the trendline resistance, supported by the bearish engulfing pattern signaling downside potential.
Key Levels to Watch:
Entry Zone: Near the trendline resistance after confirmation of rejection.
Risk Management:
Stop Loss: Placed above the trendline resistance or the high of the bearish engulfing candle.
Take Profit: Target the next support levels or Fibonacci retracement zones for potential downside targets.
Market Sentiment:
Bearish signals suggest sellers may take control if the price remains below the trendline resistance, maintaining downward momentum.
#GBPCHF 1DAYGBPCHF (1D Timeframe) Analysis
Market Structure:
The price is trading within a descending channel, respecting both resistance and support levels. It is currently near the upper boundary of the channel, suggesting potential selling pressure.
Forecast:
A sell opportunity may develop if the price respects the channel resistance and shows signs of rejection, indicating a possible move toward the lower boundary of the channel.
Key Levels to Watch:
Entry Zone: Near the channel resistance after confirmation of rejection.
Risk Management:
Stop Loss: Placed above the channel resistance or recent swing high to minimize risk.
Take Profit: Target the midline or lower boundary of the channel for potential downside movement.
Market Sentiment:
The price structure within the channel indicates a bearish outlook, with selling pressure likely to continue as long as the price remains below the resistance level.

#USDJPY 2HUSDJPY (2H Timeframe) Analysis
Market Structure:
The price is trading within a channel pattern, respecting both support and resistance levels. Currently, it is near the upper boundary of the channel, indicating possible resistance.
Forecast:
Wait for a retest of the channel resistance before considering a sell position, as confirmation is required to validate a potential move downward.
Key Levels to Watch:
Entry Zone: After a retest and rejection from the upper boundary of the channel.
Risk Management:
Stop Loss: Placed above the channel resistance or recent swing high.
Take Profit: Target the midline or lower boundary of the channel for potential downside movement.
Market Sentiment:
The setup suggests a cautious bearish bias, but confirmation signals are needed before executing a trade.
