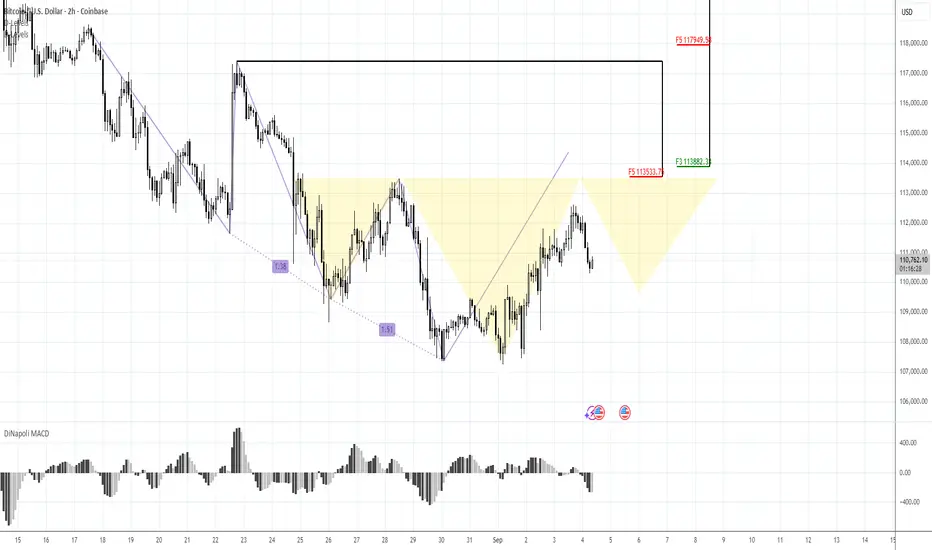
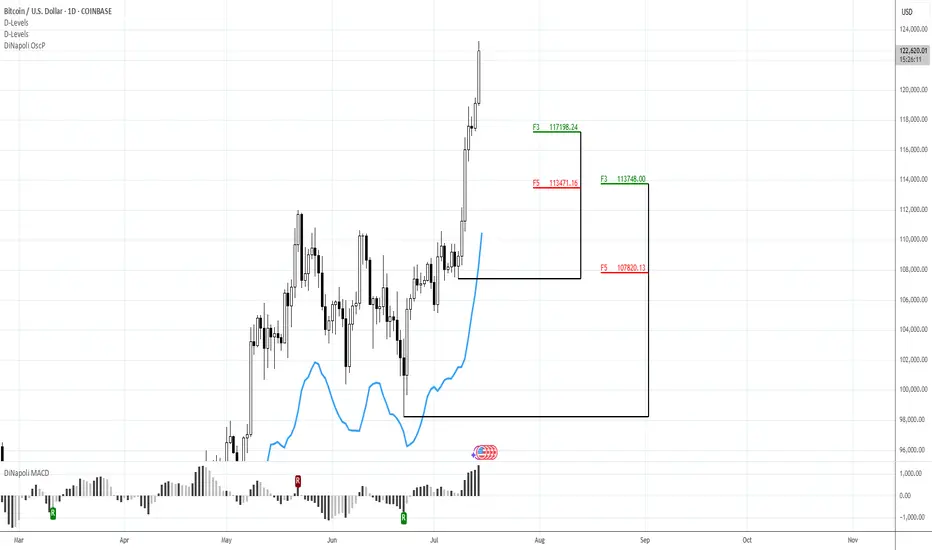
Counter-Pattern BTC Idea. Sell @ 113.5KMorning folks,
So, our plan stands in progress, everything is fine, while market is moving with 3-Drive pattern to the upside. It's time to decide what to do next.
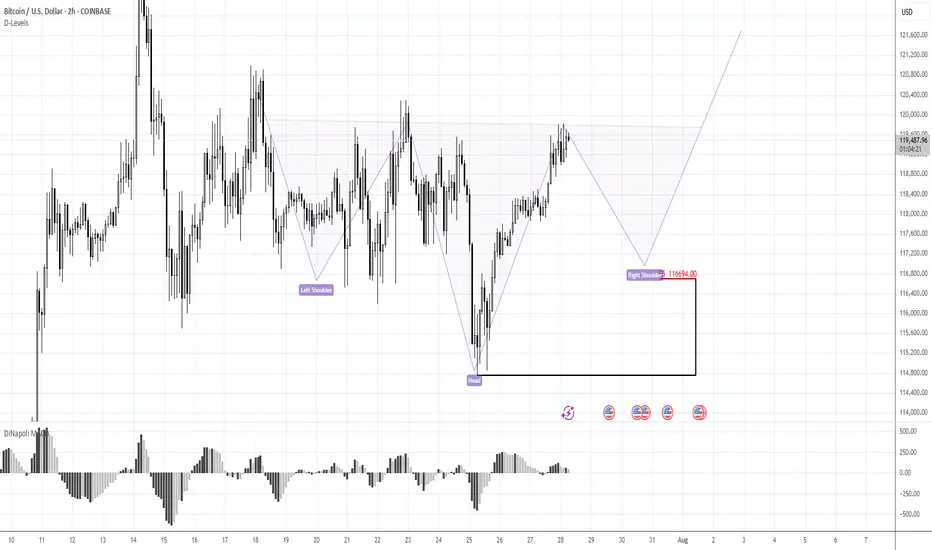
BTC will remain under pressure until the mid September, due to big Treasury borrowings. At the same time we see that it is forming reverse H&S pattern, which is potentially bullish. Our idea is to go against it with the most safe way and Sell at the neckline and K-resistance area of 113.5K level.
Because we think that this H&S has more chances to fail rather than to work properly. But, anyway, if even it will work as it should, the right arm deep should let us to move stops to breakeven. So, we think that this trade scenario cares not much risk
Forexpeacearmy
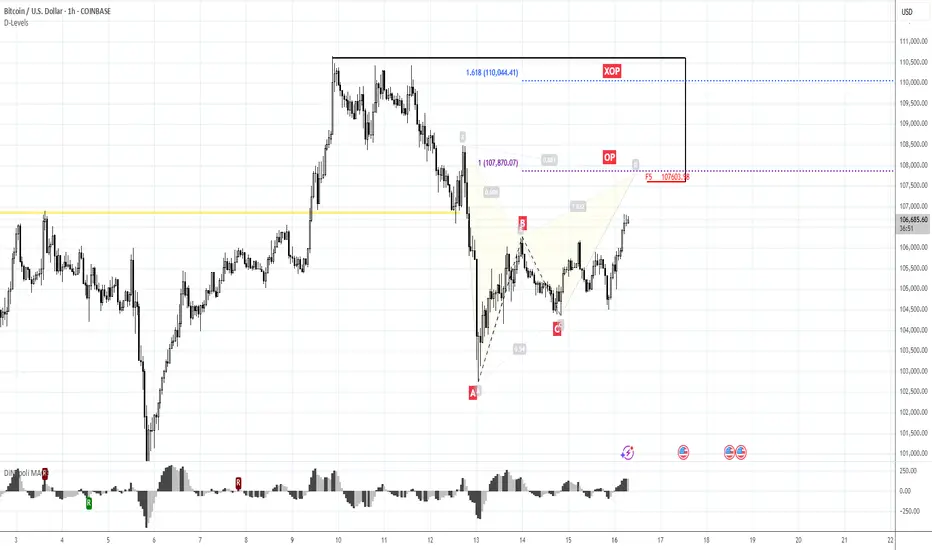
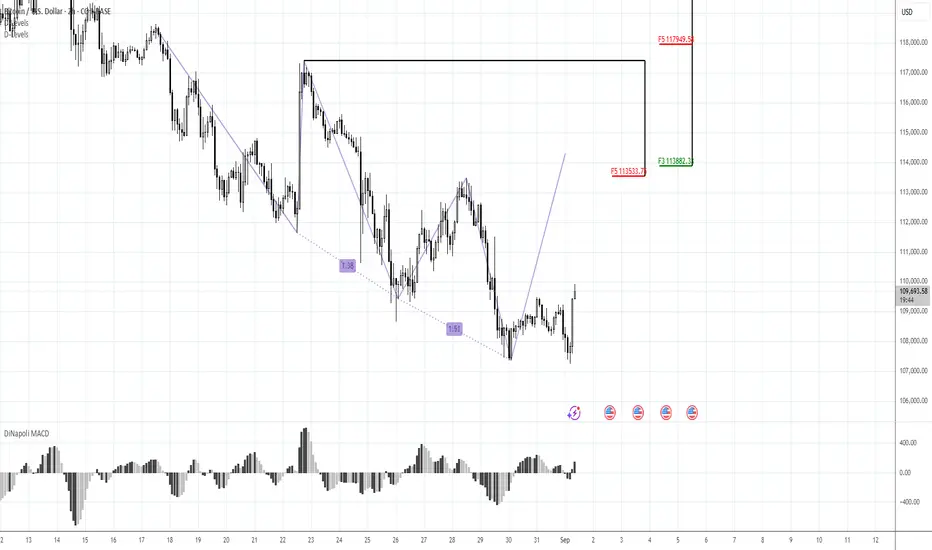
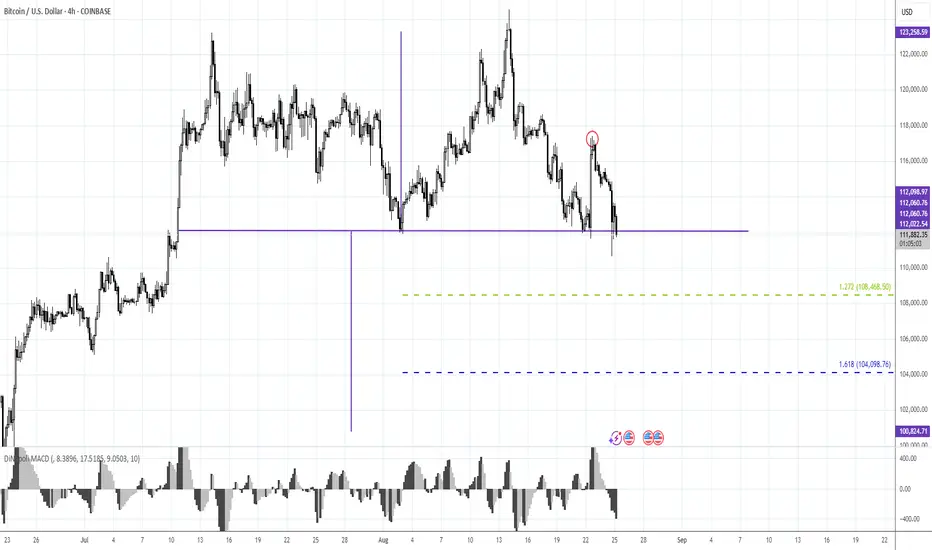
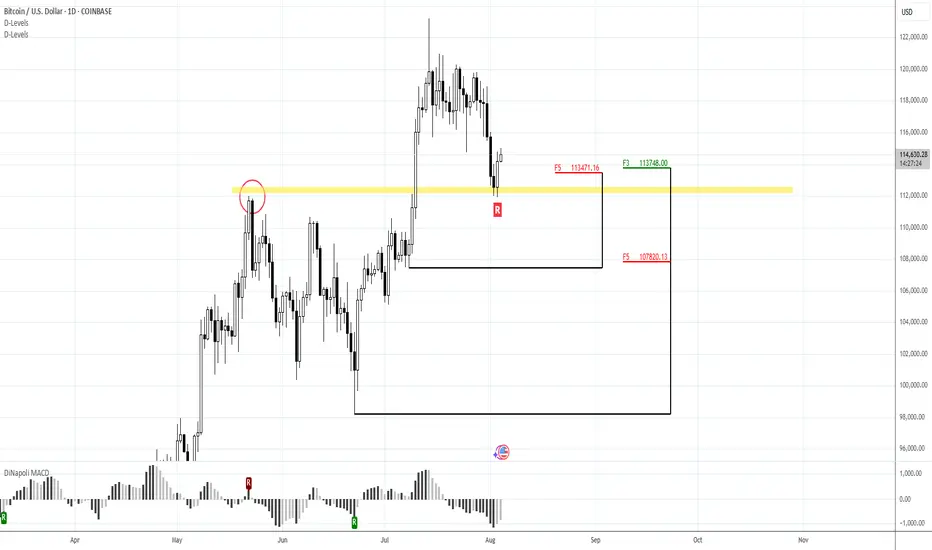
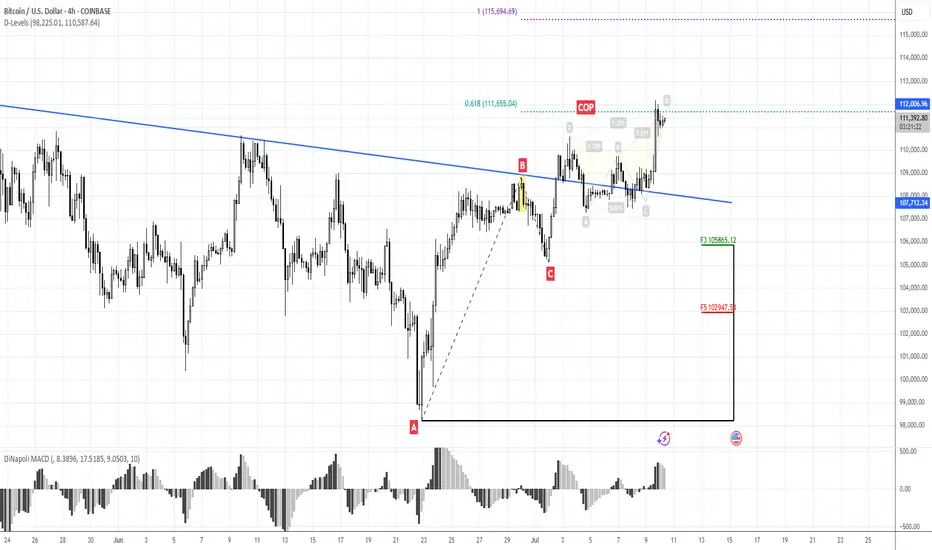
BTC 3-Drive Pullback. 113.5KMorning folks,
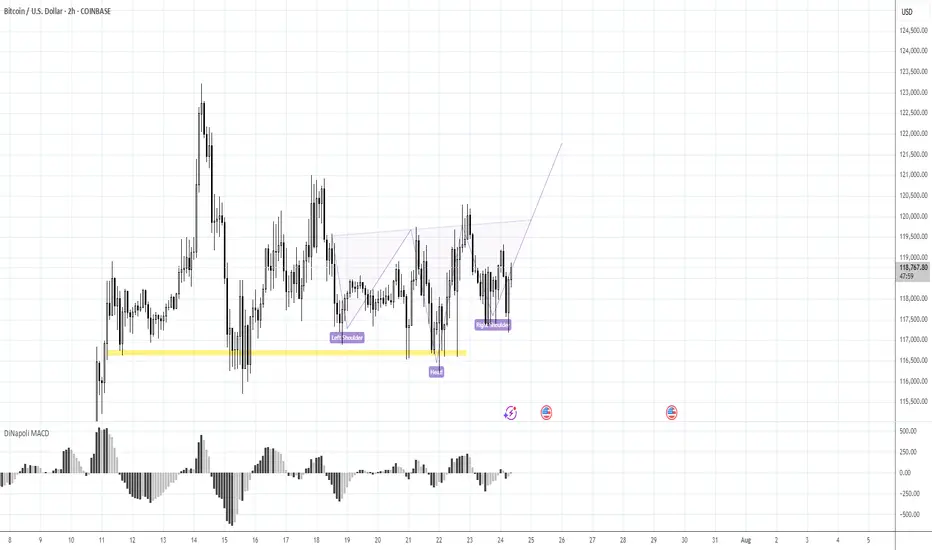
BTC for now is moving accurately from one our target to another. First it was 108.4K, now it is 108K. Next should be 104-105K...
Still, price stands at strong support area and is forming bullish reversal session on daily chart. On 1H chart we have clear 3-Drive Buy pattern. So, chances are above zero that before it keep going down, the pullback happens...
That's why if you want to go short we call you to wait for the bounce and try to sell the rally instead. The minimum 3-Drive target is above 113K top, where we have also K-resistance area. So, just watch for it, if you want to sell.
Also we have no objections against long entry with 3-Drive. Although it doesn't correspond to overall context and we do not include this trade in our plan. But, now this trade has a small risk and could be considered, if you want.
I sign this update with "Long" idea, but only for pullback. Context remains bearish.
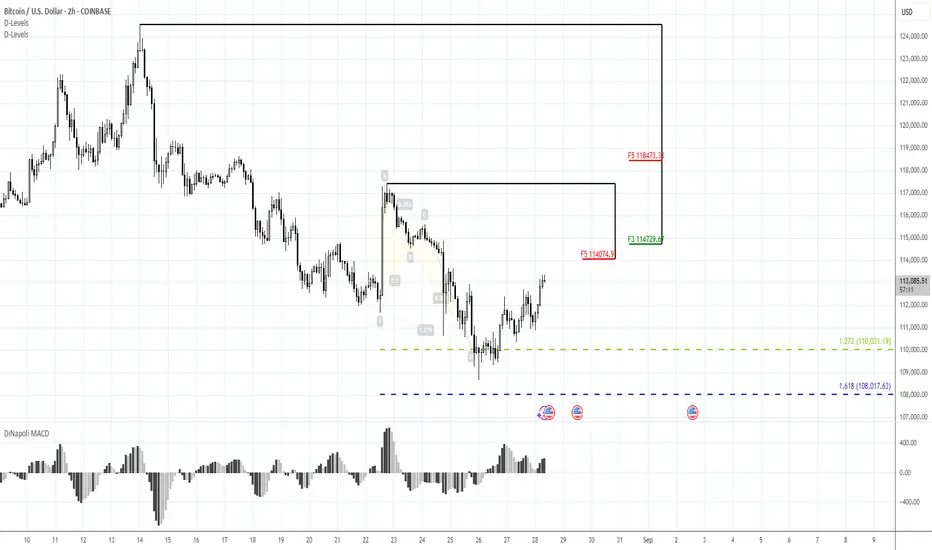
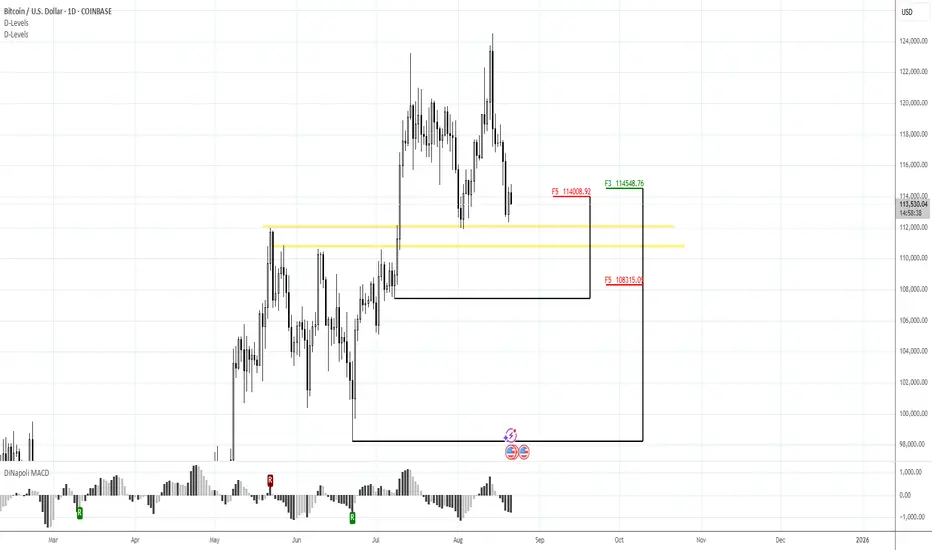
BTC 114-114.70K Resistsance to WatchMorning Folks,
Our recent plan worked nice - 108.40$ target is done. Not occasionally we called to not set too deep targets because of strong 105-108K support area. Which, honestly speaking has decisive meaning for BTC.
Now we keep an eye on 114-114.7K resistance area. Potentially it might be interesting for bearish position taking. Although more precisely we could say if market will get there.
Bullish ideas might interesting only if BTC returns to ~118K top. In this case reverse H&S pattern might start forming. But, since liquidity pressure in the US continues we do not count on this scenario right now. More probable that in nearest 1-2 weeks BTC spends in sideways action.
105-108K is a Vital BTC areaMorning folks,
It seems that everything goes as we suggested. S. Bessent grabs all available liquidity out of the market. RRP is done already, next is a banking reserves. They still need around $500 Bln. This explains, why other markets show reasonable action while BTC totally erased Powell speech effect.
BTC now stands at vital area. Downside breakout of 105-108K support will lead probably to appearing of big daily H&S pattern and following drop under 80K area...
For now we do not consider any long positions. To take the short one, you anyway will have to do it against the Friday's top of 117K, which seems a bit too far for daily/intraday trading. So, you have to find either closer area for stop placement or wait for some upside bounce.
Although it is a temptation to treat daily shape as Double Top, I wouldn't aimed right now on its 101K target. Better to consider closer standing ones around 108K first.
BTC 108-110K Vital area is TestingMorning folks,
Not many things to say for now, as major problem stands in fundamental area - US liquidity drought. S. Bessent grabs everything that he could and even more. He already finished RRP source totally and now US Treasury intends to put his hands in Banking Reserves. They still need ~ 350 Bln for their TGA Fed account and another 250Bln of net debt borrowing.
The major question whether BTC will able to hold this? So we do not want to take part in this adventure, especially with Jackson Hole meeting right around the corner.
We suggest to watch for market reaction on this support area and rely on clear patterns. If somehow this area will be broken, BTC could return back into 80-100K trading range. Many things will depend on close price of this week.
So, stay aside for now.
114-114.50K is Vital in short-termMorning folks,
So, potential patterns that we discussed last time even had no chances to be formed, market just collapsed. It is not a surprising moment. In our weekly reports we paid a lot of attention to the US liquidity as a main fundamental driving factor. The maths here is very simple 1+Trln borrowing in 2 months. It is yet to borrow net ~250-300 Bln, while RRP liquidity source is exhausted already. Additionally US Treasury need to accumulate 300 Bln more on its TGA account. All this liquidity will be drained from the market. BTC will be under direct impact of this stuff.
Now 114 K support area seems vital in short term. We intend to watch for patterns around it and week close price. If BTC drops lower, next area to watch is 110-111K support. I do not want to speak what will happen if it will be broken, but don't exclude retracement back to 70-80K area in this case.
To remind you we still have all-time 127K target. At least following normal technical behavior, I hope that BTC will try to reach it first, before collapse will happen. This is the reason of our special attention to 114K support.
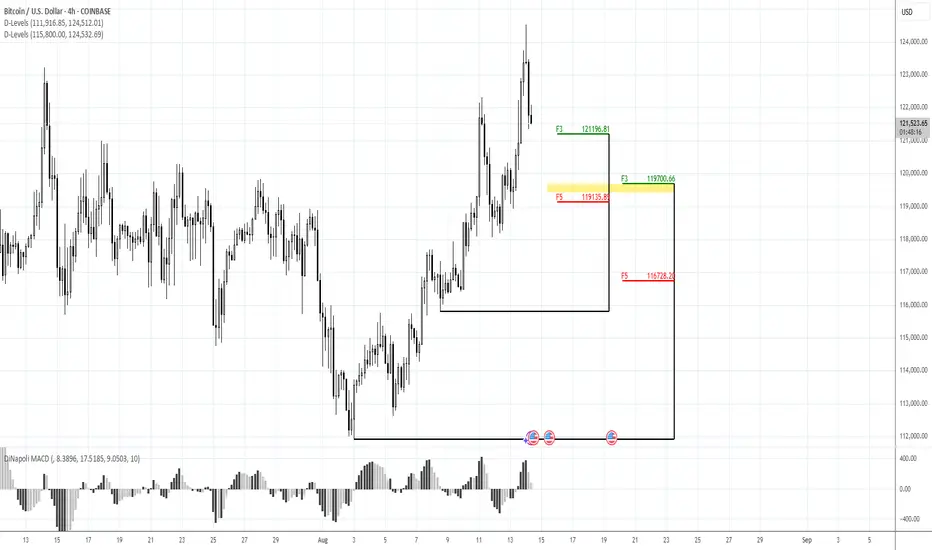
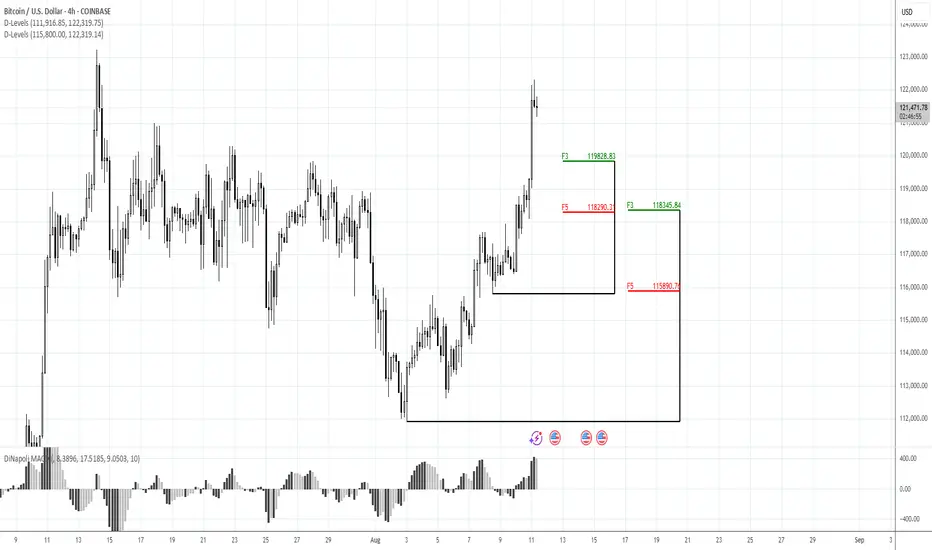
119.15-119.70K to watch for Long tradeMorning folks,
So, Thu setup is done perfect. Jump precisely from K-support area of 118.30 that we discussed. But, BTC has reached just minor 1H target and now is moving down. Since overall upside impulse is not bad, we consider ~119.5K support area for bullish momentum trade for now...
118.5K and 120K For Long EntryMorning folks,
Not too much to say now. Most important thing - BTC was able to stay above vital 110-112K support. So the upside reversal that we traded last two weeks with minimal target around 116K was correct. Now BTC stands much higher, but in a moment when we started the trade - it was impossible to say.
Now we're watching two support areas of 120K and 118.5K for potential long entry. Nearest upside target is 127K
Take care.
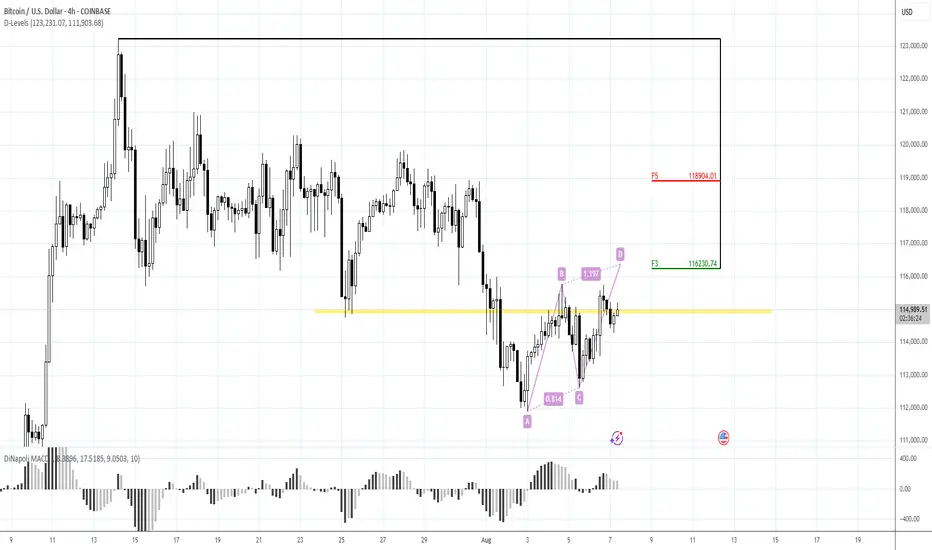
BTC cares US liquidity risks in AugustMorning folks,
So, in general as you can see our upside AB=CD that we discussed last time is working. But...
as you know BTC is strongly related to liquidity dynamic on US domestic system. This month Mr. Bessent wants to re-finance 1Trln in debt, with net borrowing around 250 Bln. Hardly BTC will get a small chunk of this funds.
it means that the volatility could rise significantly in nearest 1-2 weeks with downside price gravitating. Overall action looks rather heavy. Maybe BTC somehow will complete AB=CD target around 116.20-116.25K, but now this action looks like retracement - no thrust, slow action a lot of overlapping candles. So lows might be re-tested or even broken.
In current situation we think it would be better to not take any new longs and watch for clarity. If you have position already - move stops to breakeven.
Watching for intraday BTC bounce firstMorning folks,
So, neither NFP data nor technical picture helped BTC to stay above 117. While US Treasury is started drain liquidity and borrow (they need 1 Trln this month), sending ~ 150 Bln to its TGA account with the Fed - BTC got hurt.
Now price stands at vital area - previous tops. If BTC will drop under 110K, collapse could start. Let's hope that this will not happen...
Meantime, we're at 112-113K support. We already talked about it before. Here we have reversal bar and bullish engulfing pattern, so maybe we could get a bit higher pullback on intraday chart. 113.8 and 113.1K support areas on 1H TF might be considered for long entry. Invalidation point for this plan is the low of engulfing pattern.
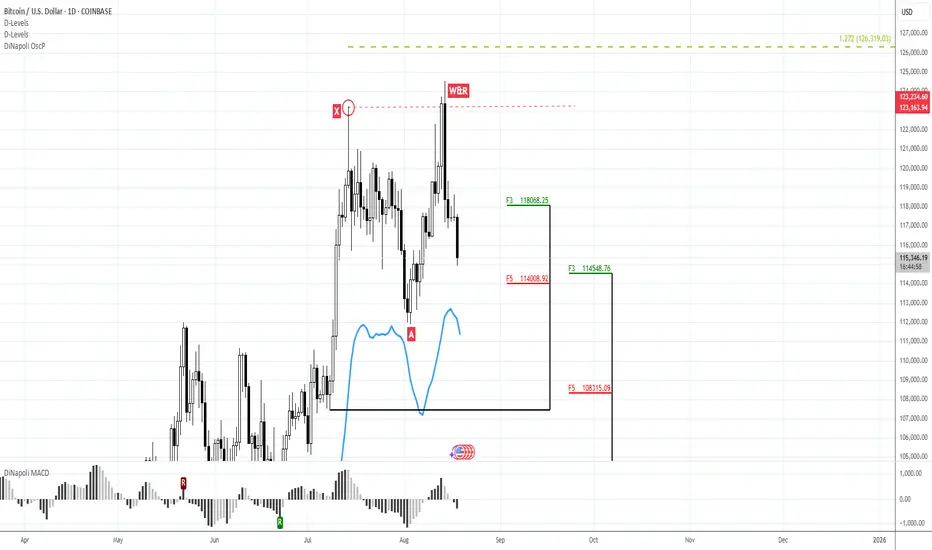
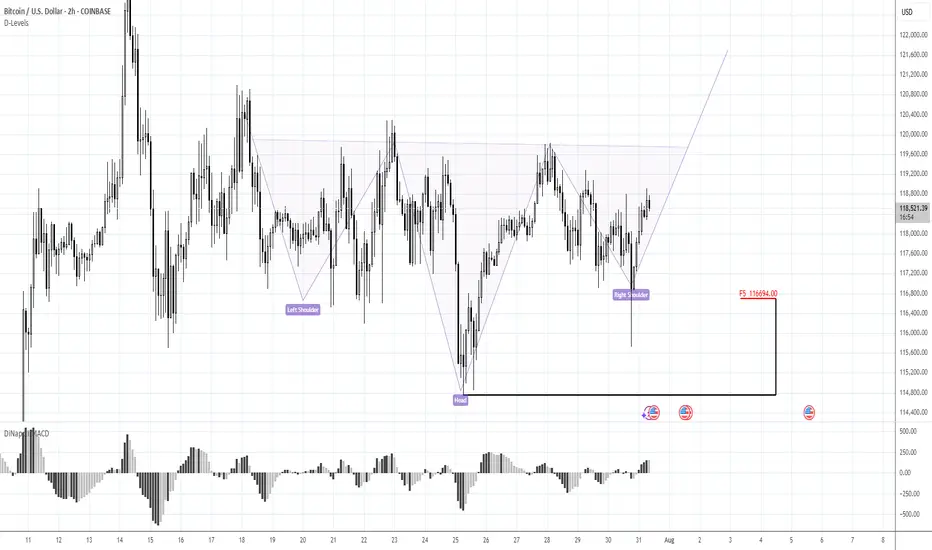
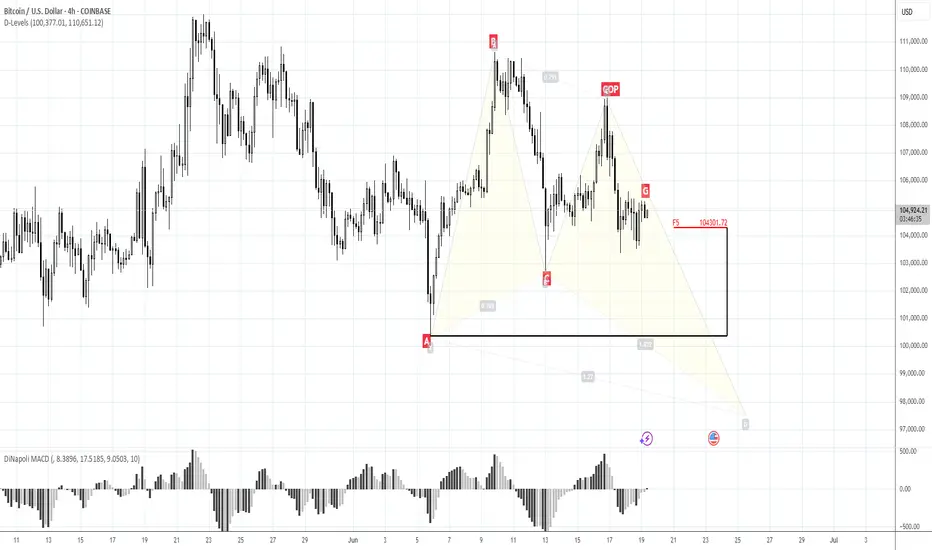
Keep following to the H&S PatternMorning folks,
To be honest, not too many things to talk about. We've prepared our scenario with H&S is still valid. Reaction to GDP numbers was quite welcome as it set the right arm's bottom. The only thing that we have to be busy with is to control its validity - reaching of the neckline and price standing above 116 lows and right arm.
At the first signs that market is start falling back - do not take any new longs. H&S failure is also the pattern and in this case we get deeper correction. But daily chart still makes me think that bullish context is here
BTC 116.70K stands in focusMorning folks,
Once we've prepared the analysis, we've got upsetting squeeze down, thanks to Galaxy massive sell-off. I don't know what they were trying to do - either hunted for stops under 116K, or just sold in most unwelcome moment... but unfortunately such an issues are out of our control.
For now - BTC totally reversed this sell-off and once again shows positive sentiment. Now we consider same reverse H&S pattern, but this time of a bigger scale. 116.70K support area, where, the right arm should be formed now stands in our focus for long entry. We consider no shorts by far. Hopefully no more tricks will follow from old Donny or somebody else...
BTC Ready to Start to 125KMorning folks,
Better if you combine this update with previous idea. Now it seems that BTC stands in swamp action, flirting around 116K, which might be looking a bit bearish.
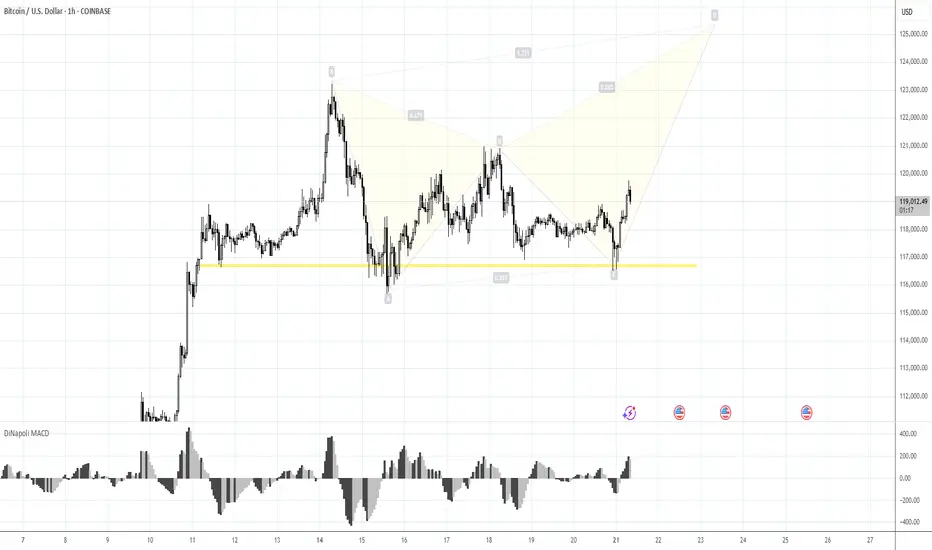
But by our view, this is not quite so. First is, triangle patterns as on daily chart as on 4H chart are look great and quite bullish. Pay attention that on 4H chart all sell-offs were bought out.
Our 1.16 lows that we set as vital ones for this scenario area still intact. So, it means that butterfly with 125K target that we discussed last time is also intact. I would say more. If you take a careful look at 1H chart - you could recognize reverse H&S pattern that could trigger all this stuff. It means that we're not in swamp, but at the point where the decision on long entry has to be made...
Take care
S.
Risk 116. Target 123-125KMorning folks,
Prior 1H H&S was done, we were watching on 120K resistance area, as we said last time. Now, on 1H chart H&S is showing signs of failure - too extended right arm, no downside breakout. Price is taking the shape of triangle . All these signs are bullish. Because butterflies very often appear on a ruins of H&S, we suggest that this one could be formed here...
The risk level for this scenario is 116K lows - BTC has to stay above it to keep butterfly (and triangle) valid, otherwise, deeper retracement to 112K area could start.
Upside target starts from 123K top and up to 125K butterfly target.
120K is the Key.Morning folks,
Our last plan worked perfect - market re-tested 117K support and jumped out. If you have longs - you could keep it.
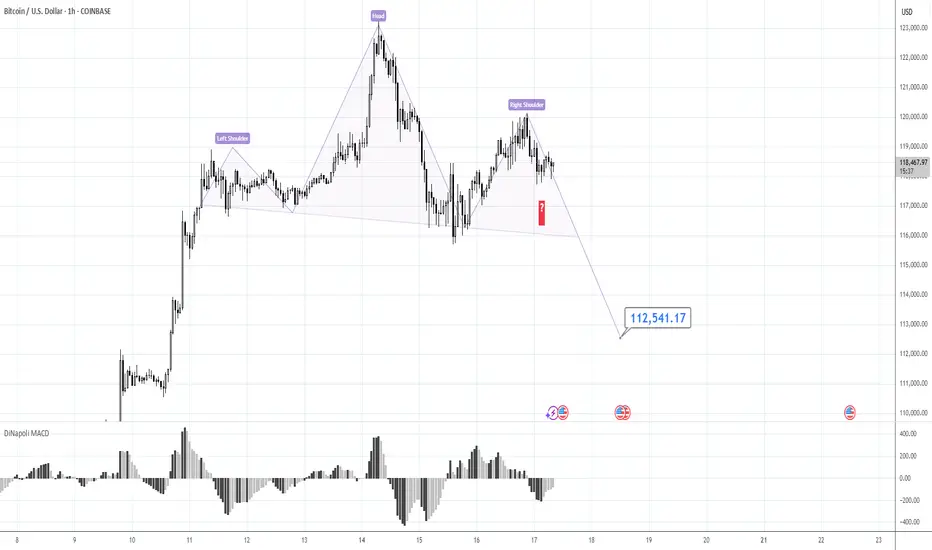
We consider now two alternative scenarios, although we think that this one with triangle is more probable, we do not exclude the H&S shape on 1H chart that could lead BTC down to 112-113K support area.
So, if you do not know how to deal with this - keep an eye on the 120K area and top of the right arm. Upside breakout will confirm H&S failure and triangle scenario. Otherwise, until market stands under 120K - consider H&S as a basic scenario, just for safety.
Take care, S.
127KMorning folks,
So, BTC shows even better performance that we thought, although it obviously something stands behind, this is not market-natural motion. Anyway, we consider 127K level as all-time nearest target that stands on monthly chart.
If any pullback starts (BTC now is at daily overbought and near Yearly Resistance Pivot), we keep an eye on 117.2K and 113.5K levels to decide on long entry
115.70K is the next one, 107K - RiskMorning folks,
Just to keep it short... our butterfly worked perfect, we've got our 111.65K target. Overall sentiment stands bullish. But - we do not want to see just stops grabbing around the top (aka Wash&Rinse). We want stable standing above broken daily trendline out of the flag consolidation .
So BTC has to stay above 107K lows to keep bullish context valid. That's why, if you plan to buy - you do not need to consider too far standing levels and lows for stop placement.
If, still, BTC drops under 107K, we suggest deeper retracement, under 100K level.
Conversely, if everything goes as we plan, next upside target is 115.70K.
So, if you plan to Buy: use local deeps on 1H chart and control 107K lows. This is your invalidation point.
If you want to sell: watch for clear signs of W&R of the top - engulfing patterns, spikes etc and following reversal patterns on 1h chart. Say, H&S, or any other.
For now I mark this setup as bullish.
111.65 against 105KMorning folks,
So we've got great entry with our H&S but it is early to relax. To avoid long explanations - BTC has to stay above 105K lows to keep current tendency valid. So, if you still plan to buy BTC here - you do not need to watch for too deep standing Fib levels.
If BTC will still drop below 105K, we could get extended downside action to 100K and maybe even deeper.
Nearest upside target with our current plan is 111.65K.
Wait for something more reliableMorning folks,
Since our last update action was anemic. Nothing has changed seriously. BTC was able to show just minor upside action. Based on current performance, I do not want to take long position right here and prefer to wait for something more reliable. Because BTC action stands rather different from the one that we expected to see.
For example it might be H&S pattern on 1H chart. Thus, an area around 103K seems the one that we will keep an eye on.
110K, maybe 112K at the bestMorning folks,
So, previous setup is done perfect, and BTC even reached 108K area. Now we think that upside potential is limited, at least in short-term. Price is coming to resistance area around 110K and previous top. Some intraday targets point on 112K area as well, but I wouldn't count now on something more extended.
The point is US Dollar stands at record monthly Oversold. So, its weakness in short term is limited as well. Besides, we're coming to very bumpy period of tariffs negotiations from 9th of July, debt ceil discussion and BBB voting, as early as tomorrow...
So for now, uncertainty and risk overcome the upside potential on BTC.
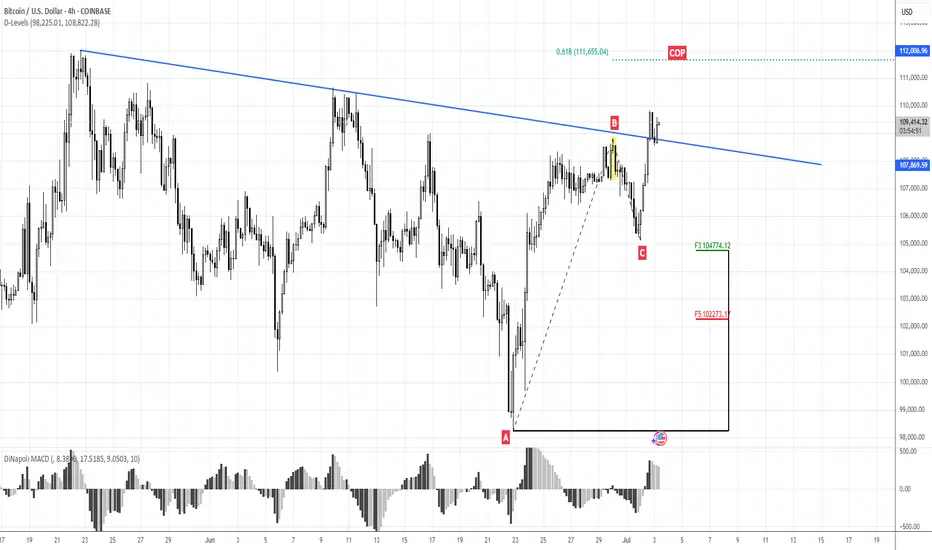
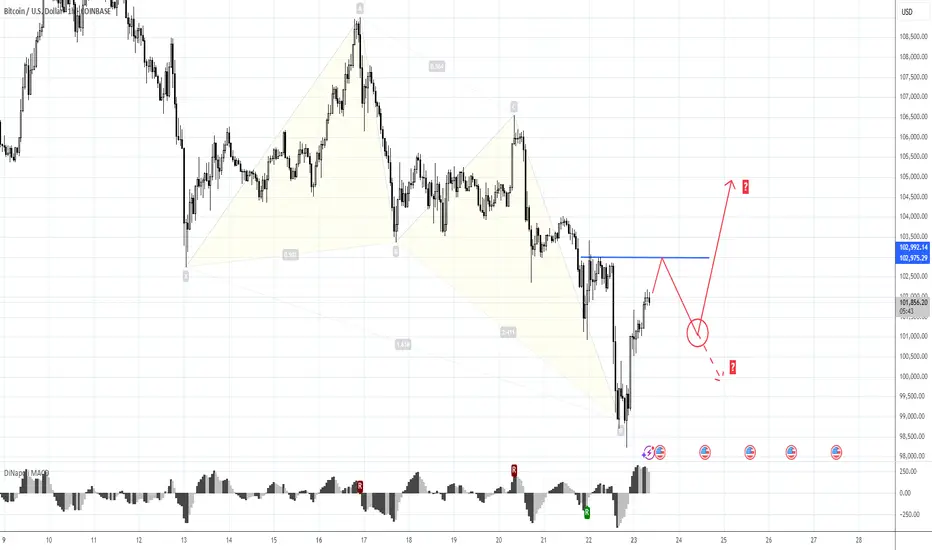
103 to 101K trade and reverse H&S patternMorning folks,
So, our Thu setup is done perfect, both targets are met and even more. Now we consider two different fast trades on BTC.
Now context remains bearish and 103K is rather strong 4H resistance area. So, first trade is scalp "Sell" from ~ 103K with "at least" target of 101K. In fact, choosing of 101K as a minimal target is based on the 2nd trade.
2nd trade is potential reverse H&S is sentiment on the market will start changing. But this is not the fact yet. That's why I place downside arrow here as well, if H&S will not be formed or start failing, BTC could drop lower so, downside trade might be even better.
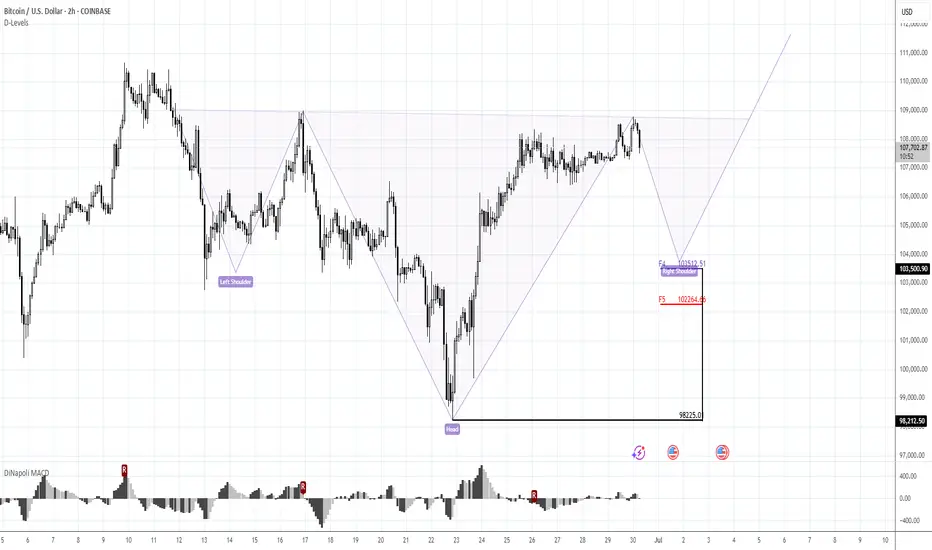
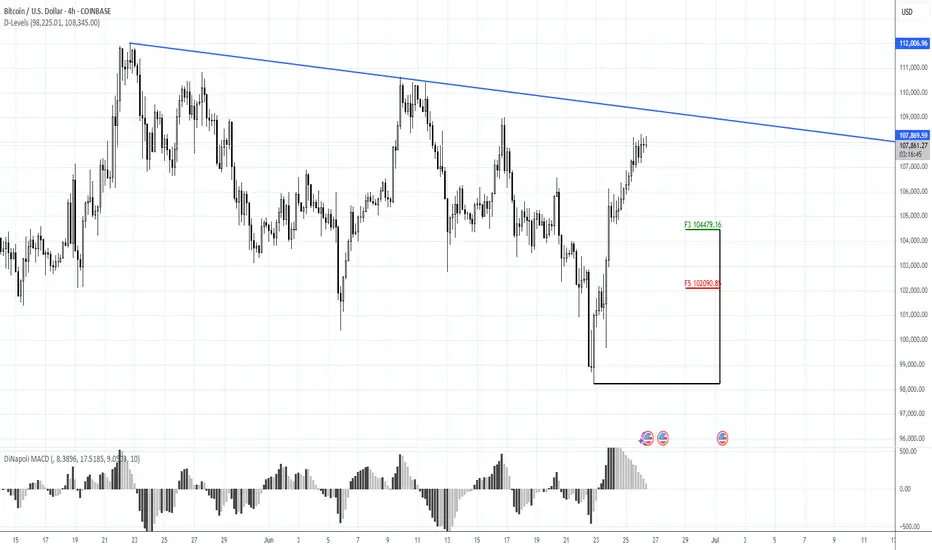
99K and 97.5K potential targetsMorning folks,
As you can see, not occasionally last time we chose only nearest 107K and 109K targets. Market indeed looks a bit heavy. Now short-term context turns bearish and we consider reaching of 99K target as rather high. Next potential target area is 97.K - butterfly target and daily Fib support.
Obviously now we do not consider any new longs and need some clear signs of sentiment changing, that we do not have by far. Let's see what will happen around support area
107.6-107.8 and 109-110KMorning folks,
So, position taking stage is done, now let's take a look at targets. In general we have a sequence of a few targets, starting from 107.6-107.8, 109-110, 113 and 116K. But in current situation I would watch for only first two.
Daily overbought is around 114, so 116K target seems too far. 113K is possible, but with rather extended downside action last week, it seems as very optimistic. That's why, more or less base case seems around 109-110K, while the easiest target is 107.6-107.8K.
So, once the first target will be reached - think about partial profit booking, if you want to continue trading. Say, take off 30-40% and move stops to the breakeven on the rest.