GBPUSD: Bearish Momentum vs. Fundamental Repricing – Key LevelsGBPUSD is at a critical juncture, balancing a clear technical breakdown with a fundamental backdrop favoring near-term volatility. The pair has slipped from its rising wedge structure and is now testing key retracement zones while markets reprice expectations for Fed rate cuts after weak US jobs data. Traders are closely watching whether this bearish momentum will extend toward the 1.3128 support or if a rebound from oversold conditions could trigger a corrective bounce.
Technical Analysis (8H Chart)
Pattern: Clear breakdown from a rising wedge, confirming bearish bias.
Current Level: Price sits near 1.3278, struggling to reclaim the 1.3300 resistance zone.
Key Support Zones:
1.3128 (61.8% Fibonacci retracement) – main bearish target.
1.2945 (78.6% retracement) – extended downside target if selling pressure deepens.
Resistance Levels:
1.3300 (immediate resistance, prior support now flipped).
1.3380 (secondary resistance if a retracement rally occurs).
Projection: Likely bearish continuation toward 1.3128, with a potential retest of 1.3300 before continuation.
Fundamental Analysis
Bias: Bearish in the short term, but Fed policy and risk sentiment remain key drivers.
Key Fundamentals:
USD: Weak NFP (73K), higher unemployment (4.2%), and downward revisions boost Fed cut bets (~75% for September), typically a USD-negative factor.
GBP: BOE maintains a cautious stance due to sticky inflation but lacks clear hawkish conviction as growth slows.
Tariffs: US tariffs add a mild negative weight on GBP trade sentiment.
Risks:
Hot US CPI could slow Fed cut bets, supporting USD.
Hawkish BOE comments could limit GBP downside.
Global risk sentiment shifts could either favor USD (risk-off) or weaken it further (risk-on).
Key Events:
US CPI and PPI for USD direction.
BOE policy updates and UK CPI.
US jobless claims and Fed commentary.
Leader/Lagger Dynamics
GBP/USD is a lagger, mainly reacting to USD shifts. However, its moves directly influence GBP crosses such as GBP/JPY and GBP/CHF.
Summary: Bias and Watchpoints
GBP/USD remains in a bearish phase, targeting 1.3128 with a potential corrective bounce toward 1.3300 first. The primary driver is the technical breakdown, while fundamentals add volatility around US CPI and BOE policy. If CPI surprises lower, the bearish outlook could reverse into a short-term rebound; if CPI is hot, downside momentum could extend. You should monitor USD-driven events closely as GBP/USD sets the tone for broader GBP movements.
Forexsetup

EURAUD Ready to Bounce? Key Support & Fundamentals Aligned!Today I want to share a Long position idea on EURAUD ( OANDA:EURAUD ) with you.
From a fundamental perspective , both the Euro (EUR) and Australian Dollar (AUD) are currently under pressure. However, the Aussie appears fundamentally weaker in the short term, making the EURAUD Long setup more favorable at this stage.
AUD Weakness :
The Reserve Bank of Australia (RBA) has held rates steady at 3.85%, but recent inflation data has dropped to 2.7%, the lowest in over 3 years.
Most economists now expect the RBA to cut rates in its next meeting in August, possibly by 25 basis points.
Slowing economic growth and dovish forward guidance from the central bank are weighing heavily on AUD sentiment.
EUR Outlook :
The European Central Bank (ECB) is also facing weak economic data, but is taking a more cautious approach toward cutting rates.
Despite softer PMIs and sluggish growth in countries like Germany and France, the ECB has not confirmed a near-term rate cut, keeping EUR relatively stable.
This divergence between the RBA’s dovish stance and the ECB’s pause is supportive of EUR strength against AUD.
Summary :
With the RBA likely to ease policy soon and the ECB holding ground for now, the interest rate differential favors EURAUD upside. Fundamentals point toward further weakness in AUD, making the EURAUD Long a strategically sound trade idea for the coming days.
-------------------------------------------
Now let's analyze the conditions of the EURAUD chart on the 4-hour time frame .
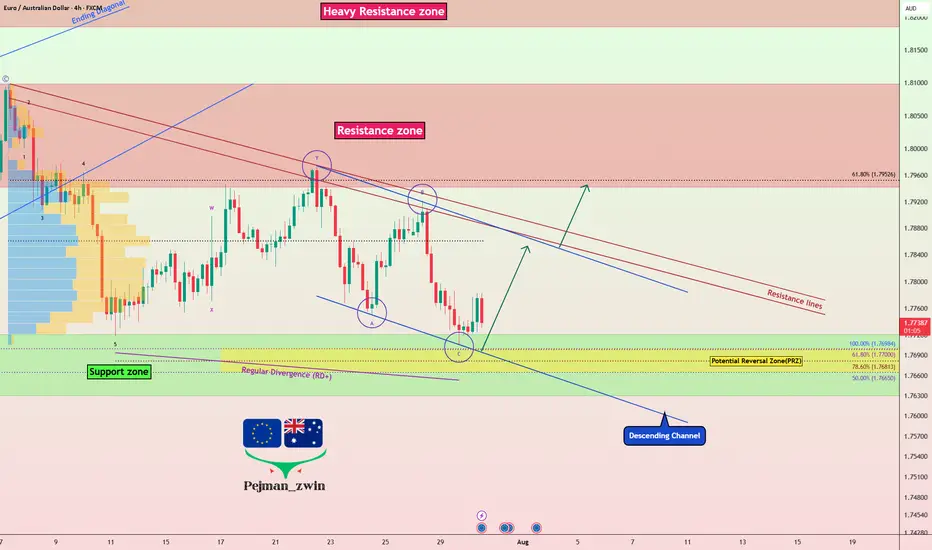
EURAUD is currently trading near the Support zone(1.772 AUD-1.763 AUD) , Potential Reversal Zone(PRZ) , and near the lower line of the descending channel .
According to Elliott Wave theory , EURAUD appears to have completed a Zigzag Correction(ABC/5-3-5) .
Also, we can see the Regular Divergence(RD+) between Consecutive Valleys .
I expect EURAUD to rise to at least 1.784 AUD .
Second Target: 1.792 AUD
Note: Stop Loss(SL): 1.762 AUD
Please respect each other's ideas and express them politely if you agree or disagree.
Euro/Australian Dollar Analyze (EURAUD), 4-hour time frame.
Be sure to follow the updated ideas.
Do not forget to put a Stop loss for your positions (For every position you want to open).
Please follow your strategy and updates; this is just my Idea, and I will gladly see your ideas in this post.
Please do not forget the ✅' like '✅ button 🙏😊 & Share it with your friends; thanks, and Trade safe.
AUD/USD ANALYSIS: WHERE ARE WE HEADED Good afternoon
Based on what we are saeeing with AUD/USD we see two options
1) Below .645 low then we can see a decent drop down to .635
2) If we can break the highs of .652 then a drive up to .65951 makes sense
Trade Smarter Live Better
Kris

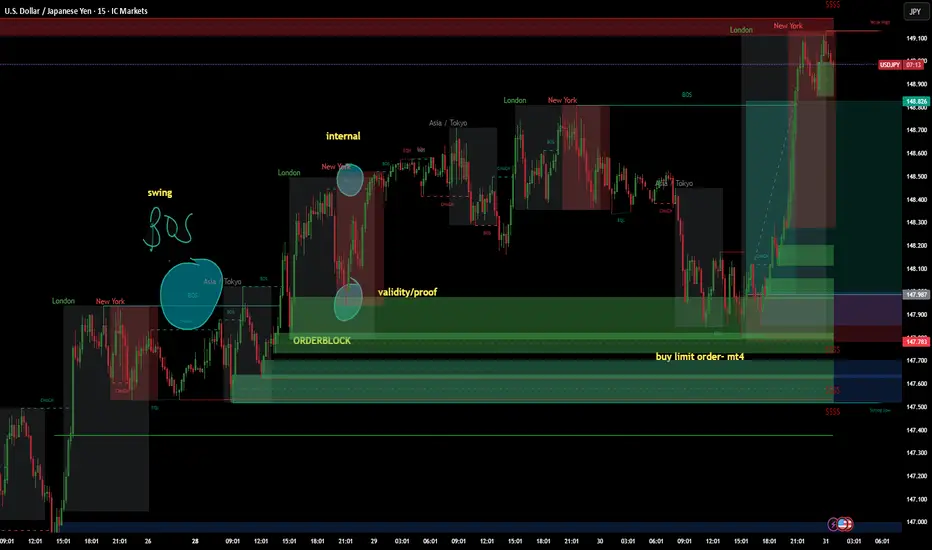
July 30 2025 USDJPY Buy Limit ActivatedGood day, folks!
Another trade today! This is a continuation trade before the USD fundamental news. I've got some useful schematics on my chart for trading continuation momentum patterns with positive confluence in your fundamentals. You can see a swing structure BOS with validity of an internal structure: another BOS. I waited for the price to tap again into that valid order block, which also had validity of internal structure - BOS. The risk-reward (RR) is 1:4. Check the chart for detailed annotations.
I hope you find value in this trade today. Until next time!
#proptrader
#wyckoff
#supplyanddemand
#riskmanagement
EURGBP Analysis : Bearish Leg Nearing Completion + Target Zone📍 Overview:
The EURGBP pair has recently provided significant price action signals that suggest a high-probability reversal setup is unfolding. This analysis dives deep into market structure, supply and demand dynamics, and institutional price behavior using MMC principles.
The current focus lies in identifying a potential trend reversal opportunity after a sharp decline from a key supply level, as price nears a well-marked Reversal Zone. This detailed breakdown covers each phase to provide clarity and trade planning.
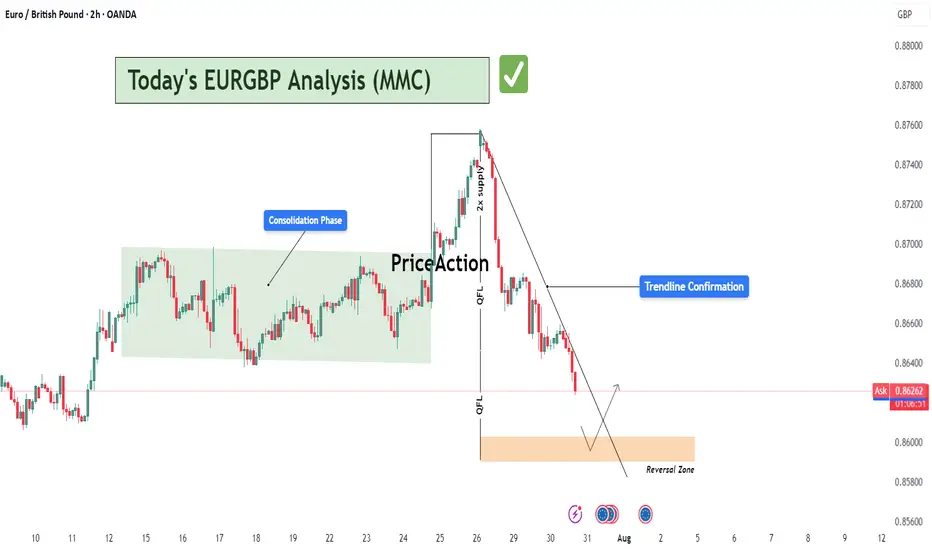
🧩 Phase 1: Consolidation Phase (Accumulation)
From July 11th to July 24th, EURGBP moved sideways within a clearly defined range-bound structure (highlighted in green).
This consolidation indicates a battle of control between bulls and bears, typically signaling accumulation or distribution depending on breakout direction.
The tight price action and wicks on both sides suggest market makers accumulating positions before a breakout.
Price eventually broke out to the upside, confirming bullish accumulation rather than distribution.
🚀 Phase 2: Impulse Move & 2x Supply Rejection
Following the breakout from the consolidation, price experienced a strong impulsive rally, catching breakout traders and pushing into a major supply zone.
The area where price reversed is marked as a 2x supply rejection zone, suggesting heavy institutional sell orders were triggered.
This zone aligns with a historical resistance level and is critical in the current structure.
Price failed to sustain the bullish momentum, forming a sharp drop right after tapping into supply, indicating strong selling pressure.
🔄 Phase 3: Market Structure Shift via QFL (Quick Flip Levels)
As the price dropped from the supply zone, two significant QFL levels were printed in quick succession.
QFL (Quick Flip Levels) represent a break in internal structure, showing that buyers were no longer defending the previous support zones.
These quick flips signal an aggressive shift in momentum from buyers to sellers.
Each QFL breakdown was followed by a new lower low, confirming the start of a bearish sequence or trend leg.
📉 Phase 4: Descending Trendline & Dynamic Resistance
After the QFL shifts, a clear downtrend channel formed, respected by multiple lower highs.
The descending trendline drawn from the supply zone peak has acted as dynamic resistance, rejecting every bullish pullback attempt.
This trendline provides technical confluence for intraday traders to manage risk and timing entries.
🟠 Current Market Context: Entering the Reversal Zone
Price is now approaching a marked Reversal Zone (highlighted in orange).
This zone represents a high-probability demand area, previously respected as a base before the rally to supply.
If price reaches this area and shows signs of exhaustion (e.g., bullish engulfing, long wick rejection, volume divergence), it may serve as a reversal point.
This zone aligns with MMC logic — market makers tend to react at zones of trapped liquidity, especially after stop hunts.
📈 Projected Scenario & Trade Setup:
Price drops into the Reversal Zone
A bullish rejection pattern appears (e.g., pin bar, engulfing candle)
Price retests and breaks the descending trendline to confirm a momentum shift
Entry can be taken post-breakout or with aggressive confirmation inside the zone
Stops placed below the zone; targets aligned with the previous QFL or trendline retest
⚠️ Key Notes for Traders:
Don't chase the move. Wait for reversal confirmation before entering.
QFLs offer strong structure-based levels to identify where the market flipped.
Use trendline confluence and volume confirmation for precise entries.
Monitor price action in the Reversal Zone — if invalidated, the downtrend may extend toward the next macro support.
Apply proper risk management and stay patient for the setup to fully develop.
📊 Summary:
🧭 Bias: Short-term bearish → possible reversal bullish
🎯 Entry Area: Reversal Zone (0.85800 – 0.86000 approx.)
⛔ Invalidation: Clean break and close below 0.85700
🏁 Potential Target: First TP near 0.86750; extended TP near 0.87050 (previous QFL level)
🔄 MMC Approach Recap:
This analysis follows the Market Maker Cycle (MMC) method, which involves:
Consolidation (Accumulation)
Manipulation (False Breakouts or Stop Hunts)
Distribution (Rapid Expansion & Flip Levels)
Re-Accumulation or Reversal
Each step is clearly defined in this chart, offering a blueprint for both trend traders and reversal specialists.
💬 Let's Talk:
What do you think about this setup? Are you seeing similar MMC patterns on other EUR or GBP crosses?
Drop your thoughts, charts, and questions below!
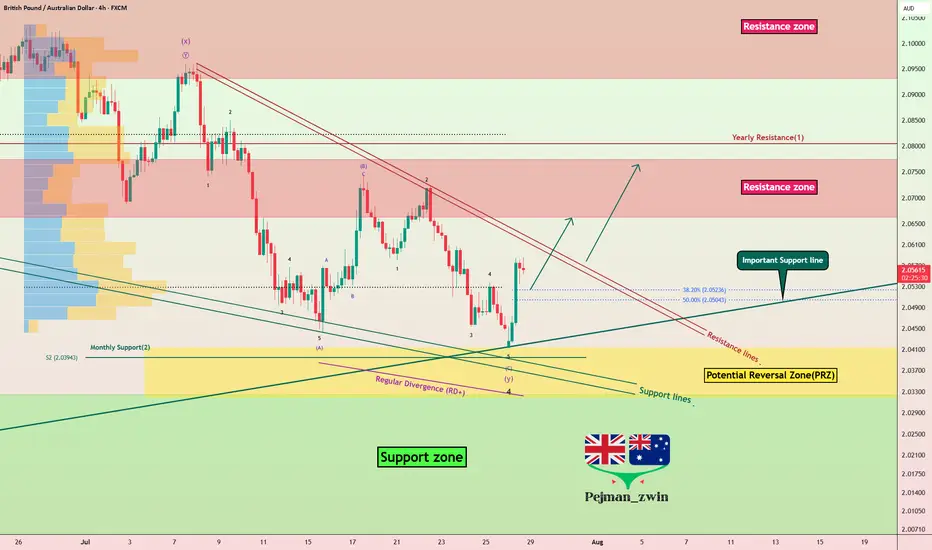
GBPAUD Reverses from Key Zone – Long Setup in Play!Today I want to share with you a Long position on GBPAUD ( OANDA:GBPAUD ).
GBPAUD started to rise well from the Important Support line , Support zone(2.032 AUD-1.987 AUD) , and Potential Reversal Zone(PRZ) and managed to close the 4-hour candle above 2.053 AUD (important) .
In terms of Elliott wave theory , GBPAUD seems to have completed the main wave 4 . The main wave 4 structure was a Double Three Correction(WXY) .
Also, along the way, we can see a Bullish Marubozu candle , which could indicate a continuation of the uptrend .
I expect GBPAUD to break the Resistance lines soon and attack the Resistance zone(2.078 AUD-2.066 AUD) .
First Target: 2.065 AUD
Second Target: 2.076 AUD
Note: Stop Loss(SL): 2.040 =Worst SL
Please respect each other's ideas and express them politely if you agree or disagree.
British Pound/ Australian Dollar Analyze (GBPAUD), 4-hour time frame.
Be sure to follow the updated ideas.
Do not forget to put a Stop loss for your positions (For every position you want to open).
Please follow your strategy and updates; this is just my Idea, and I will gladly see your ideas in this post.
Please do not forget the ✅' like '✅ button 🙏😊 & Share it with your friends; thanks, and Trade safe.
USDNOK short potential setupUSDNOK recently broke down below the monthly 50ema (overlayed on this 4h chart) and has rejected off the daily 20ema (overlayed) twice this week. RSI is showing bearish momentum after a brief overbought period while the PA has remained in a strong downtrend. Short setup potential is evident but not certain.
I'm a cat not a financial advisor.

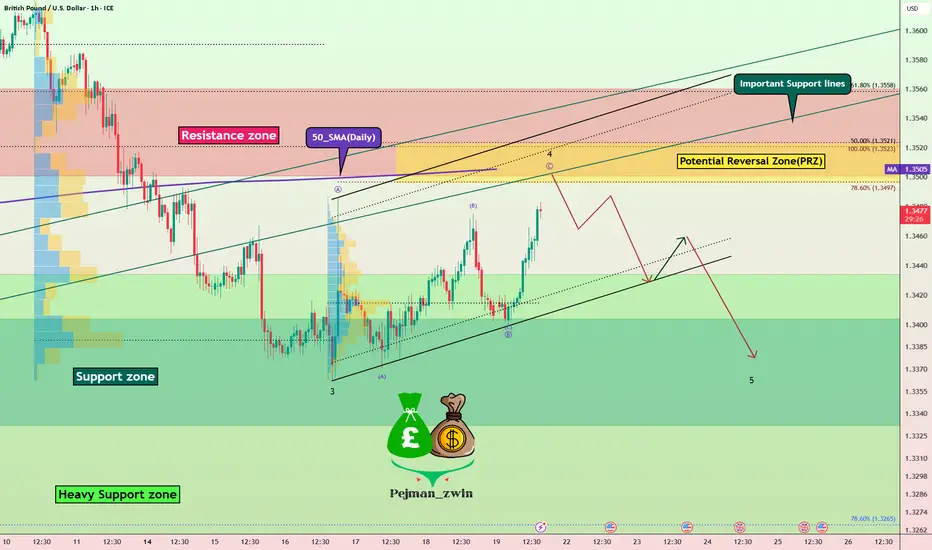
Short Opportunity on GBPUSD – Technical & Fundamentals AlignToday I want to look at the Short position opportunity in GBPUSD ( FX:GBPUSD ). So let's take a look at the GBPUSD pair from a fundamental and technical perspective.
Fundamental Analysis:
The British Pound remains under pressure due to growing expectations of a 25–50 bps rate cut by the Bank of England in early August. Markets are increasingly leaning toward easing as UK inflation hit 3.6% in June, the highest in over a year, while economic growth weakened and consumer confidence dropped to its lowest since early 2024
Ongoing fiscal concerns, including potential tax hikes and budget instability, continue to weigh on the pound. In contrast, the US Dollar( TVC:DXY ) remains relatively robust—supported by strong economic data and a safe-haven preference amid global uncertainty
Summary:
BoE easing becomes more likely due to weak UK data and inflation.
Fiscal risks and low consumer sentiment add downward pressure on GBP.
USD strength from solid data and safe-haven demand supports further GBPUSD downside.
-------------------------
In terms of technical analysis , in the 1-hour timeframe , GBPUSD is approaching the Resistance zone($1.356-$1.350) , the Potential Reversal Zone(PRZ) , and the 50_SMA(Daily) . Meanwhile, this return to Important Support lines could act as a pullback to these lines. Important support lines and 50_SMA(Daily) were broken last week.
In terms of Elliott Wave theory , GBPUSD appears to be completing a main wave 4 . Main wave 4 is likely to have a Zigzag Correction(ABC/5-3-5) .
I expect GBPUSD to start declining from the Potential Reversal Zone(PRZ) and reach the targets I have marked on the chart.
Note: Stop Loss(SL): 1.3575USD = Worst Stop Loss(SL)
Please respect each other's ideas and express them politely if you agree or disagree.
British Pound / U.S Dollar Analysis (GBPUSD), 1-hour time frame.
Be sure to follow the updated ideas.
Do not forget to put a Stop loss for your positions (For every position you want to open).
Please follow your strategy and updates; this is just my Idea, and I will gladly see your ideas in this post.
Please do not forget the ✅' like '✅ button 🙏😊 & Share it with your friends; thanks, and Trade safe.
AUDNZD finding support on critical EMAsAUDNZD is finding support at the daily 200EMA (overlayed on 4H chart) and, more significantly, above the monthly 20EMA (overlayed). Break and hold the daily 10EMA (overlayed) will be key.
If the momentum continues we could see a continuation of the ongoing rally however recent AUD monetary policy meeting minutes seemed to lean dovish.
I'm a cat not a financial advisor.

CADJPY daily 20EMA bounceSimple idea here, CADJPY is testing the daily 20EMA (overlayed on this 4H chart) and recently broke above the monthly 20EMA (overlayed)... if price reclaims the daily 10EMA (overlayer) could be a nice move up.
Very simple trade, tight SL if entering.

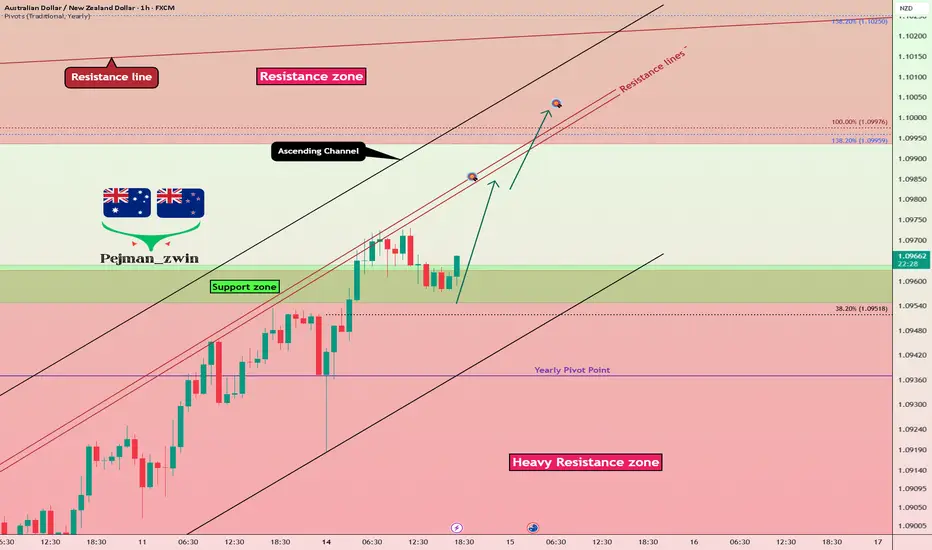
AUDNZD Breakout: Long Opportunity in Ascending ChannelToday I want to share with you a Long position opportunity in AUDNZD ( OANDA:AUDNZD ).
Let's first take a brief look at the AUDNZD fundamentals .
RBNZ kept rates at 3.25% , signaling likely further cuts in August.
RBA paused at 3.60% , but dovish bias remains; markets expect more easing ahead.
As NZD is more pressured by immediate rate cuts than AUD, the fundamental setup favors a bullish AUDNZD.
Now let's find a long position for AUDNZD using technical analysis .
AUDNZD seems to have managed to break through the Heavy Resistance zone(1.0963 NZD-1.0870 NZD) and is moving near the Support zone(1.0964 NZD-1.0954 NZD) on the 1-hour time frame .
AUDNNZD is also moving in an Ascending Channel .
I expect AUDNZD to rise at least to the Resistance lines , the second target is the Resistance zone(1.103 NZD-1.0993 NZD).
Note: Stop Loss(SL): 1.0944 NZD
Please respect each other's ideas and express them politely if you agree or disagree.
Australian Dollar/New Zealand Dollar Analyze (AUDNZD), 1-hour time frame.
Be sure to follow the updated ideas.
Do not forget to put a Stop loss for your positions (For every position you want to open).
Please follow your strategy and updates; this is just my Idea, and I will gladly see your ideas in this post.
Please do not forget the ✅' like '✅ button 🙏😊 & Share it with your friends; thanks, and Trade safe.
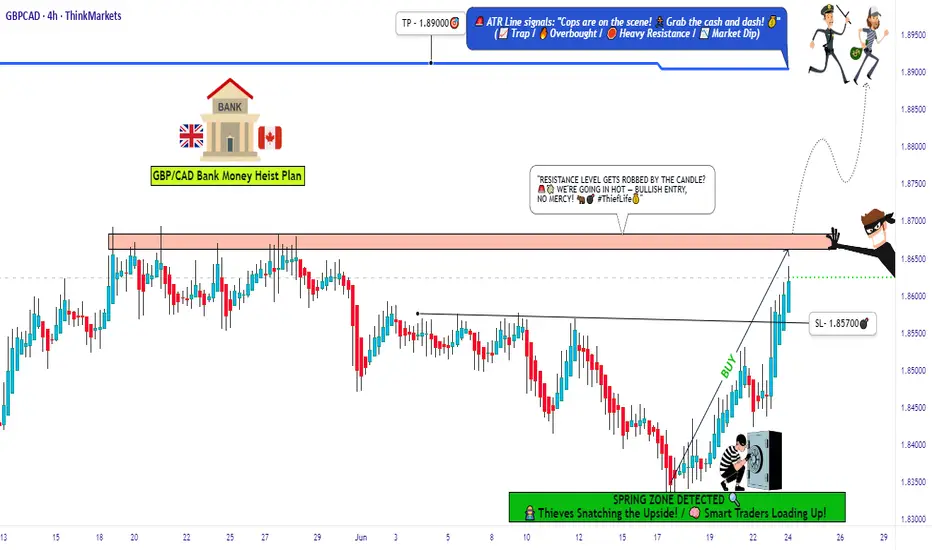
GBP/CAD: Smart Money Heist Strategy – Ready for the Breakout?💼💣 GBP/CAD Forex Bank Heist Plan 🚨 | "Thief Trading Style" 💹💰
🌟 Hi! Hola! Ola! Bonjour! Hallo! Marhaba! 🌟
Welcome to all strategic traders, market tacticians & opportunity seekers! 🧠💸
Here’s our latest Forex blueprint based on the exclusive “Thief Trading Style” – a blend of tactical technicals, smart fundamentals, and stealthy price action moves. We’re preparing for a potential breakout heist on the GBP/CAD a.k.a “The Pound vs Loonie”.
🗺️ Heist Strategy Overview:
The market is forming a bullish setup with signs of consolidation, breakout potential, and trend reversal dynamics. We're eyeing a long entry, but timing is everything. This setup seeks to "enter the vault" just as resistance is breached and ride the move until the ATR High-Risk Zone—where many market players may exit.
🎯 Entry Plan:
📈 Primary Trigger Zone: Watch for a break and close above 1.87000.
🛎️ Set an alert! You’ll want to be ready when the opportunity knocks.
📍Entry Tips:
Place Buy Stop orders above the moving average or
Use Buy Limit entries on pullbacks near recent 15/30min swing lows.
(Perfect for both scalpers and swing traders!)
🛑 Stop Loss Placement:
Thief Trading Style uses a flexible SL system:
Recommended SL at the nearest 4H swing low (~1.85700)
Adjust SL based on your lot size, risk appetite & number of orders
🎤 Reminder: Set SL after breakout confirmation for buy-stop entries. No fixed rule—adapt to your style but manage risk wisely.
🎯 Target Zone:
🎯 Primary TP: 1.89000
🏃♂️ Or exit earlier if price enters a high-risk reversal area
🧲 Scalpers: Stick to long-side trades only and protect your profits with a trailing SL.
🔍 Why GBP/CAD? (Fundamental Notes):
Current momentum is bullish, supported by:
📊 Quant & Sentiment Analysis
📰 Macro Fundamentals & COT Data
📈 Intermarket Trends & Technical Scoring
Get the full data klick it 🔗
⚠️ Caution During News:
To avoid volatility spikes:
Refrain from entering new positions during high-impact news
Use trailing SLs to protect running profits
❤️ Show Support & Stay Tuned:
Smash the 🔥Boost Button🔥 if you love this kind of analysis!
Support the strategy, strengthen our community, and let’s continue this journey of smart, stylish trading.
Stay tuned for the next “heist plan” update—trade smart, stay alert, and manage your risk like a pro. 🏆📈🤝
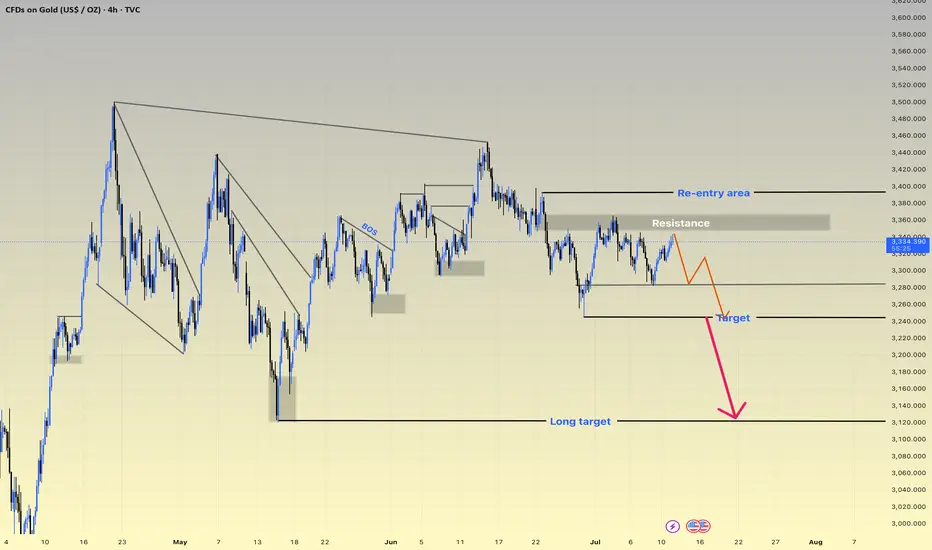
XAUUSD h4 pattern strongly down XAUUSD down it price 3339
Target 3320
Target 3310
Target 3300
Long target 3250
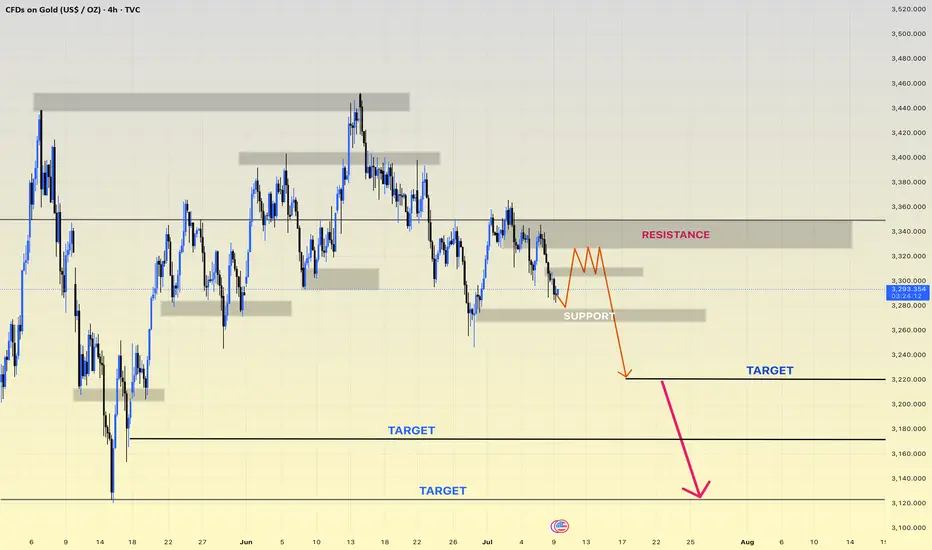
XAUUSD setup selling ideas h4Disruptive Gold Analysis – 4H Chart Perspective
Symbol: XAU/USD 🥇 | Timeframe: 4H
Date: July 9, 2025
⸻
🔁 Scenario Disruption: Potential Bullish Reversal
✅ While the original analysis shows a bearish continuation setup with consolidation under resistance and breakdown towards multiple downside targets, a disruptive view considers a false breakdown or support flip scenario.
⸻
🔁 Alternative Viewpoint:
📍 Current Price Action:
Price is testing the support zone (~3,280–3,290) which has held multiple times in the past.
🟢 Disruption Possibility:
1. Bullish Fakeout Trap Setup:
• Price may create a false breakdown below support to trap sellers.
• A quick recovery and breakout above the consolidation highs (~3,310–3,320) would invalidate the bearish continuation.
2. Resistance Flip Setup:
• If the market reclaims above 3,320, we may see a bullish push towards the key resistance zone at 3,360–3,380.
• This could evolve into a range breakout bullish trend continuation toward previous highs.
⸻
🔄 Disruption Targets:
• 📈 Immediate Upside Target: 3,320
• 📈 Breakout Target: 3,360
• 📈 Extended Bullish Target: 3,400+
⸻
⚠️ Invalidation Level:
If price closes below 3,270, then the original bearish scenario remains intact, with continuation toward 3,240 → 3,200 → 3,140.
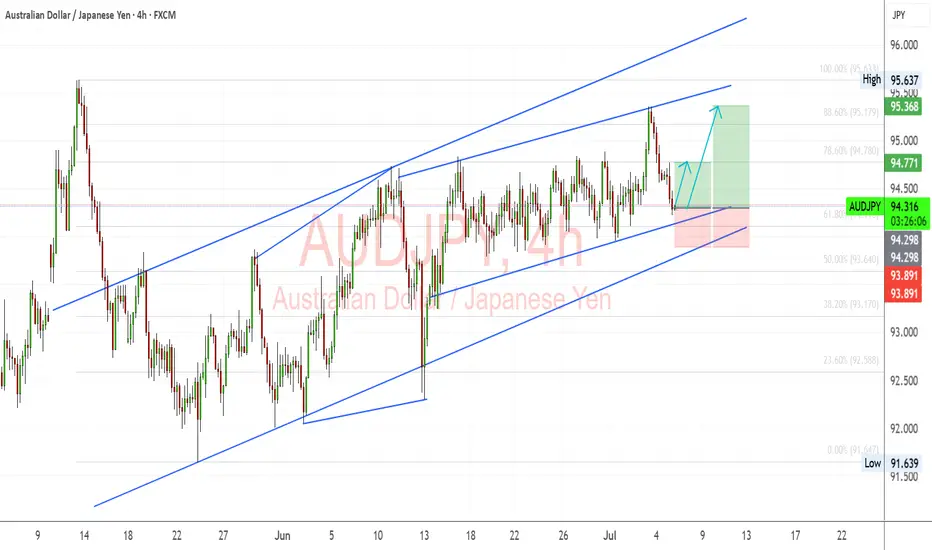
AUDJPY Bullish Channel Still Intact, Eyeing Breakout Above 95.00AUDJPY continues to respect its ascending channel, with the current bounce occurring right at the 61.8% Fibonacci retracement and lower trendline support. The structure supports further upside as long as price holds above the 94.00–93.80 zone, with targets set toward 94.77 and 95.36, potentially extending to 95.63 highs.
🧠 Fundamentals:
AUD Strength Drivers:
RBA remains relatively hawkish vs other G10 banks.
Australia's data this week (retail sales, NAB confidence) were mixed, but no rate cut pricing in the near term supports AUD.
Iron ore demand showing resilience despite Chinese slowdown concerns.
JPY Weakness Drivers:
BoJ remains ultra-dovish. No action expected in July.
Japan’s inflation remains tame; the yield gap with other majors keeps widening.
Risk-on sentiment reduces demand for safe-havens like JPY.
🔍 Technical Structure:
Strong upward channel since early June remains valid.
Current pullback held the 61.8% Fib retracement of the June-July leg.
Bullish engulfing near support confirms entry.
Immediate resistance at 94.77 → 95.36 → potential breakout to 95.63.
Invalid if price closes below 93.80 (channel break).
⚠️ Risk Factors:
Risk-off shift (e.g., geopolitical escalation or U.S. CPI surprise) may boost JPY.
China growth fears can weigh on AUD.
A sudden dovish shift from the RBA would invalidate bullish fundamentals.
🔁 Leader/Lagger Dynamics:
AUDJPY typically leads other yen crosses (e.g., NZDJPY, CADJPY) during risk-on moves. It’s also a barometer for broader risk sentiment, often following moves in equity indices like US500 or commodity-linked assets.
✅ Trade Bias: Bullish
TP1: 94.77
TP2: 95.36
TP3 (aggressive): 95.63
SL: Below 93.80
Event to Watch: China data this week + U.S. CPI (Jul 11)
📌 Watch for a strong bullish daily candle above 94.77 for continuation confirmation. Stay nimble around key global risk events.
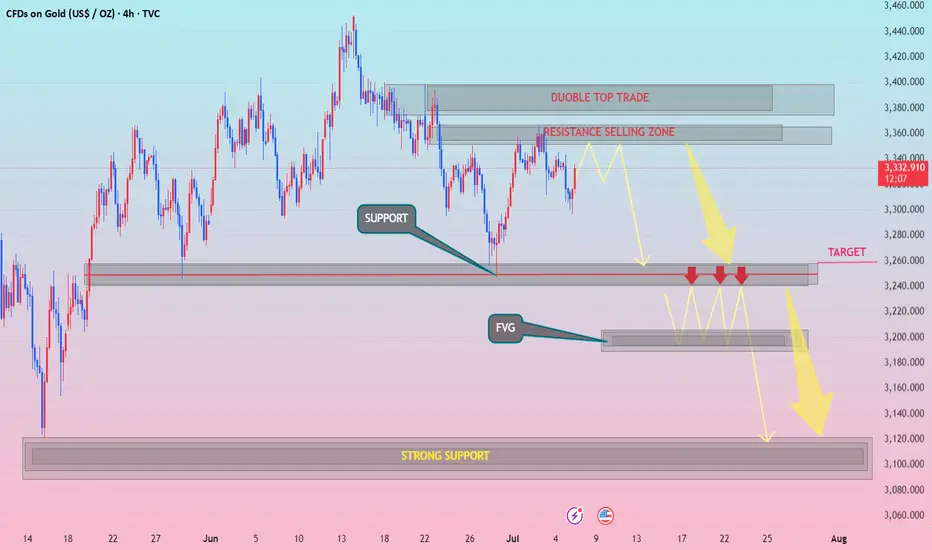
XAUUSD h4 down pattranDouble Top Yes Break above neckline = Bullish invalidation
Resistance Selling Zone Yes May flip to support
Target Zone (3,260) Yes Over-tested support may trigger reversal instead
FVG (~3,200) Yes May not fill if bullish momentum sustains
Strong Support (~3,100) Yes Price might not drop that far before buyers
WITH ZARA..FVG
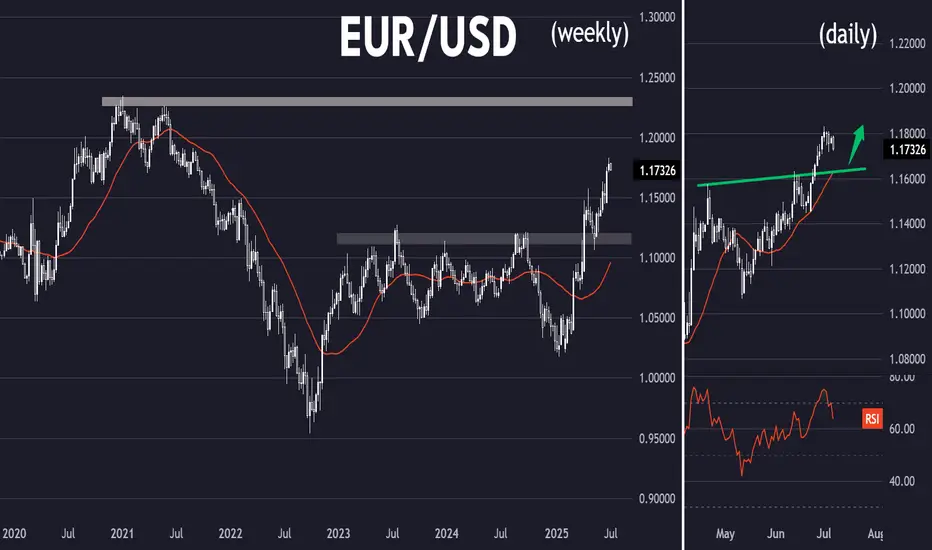
Where the coffee is strong (EUR/USD)Setup
EUR/USD is in a strong uptrend and recently broke above multi-year resistance just under 1.16. The pair looks to be targeting long term resistance at 1.23.
Signal
RSI is dropping back from overbought territory on the daily chart, offering a possible dip-buying opportunity above resistance-turned-support at 1.16.
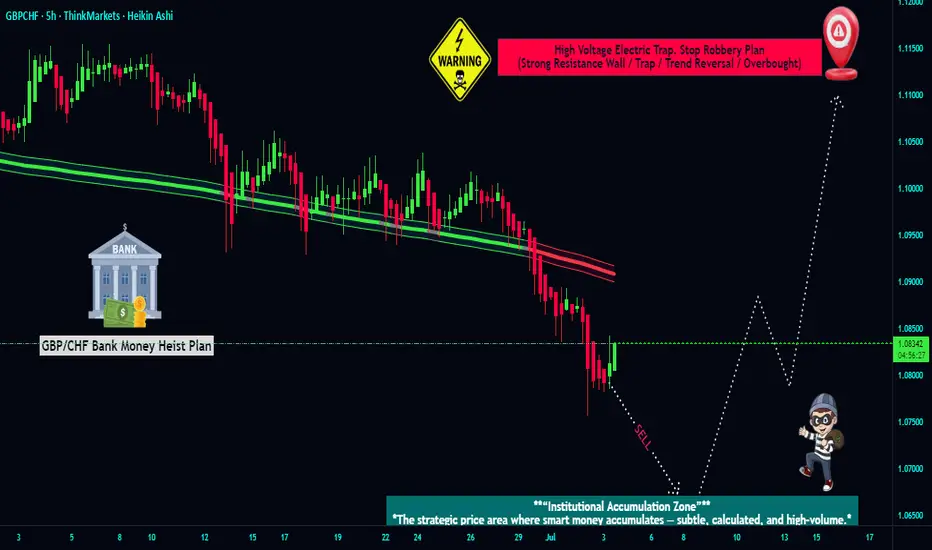
Swiss Vault Job: GBP/CHF Entry Blueprint Unlocked🕵️♂️💼 GBP/CHF: The Swiss Vault Infiltration Protocol 💼🕵️♂️
(Swing/Day Plan — Executed in Silence, Paid in Profits)
🌟Hi! Hola! Ola! Bonjour! Hallo! Marhaba!🌟
Dear Money Makers & Silent Operators, 🤑💰💸✈️
Welcome to the Thief Trading Syndicate's Strategic Playbook – today’s mission targets the GBP/CHF vault. We’ve cooked up a master plan powered by our signature blend of technical finesse and stealthy macro-insight. This setup is based on institutional footprints and high-stakes zones where liquidity flows like digital gold.
📊 Current Bias:
🟥 Bearish weight remains, but we smell bullish smoke beneath — reversal setups in play.
📈 Entry Strategy:
Long (Bullish) — Scout entry above 1.06500+ in higher timeframes (4H+). Retest confirmation required.
Short (Bearish) — “The vault’s unguarded! Slip in short anywhere up top—clean sweep mode.”
🛑 Stop Loss Placement:
Place SL near recent swing highs/lows on the 5H chart (swing basis). Customize per lot size and multiple entries. Your risk defines your escape rope.
🎯 Profit Extraction Target:
Long TP: Aim for the 1.11500 vault door (or vanish before it slams).
Short TP: Dive to 1.06500, or pull the plug earlier if guards wake up.
📰 Strategic Conditions:
This pair’s behavior is currently driven by mixed macro triggers — smart money positioning (COT), sentiment clusters, and market structure traps.
→ For full details: Fundamental macros, COT leaks, sentiment drift, and institutional zones — check your sources.
🚨 News & Risk Protocols:
No new entries during red-folder events.
Use trailing stops to lock loot and run.
💥 Boost Our Bandits!
Smash that ❤️ to strengthen our robbing force. Each tap fuels future missions. No indicators. Just raw street-smart trading edge.
👀 More heists incoming. Stay low. Stay sharp. Stay profitable. 🐱👤🎯📈
AUDCHF: Bullish Flag from PRZ — Rally to 0.54444?AUDCHF ( OANDA:AUDCHF ) bounced from the Potential Reversal Zone (PRZ) , which aligns with the Yearly Support(1) and the 50% Fibonacci level of the previous bullish impulse.
From a Classic Technical Analysis perspective , AUDCHF appears to be breaking out of a Bullish Flag Pattern , which may suggest the continuation of the previous uptrend .
This bullish reaction also confirms the importance of the Support zone(0.51166 CHF-0.49773 CHF) , where buyers stepped in aggressively.
In terms of Elliott Wave theory , it seems that AUDCHF has completed the bearish waves and we should wait for the bullish waves .
I expect AUDCHF to continue rising after a successful breakout from the flag’s upper boundary . If momentum sustains, the target could be around 0.54444 CHF .
Note: Stop Loss (SL) = 0.51972 CHF
Australian Dollar/ Swiss Franc Analyze (4-hour time frame).
Be sure to follow the updated ideas.
Do not forget to put a Stop loss for your positions (For every position you want to open).
Please follow your strategy; this is just my idea, and I will gladly see your ideas in this post.
Please do not forget the ✅ ' like ' ✅ button 🙏😊 & Share it with your friends; thanks, and Trade safe.

NZDJPY Technical + Fundamental Short Alignment = Short SetupToday, I want to review the NZDJPY ( OANDA:NZDJPY ) pair short position from a fundamental and technical perspective . It seems to be in a good zone for a short position.
Do you agree with me?
----------------------------------------
First, let's look at the fundamentals of NZDJPY.
New Zealand (RBNZ):
The Reserve Bank of New Zealand cut the OCR by 25bps in May and hinted at further easing if inflation continues to cool. Recent CPI data has shown clear disinflation trends, increasing the likelihood of more rate cuts in the second half of 2025. Consumer confidence is also declining, and retail sales have been weaker than expected.
Japan (BoJ):
The Bank of Japan is under growing pressure to tighten monetary policy. Inflation remains above 2%, and market expectations for a rate hike later this year are building. Any shift from ultra-loose policy supports JPY strength, especially against weaker yielders like NZD.
Macro Summary:
Diverging monetary policies: RBNZ easing, BoJ possibly tightening.
NZD weakened by soft data, JPY strengthened by policy expectations.
Risk sentiment is currently neutral-to-negative, favoring safe-haven JPY.
Conclusion:
Short NZDJPY is fundamentally justified. The pair aligns with macro forces: NZD is pressured by rate cuts and weak growth, while JPY is poised to strengthen with upcoming policy shifts.
----------------------------------------
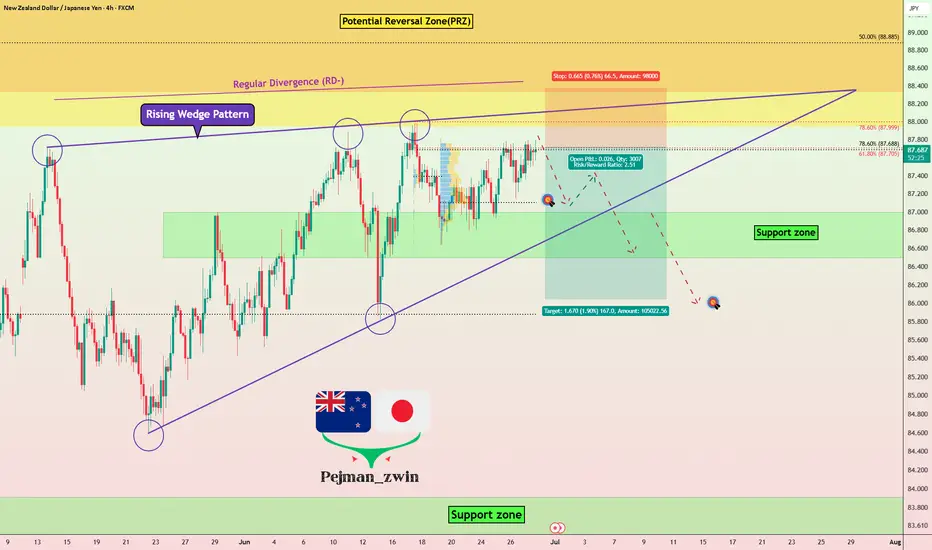
Now let's take a look at the NZDJPY chart on the 4-hour time frame .
NZDJPY is currently trading near the Potential Reversal Zone(PRZ) .
In terms of classic technical analysis , it appears that NZDJPY has successfully formed a Rising Wedge Pattern .
Also, we can see the Regular Divergence(RD-) between Consecutive Peaks.
Based on the above explanation , I expect NZDJPY to drop to at least 87.159 JPY if the lower line of the Rising Wedge Pattern and the Support zone(86.50 JPY-87.00 JPY) are broken, the second target could be 86.043 JPY .
Note: Stop Loss(SL): 88.378 JPY
Please respect each other's ideas and express them politely if you agree or disagree.
New Zealand Dollar/ Japanese Yen Analyze (NZDJPY), 4-hour time frame.
Be sure to follow the updated ideas.
Do not forget to put a Stop loss for your positions (For every position you want to open).
Please follow your strategy and updates; this is just my Idea, and I will gladly see your ideas in this post.
Please do not forget the ✅' like '✅ button 🙏😊 & Share it with your friends; thanks, and Trade safe.
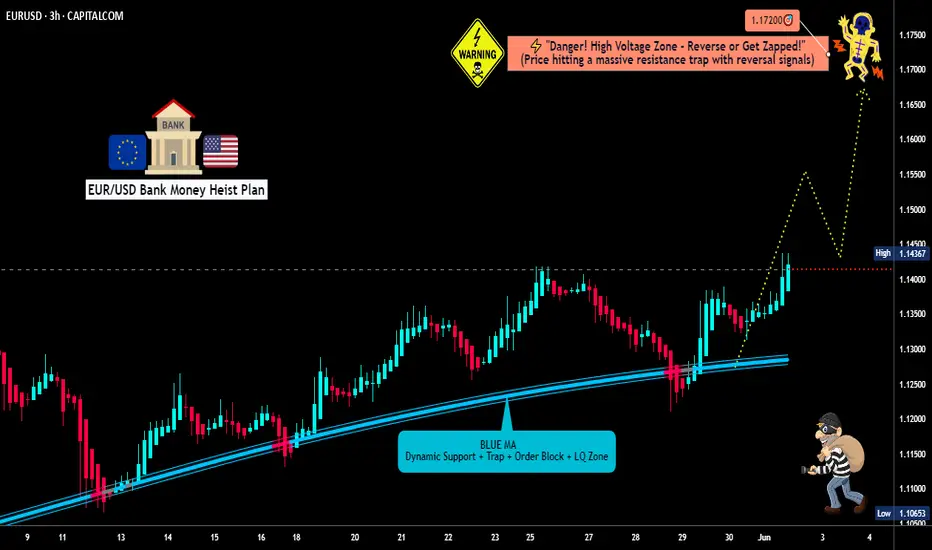
SNATCH & RUN: EUR/USD Long Setup (High-Risk Loot Zone)🔥 EUR/USD Heist: Bullish Loot Before the Trap! (Thief Trading Strategy) 🔥
🌟 Hi! Hola! Ola! Bonjour! Hallo! Marhaba! 🌟
Attention, Money Makers & Market Robbers! 🤑💰💸✈️
Based on the 🔥Thief Trading Style🔥, here’s our master plan to loot the EUR/USD "The Fiber" Forex Market! Follow the strategy on the chart—Long Entry is key. We’re targeting the high-risk Red Zone: overbought, consolidating, and primed for a reversal. Beware the trap—bulls must strike fast before bears ambush! 🏆💸
"Take the profit and treat yourself, trader. You deserve this heist!" 💪🎉
🚪 Entry Point (The Vault is Open!)
📈 "Swipe the bullish loot at any price—the heist is LIVE!"
Pro Tip: Use Buy Limit orders within a 15-30 min timeframe (recent swing low/high). ALERTS ARE A MUST!
🛑 Stop Loss (Escape Route)
Thief SL at nearest swing low (1.12500) on the 3H timeframe (Day/Swing trade).
Adjust based on your risk, lot size, and multiple orders.
🎯 Target (Loot & Scoot!)
🎯 1.17200 (or escape earlier if the cops show up!)
⚡ Scalpers’ Quick Grab
👀 Only scalp LONG!
Big wallets? Raid straight in.
Small stacks? Join swing traders for the robbery.
Use Trailing SL to protect your stolen cash! 💰
📢 Why This Heist? (EUR/USD Bullish Momentum)
"The Fiber" is heating up! Key drivers:
Fundamentals (COT Reports, Macro Data)
Sentiment & Intermarket Trends
Future Targets & Score Outlook
🔗 Want the full intel? Check our bio0 for linkks! 👉👉
⚠️ Trading Alert: News = Danger! 📰🚨
News releases = volatility spikes! Protect your loot:
❌ Avoid new trades during news.
🔒 Use Trailing SL to lock profits.
💖 Support the Heist Crew!
💥 Smash the Boost Button! 💥
More boosts = easier money steals!
Strengthen our robbery squad!
Every day is a heist—profit with Thief Trading Style! 🏆🚀
Stay tuned for the next robbery plan! 🤑🐱👤🤩
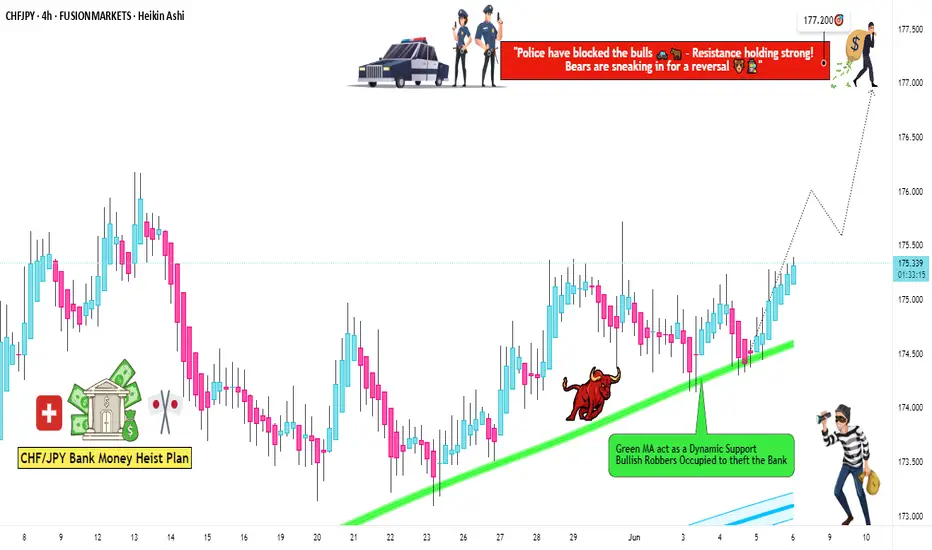
"CHF/JPY Bullish Trap? We’re Stealing Profits Anyway!"🔥 Swiss-Yen Bank Heist: Bullish Loot Grab! (CHF/JPY Master Plan) 🔥
🌟 Hi! Hola! Ola! Bonjour! Hallo! Marhaba! 🌟
Attention Money Makers & Market Robbers! 🤑💰💸✈️
Based on the 🔥Thief Trading Style🔥 (technical + fundamental analysis), we’re plotting a bullish heist on the CHF/JPY "Swiss-Yen" Forex Bank. Follow the strategy on the chart—long entry is our golden ticket! Target? The high-risk Red Zone—where police traps, overbought signals, and bearish robbers lurk. But we’re sneaky thieves… and we always get the loot! 🏆💸
📈 Entry: "The vault is wide open!" Swipe bullish gains at any price—the heist is LIVE!
Pro Tip: Place buy limit orders within 15-30 min (swing lows/highs).
🛑 Stop Loss:
Thief-style SL at recent 4H swing low (174.100) (Day/scalping trade)
Adjust based on your risk, lot size, and multiple orders.
🎯 Target: 177.200 (Time to cash out!)
🧲 Scalpers: Eyes here! 👀
Only scalp LONG.
Big money? Charge in! Small budget? Join swing traders and execute the robbery.
Trailing SL = Your money’s bodyguard. 💰
Why CHF/JPY?
Bullish momentum fueled by:
Fundamentals (COT reports, macro trends)
Sentiment + Intermarket analysis (Check our bioo for deep dives! 🔗👉👉👉)
⚠️ Trading Alert: News = Chaos! 📰🗞️🚫
Avoid new trades during major news.
Trailing stops = Profit protector.
💖 Support the Heist!
Smash the Boost Button! 💥
Strengthen our robbery squad. Steal profits daily with the Thief Trading Style! 🏆💪🚀
Stay tuned—another heist drops soon! 🤑🐱👤🤩
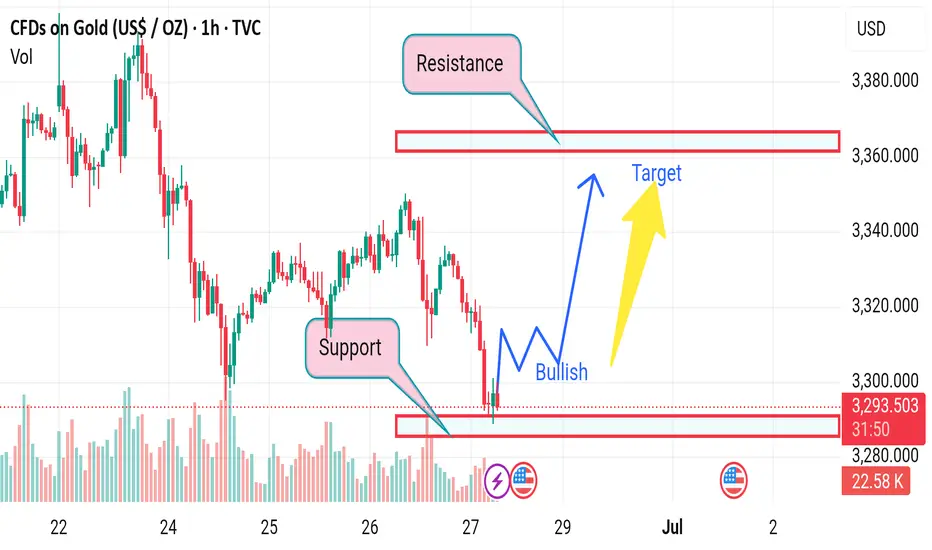
Market next move 🔍 Disrupting the Original Bullish Bias
The original analysis assumes a bullish reversal from the support zone aiming for a resistance target near $3,360. However, let’s challenge that with an alternate (bearish or neutral) perspective:
---
⚠️ 1. Support May Not Hold
Price has tested the support zone multiple times, increasing the probability of a breakdown.
Repeated testing weakens support levels; a breakdown below $3,280 could trigger panic selling or stop-loss hunts, accelerating the drop.
---
📉 2. Bearish Momentum is Dominant
The overall trend is downward, with lower highs and lower lows.
The current bounce could be a dead cat bounce — a short-lived recovery before another drop.
---
📊 3. Volume Analysis
There's no significant bullish volume spike at the support, which weakens the bullish thesis.
This suggests lack of strong buying interest, a red flag for bullish continuation.
---
🔄 4. Resistance May Hold Strong
The resistance area around $3,360 has shown previous strong rejections.
Even if price rises, it could stall or reverse before reaching the target.