GBPUSD Ascending Wedge SetupOANDA:GBPUSD
GBPUSD in a clean little ascending wedge, with long-term bearish bias and short term bullish bias - On the daily, theres some recent clean and strong bullish price action and on the weekly theres a strong bullish candle forming.
To time a better entry, make sure to get on to the lower timeframes.
Anyways guys, good luck and don't forget to trade like a casino.
Forexsetup

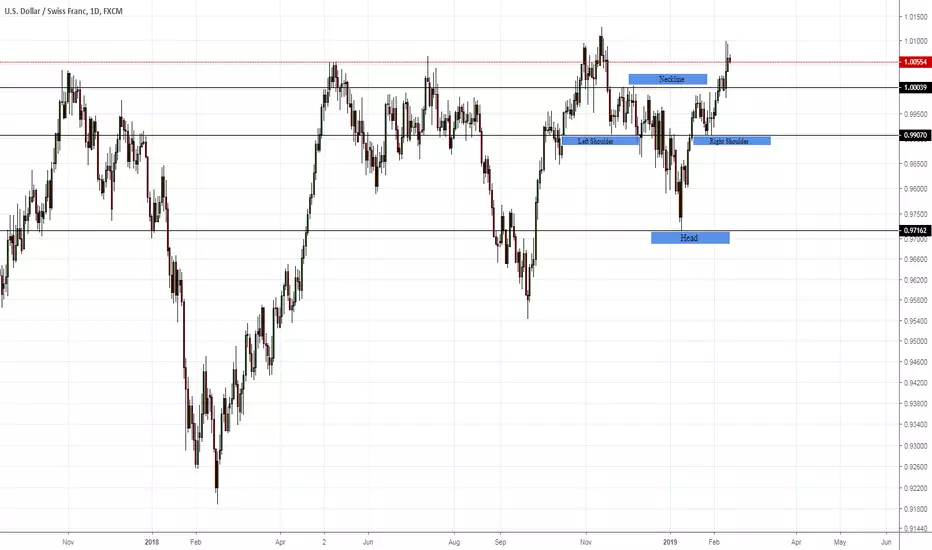
USDCHF READY FOR BIG UPTREND RIDEOn Daily Chart When We Look There is Clear Head And Shoulder Pattern In OANDA:USDCHF
Trader Can Go Long on this Pair Around 1.0050-1.0000 With Exit Trade At Swing Lows of Daily Chart That Is On Right Shoulder As We can see on the chart at .9907 . We Will See 250-300 Pips Upside As Per Daily Chart That Is Around 1.0250-1.0300
I Am Long on USDCHF With Stop of .9907 and target of 1.0250-1.0300
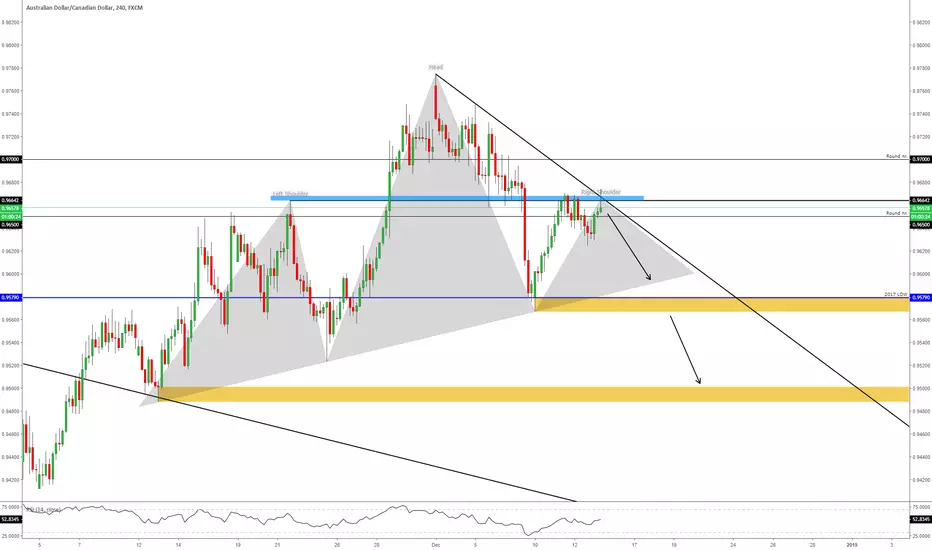
AUDCAD Short OpportunityHey!
AUDCAD Possible Short setup:
1. Last week candle extreme bearish Engulfing
2. H&S chart pattern formation
3. FIB 50%
4. Light blue = strong support-resistance area (currently resistance)
5. Possible short-term Double TOP formation
Please, don't forget to LIKE, COMMENT & FOLLOW!
Thank You for your support, I really appreciate it!
Have a nice day!
All the best!
*This information is not a recommendation to buy or sell. It is to be used for educational purposes only!
USDJPY Short Setup for this Weeklooking for a pullback on USDJPY then looking for sell setups on the smaller time frame.
if price can hold the 110.000 - 110.500 area we
could possibly see downside from there.

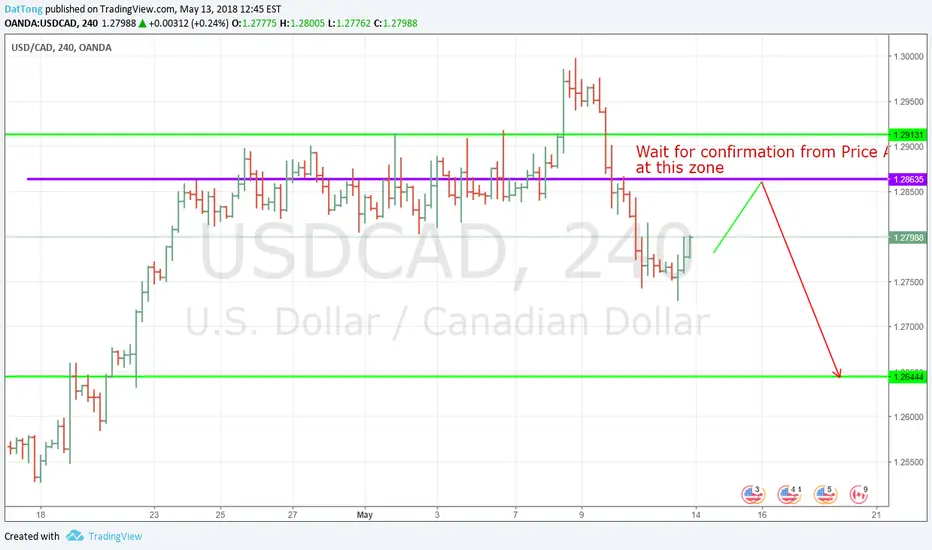
USDCAD - 4H - Sell on Rally- Price is on big downtrend and may continue to follow for one more leg
- Sell when price retrace to the target when there is a clear price action signal at this zone
GBPAUDWatching for short around 50-61.8 fib resistance
I have entered this trade already and for those who wish to follow more I have a telegram where I post daily content
Telegram: t.me

#USDTRY D1 #BUY #LONGRisk Disclaimer: This post is not a trade signal.
Trading Forex is highly speculative and carries a high level of risk. It is possible to lose all your capital. These products may not be suitable for everyone and you should ensure that you understand the risks involved. Seek independent advice if necessary.

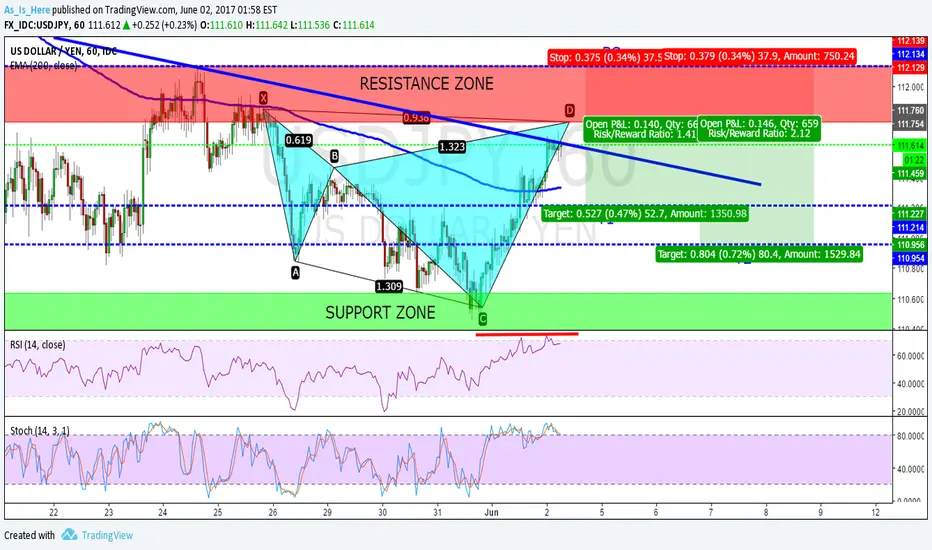
POTENTIONAL BEARISH SHARK PATTERN USD/JPY ON 1H CHARTHello traders,as we look USD/JPY on 1H chart(attached below the daily analysis on USD/JPY) we can see a possible bearish shark pattern as we go reach the red zone of resistance.
We may have a better entry for better P/L ratio trade if price makes a spike with a false breakout above the trend line into the red zone where we have the D completion point.
TECHNICALLY
We can see the downtrnd 200EMA which encourages us to take the short trade.
Currently price is trying to go above the descending trend line.
Maybe it does but for a while as we have already RSI divergence and Stochastic at oversold levels.
POSSIBLE TRADE
FIRST TARGET T1 WITH 1,40 P/L RATIO AT 111,215
SECOND TARGET T2 WITH 2,10 P/L RATIO AT 110,955
BUY STOP AT 112,150
THANKS FOR SUPPORT!
HAPPY TRADING!
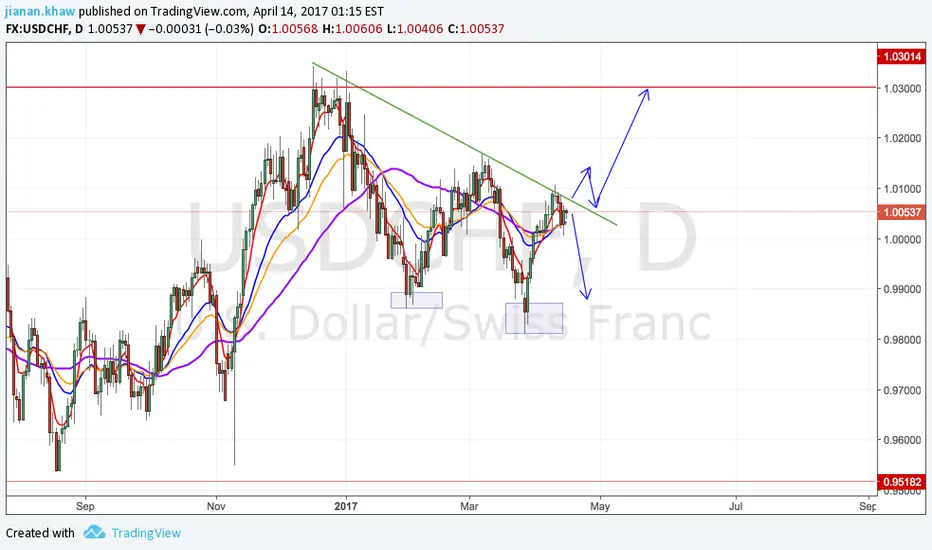
USDCHF Sell Set upHi traders,
I'm having short perspective on this pairing. It is showing a lower high and lower low structure (short term), therefore short on this pairing would be my preference.
SL : 1.0110
TP : 0.9860
If it is broken upward the trend line, then I will look for opportunity to long.
Thanks and have a good day.
**Trade with risk**