GBPUSD in Correction Phase – Potential for a Short OpportunityGBPUSD ( FX:GBPUSD ) is approaching the Support zone($1.286-$1.278) , Support lines and Important Support line .
Regarding Elliott Wave theory , GBPUSD appears to have completed the microwave 5 of the main wave 3 with the help of the Ending Diagonal Pattern and is currently completing the main wave 4 . The main wave 4 is likely to have a Double Three Correction(WXY) .
I expect GBPUSD to decline at least to the Support zone($1.286-$1.278) and Support lines .
Note: If GBPUSD goes above $1.30 we should expect more pumping. The worst Stop Loss(SL) for a SHORT position could be $1.30.
Note: If GBPUSD falls below $1.2760, we should expect more dumping.
Please respect each other's ideas and express them politely if you agree or disagree.
British Pound/U.S. Dollar Analyze (GBPUSD), 4-hour time frame.
Be sure to follow the updated ideas.
Do not forget to put a Stop loss for your positions (For every position you want to open).
Please follow your strategy and updates; this is just my Idea, and I will gladly see your ideas in this post.
Please do not forget the ✅' like '✅ button 🙏😊 & Share it with your friends; thanks, and Trade safe.
Forexsetup

Gold weekly chart should be read the caption Gold continues to correct lower amid the selloff in the US stock market as it tightens financial conditions when it’s this aggressive.
The problem here is that we got weaker economic data with increasing inflation expectations. The market might be fearing that in case we get a slowdown, the Fed might not be fast enough in cutting rates amid inflation remaining above target and uncomfortably high long-term inflation

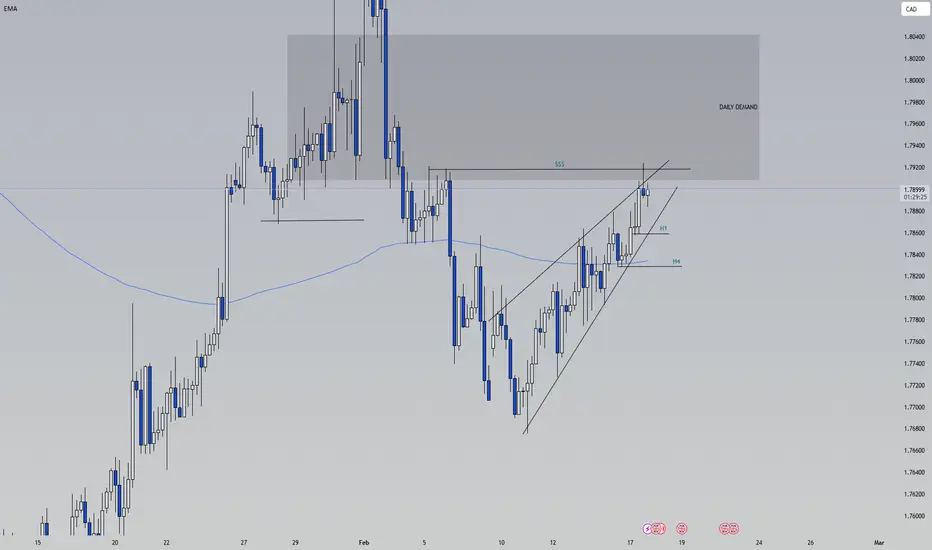
GBP/CAD Potential short opportunity 📉 Price is back into a key supply zone, signaling a potential reversal. Before executing, I’m watching for:
✅ Further confirmation on H1 or H4
✅ A clear Change of Character (CHoCH)
✅ Liquidity sweep to trap early buyers
⚠️ Patience is key! Let the market show its hand before entering. A strong rejection and lower timeframe breakdown could confirm the setup.
📊 What’s your take? Are you seeing the same setup? Drop your thoughts below! 👇
#GBPCAD #ForexTrading #SmartMoney #LiquiditySweep #CHoCH #PriceAction #ForexSetup
XAUUSD Running profit Nice! 120 pips is a solid move. Are you holding for more, or locking in profits.
Tp² hit.

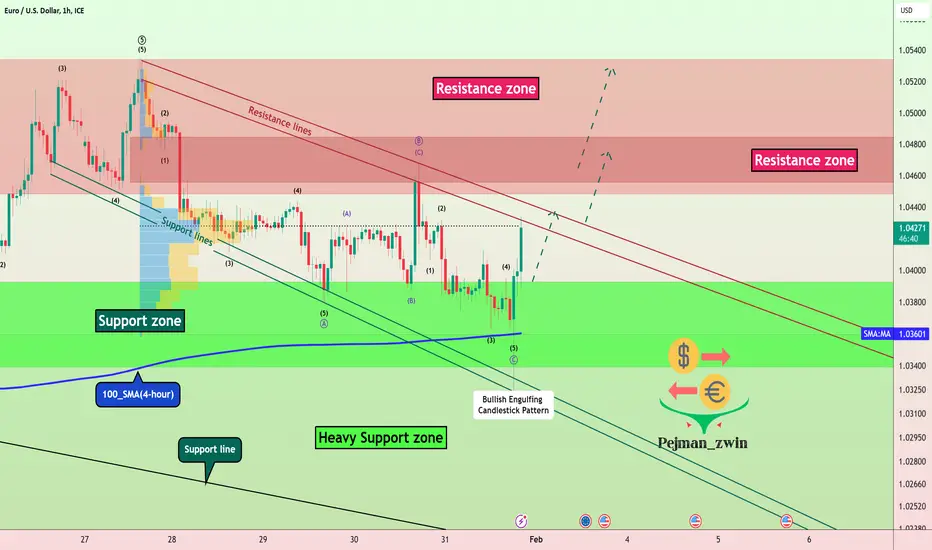
EURUSD Hits Support Zone—Is a Bullish Reversal Coming!!!As I expected , the EURUSD ( FX:EURUSD ) fell to the target I set yesterday.
EURUSD is moving near Support zone($1.039-$1.033) and 100_SMA(4-hour) .
According to the theory of Elliott waves , it seems that the EURUSD has succeeded in completing the corrective Zigzag(ABC/5-3-5) , and we should wait for the EURUSD to rise again. One of the signs of completion can be a Bullish Engulfing Candlestick Pattern with a suitable volume .
I expect EURUSD to rise to Resistance zone($1.0534-$1.0448) after breaking the Resistance lines .
Note: If EURUSD goes below $1.0333, we can expect more dumps .
Please respect each other's ideas and express them politely if you agree or disagree.
Euro/U.S.Dollar Analyze (EURUSD), 1-hour time frame.
Be sure to follow the updated ideas.
Do not forget to put Stop loss for your positions (For every position you want to open).
Please follow your strategy and updates; this is just my Idea, and I will gladly see your ideas in this post.
Please do not forget the ✅' like '✅ button 🙏😊 & Share it with your friends; thanks, and Trade safe.
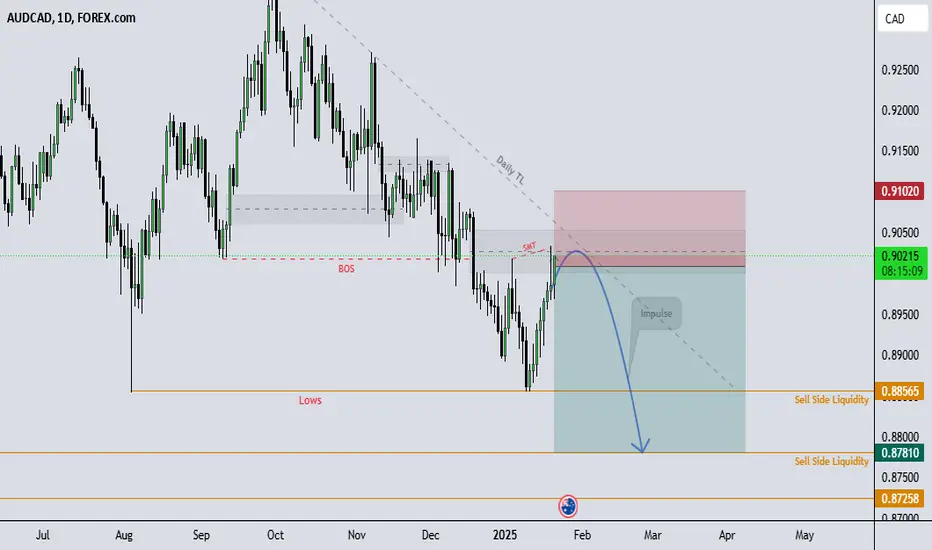
AudCad should follow the trend.Looking for Impulse Down.
AudCad now at Daily FVG area. I am expecting it will follow down trend to take lower liquidity. Make sure you have your own rules on RR and follow them. This is just a trading idea to help you gain better knowledge. If you have any question ask me in comments.
Learn & Earn!
Wave Trader Pro
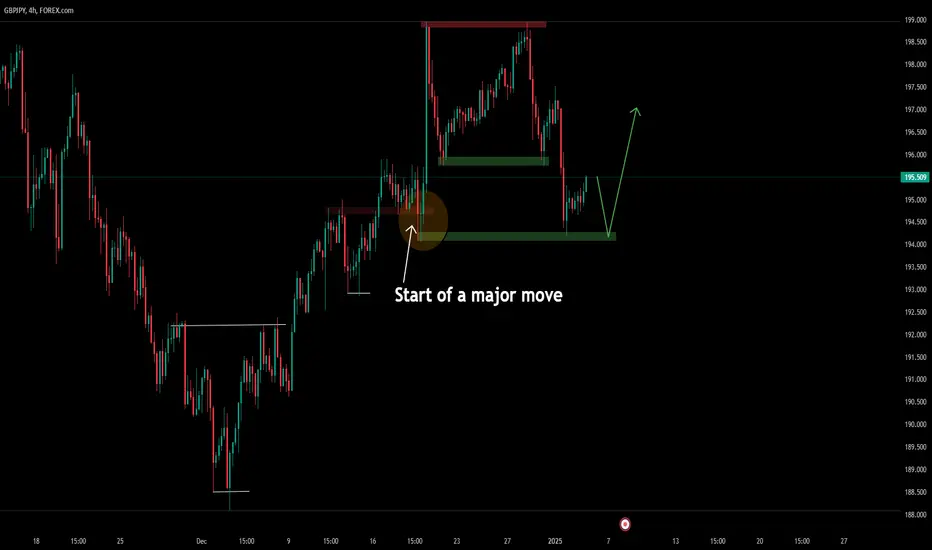
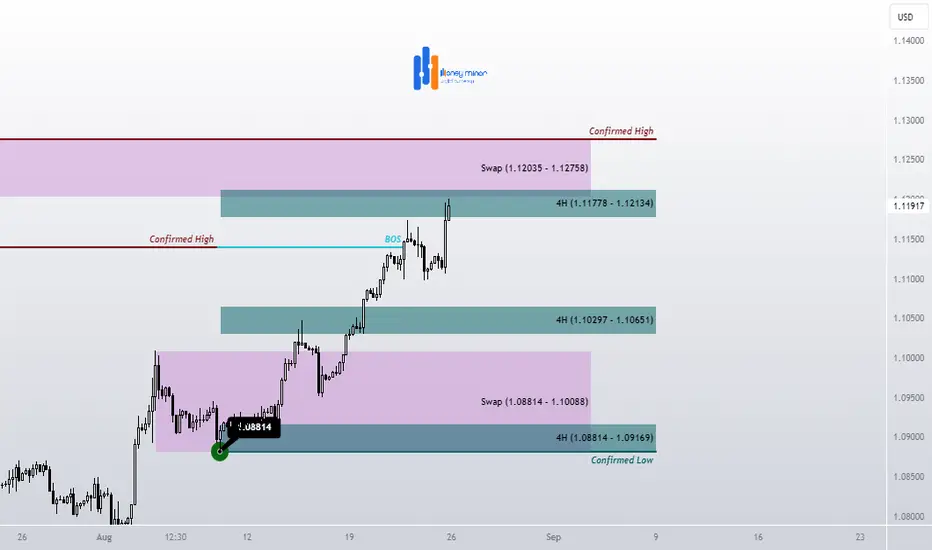
GBP USD Trade Setup Daily Timeframe
On the daily timeframe, GBP USD has broken below a key support level, which has now turned into resistance. and the price is currently rejecting this level.
We will focus on selling opportunities by analyzing the lower timeframes for entry patterns and confirmation.

GBP/USD at Crucial Support: Will It Hold?GBP/USD has broken below the support line and is currently trading near key support levels.
If the price fails to hold these levels, we could see a sharp decline in GBP/USD.

GBPJPY | Long ideaJPY pairs have been going on a bullish ride and I expect it to keep going. I am looking for a drop in the zone (green arrow) before I would be interested in a long position. To be honest I don't even think it is going to get there, it might go flying instead of dropping first.
Anyway, let me know what you think!
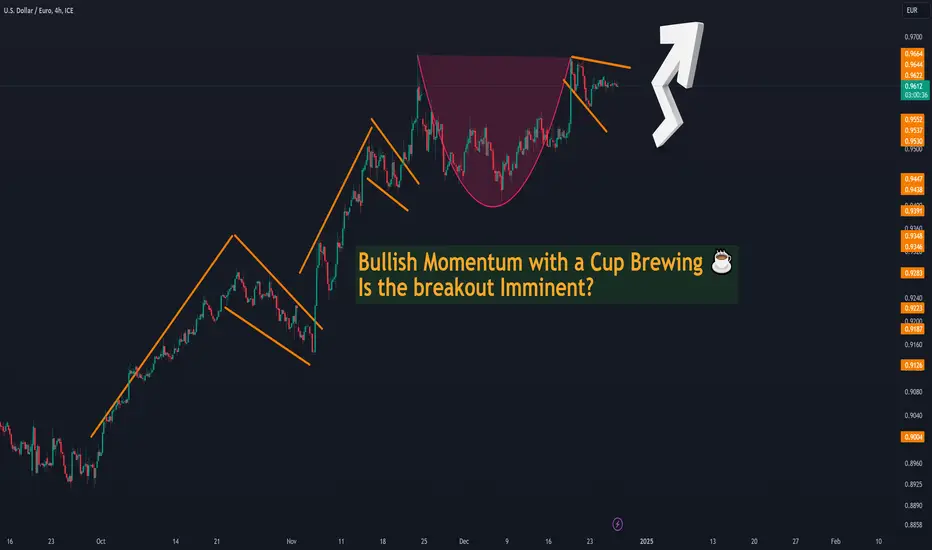
The Market Never Sleeps, and Neither Should Your Edge!Check this out, folks: The chart is looking like a bull’s playground 🐂 with more flags than an Olympic opening ceremony! 🏳️🌈 Let's break it down:
📈 Trend On Fire: Those sharp orange lines? That’s the market saying, “Pullbacks? Sure. But I’m not done climbing!” It’s a stairway to profits, baby! 💸
☕ Cup and Handle Brewing: See that big, juicy magenta cup? 🍵 This chart’s serving up a potential breakout recipe: a little consolidation, a lot of momentum, and maybe a moonshot. 🌕
🤔 But Wait, There’s More: The top triangle is throwing shade like, “I’m running out of steam.” ⚡ Could this be a fakeout before a shakeout? Or just the market catching its breath? Time will tell! ⏳
🎯 Key Levels to Watch:
Breakout above consolidation = 🚀 to new highs.
Failure? It’s time to re-test the base. 🛑
🔥 Remember, the market rewards the prepared, not the hopeful. Stay sharp, stay disciplined, and always trade with an edge. Let’s crush it, fam! 💪
#RoadToAMillion #BullishAF #CupAndHandle #GeorgeKnowsGraphs 🎄✨
Bearish Setup in AUD/USDT: Trendline Support Under PressureAUD/USDT is currently moving in a classical bearish pattern, with the price taking temporary support at the lower trendline.
However, this support appears weak, and it is unlikely to hold for long. A breakdown from this level could lead to further downside momentum.
More bearish movement is expected as the structure remains in favor of sellers.
DYOR, NFA

USD JPY Weekly Usdjpy weekly
✔Breakout and a Retest of trend
✔Rising Wedge
✔Breakout of support on D_TF and Retest,
even though it dropped to about 160pips last week, later went up above previous entry it pretend to Breakout of trend to the up side, I guess news caused that
but all the downside confirmation are still checked.

EURUSDEuro dollar analysis
Daily time frame
In the daily time frame, we have to wait for the price to reach the swap zone, and from there we can enter into purchase transactions after seeing the confirmation.
Gold long will too long read the caption Good Day... And a Tom Terrific Tuesday to you! Well, a PT guy came to the house yesterday, sent by my doctors, to get me strong again... I told the PT that my youngest son was a PT, and he about turned around and left, but then I told him that my son hadn't checked with me, so he was more than welcome to begin... I passed all the tests! I even blew the guy away with my balance! And That, was the highlight of my day! I did sit outside and read again, marking two days in a row of me getting outside... It's the little things that I work toward these days.... Uriah Heap greets me this morning with their 70's anthem song: July Morning... This is the song that I quote the lyrics to the first Pfennig of July

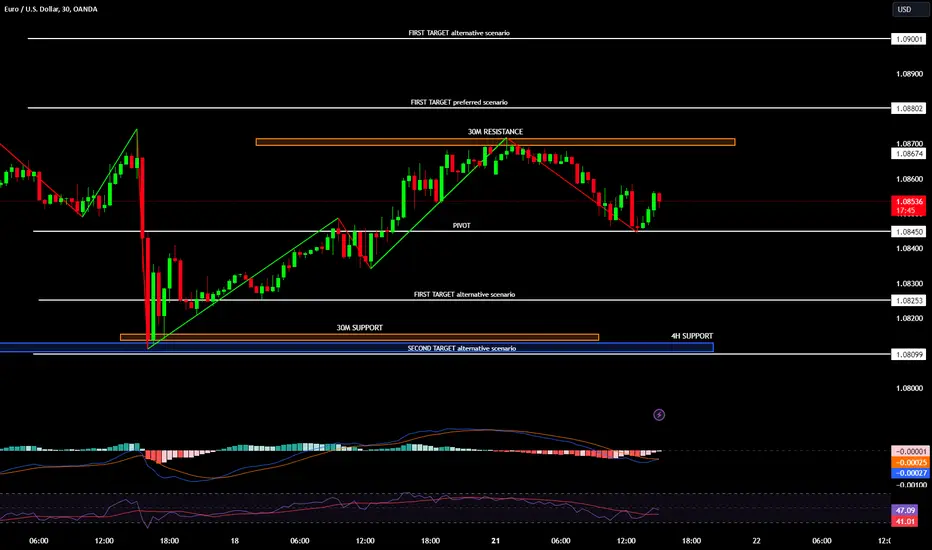
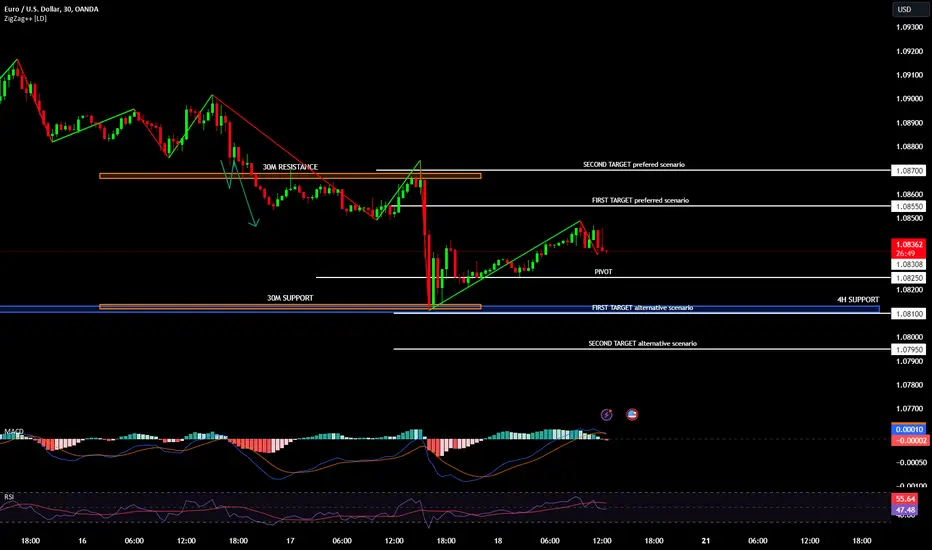
EUR/USD (READ DESCRIPTION)Pivot Point: 1.0845
The pivot at 1.0845 serves as a critical support level for the EUR/USD pair. If the price holds above this level, it signals the potential for further upside movement. The technical outlook suggests a bullish bias as long as this support remains intact.
Our Preference: Long Positions
Recommended Trade:
Long positions are preferred as long as the price remains above the pivot at 1.0845. This suggests that the pair could rally to test higher resistance levels.
Target Levels for Upside Movement:
First Target: 1.0880
This level acts as an intermediate resistance, where traders may consider taking profit or assess the strength of the bullish momentum.
Second Target: 1.0900
If the first resistance at 1.0880 is surpassed, the next target is 1.0900, representing a continuation of the bullish trend.
Alternative Scenario: Downside Risks
If the price drops below 1.0845:
A break below this pivot would open the door to a downside move.
Bearish Outlook:
First Target: 1.0825
Second Target: 1.0810
These levels represent potential areas of support in a bearish scenario, indicating further downward movement.
Technical Insights:
RSI (Relative Strength Index):
The RSI is mixed but holding above its neutral area, signaling a cautious bullish sentiment. If the RSI continues to rise, it could confirm increasing buying interest.
Support Zone Strength:
The 1.0845 level has provided stability, allowing the price to form a base for potential upward movement, increasing the likelihood of a bullish continuation.
Moving Averages:
If EUR/USD rises above key moving averages, such as the 20-period or 50-period, it would provide further confirmation of the bullish scenario. A crossover in these averages may signal a stronger upward trend.
Momentum Indicators:
Indicators like the MACD remain positive, supporting a continuation of the upward momentum. If a bullish crossover occurs, it will likely further solidify the upward trajectory.
EUR/USD Price Analysis: (READ DESCRIPTION)EUR/USD Price Analysis: Potential Short-Term Upside
Pivot Point: 1.0825
This level serves as a key support level that guides near-term price movements.
Market Outlook
Our Preference:
Bullish Scenario: Long positions are recommended above 1.0825, indicating potential upward movement.
Target Levels:
Target 1: 1.0855
Target 2: 1.0870
These levels represent potential profit zones for long positions, should the price maintain above the pivot.
Alternative Scenario
If EUR/USD drops below 1.0825:
Bearish Outlook: Further downside could be expected.
Target Levels:
Target 1: 1.0810
Target 2: 1.0795
This suggests bearish movement if the price falls below the pivot, aiming for lower support areas.
Technical Indicators
RSI (Relative Strength Index): The RSI indicator shows a mixed signal, suggesting traders should exercise caution as the market could experience some volatility.
EUR/USD Breakdown – Quick Bounce or Headed for a Wipeout?Alright, trading family, the EUR/USD pair is riding some choppy waters. A short bounce to 1.0809 might be in the cards, but don’t get too comfy—it could just be a quick breather before we dive back toward 1.0700 or even deeper to 1.0645 or 1.0580.
Key Levels:
Breakdown Zone: 1.0700 – Looks like the next wave if sellers keep control.
Bounce Play: 1.0809 – Bulls might show up, but it could be a short ride.
Lower Support: 1.0645 / 1.0580 – If the tide turns, this is where we might land.
This is one of those "stay ready" moments—either we catch a quick rally or the tide pulls us lower. Keep an eye on those short time frames to catch the next set.
What’s your vibe—are we bouncing or heading straight into the deep? Drop your thoughts, follow, and share if this chart got you set for the next move.
Mindbloome Trader

Eurusd confirm buy trendline read the caption EUR/USD skates on thin ice near the eight-week low of 1.0950 in Wednesday’s European session. The major currency pair stays under pressure as the US Dollar (USD) gathers strength to extend its previous week’s rally further, with the US Dollar Index (DXY) hovering near a seven-week high around 102.60.
The appeal of the US Dollar has strengthened as traders have priced out expectations for the Federal Reserve

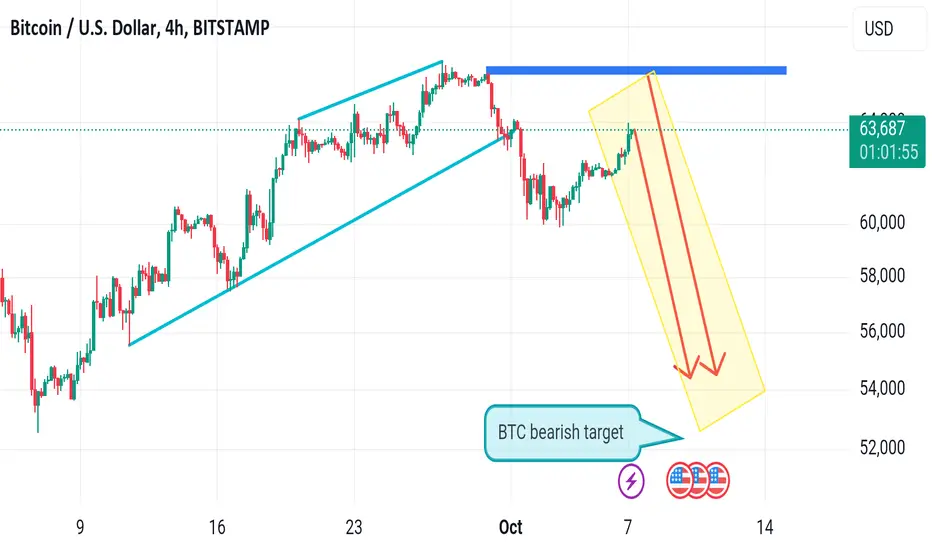
Btc fall badly high volatility read the caption After finding a bottom at $60,700, BTC's performance has left traders somewhat in limbo as they eye $53,000 and $66,000 as two main options for the near future, and as we may see, the bulls are leading the charge as they have managed to take the tug to their side by over 3% so far.
Is another attempt at a new all-time high in play? Based on the recent price action, yes is the more likely answer. However, it is still a long way to go as bulls would first have to defend the weekly close above $60,700, get to $66,001 per BTC and then perhaps hold there for another week
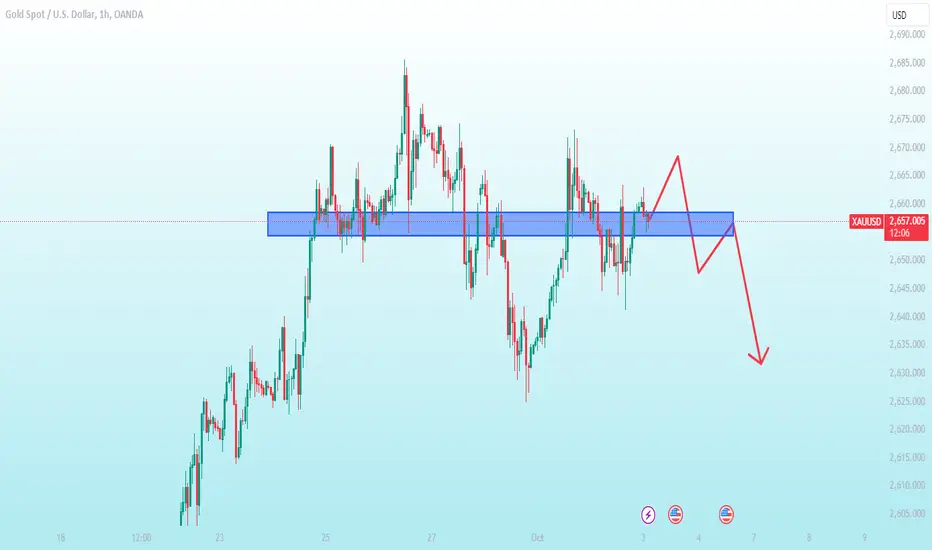
XAU ends up gaining ground for USDWorld gold prices stopped increasing and turned down as the USD strengthened and investors waited for US economic data for more signals about the upcoming interest rate cut by the US Federal Reserve (Fed).
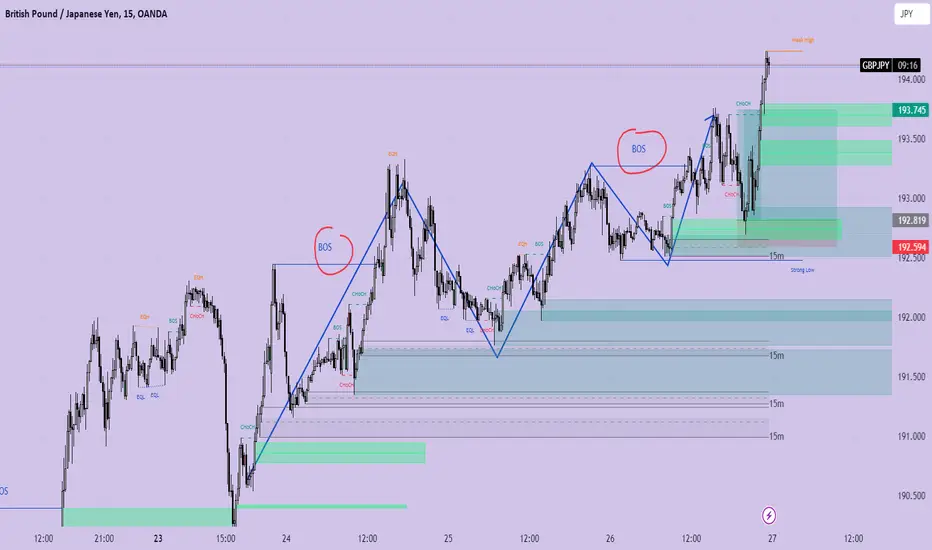
GBPJPY BUY Trade Activated Sept 26 A simple trade using the knowledge of market structure and checking the story from higher TF to lower TF.
As you can see, it is moving in the upward direction. I was waiting for buy trade using my old time buddy lists :) ---> POI ---> IMB, OB, Supply and Demand with validity or proof using BOS --> CHOCH or liquidity grab in the direction of the trend.
This trade was activated by a buy limit order at around N.Y session. Aiming for 4:1 RR :)
#smartmoney
#patience
#characterandiscipline
EURUSDAnalysis of EURUSD 4-hour time frame
The euro has entered its extreme zone and you can enter sales transactions in these zones after seeing the confirmation.
If the ceiling of the area is broken, it will be updated
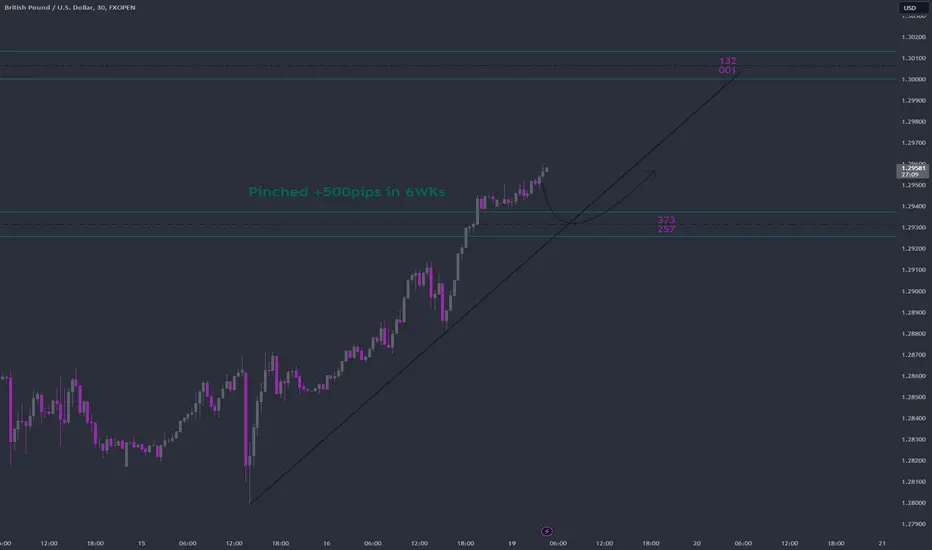
GBPUSD week 34 swing zonesFXOPEN:GBPUSD This week swing zones are marked, with the help of trendline.
Momentum and price action on the 5mins chart is required for trades and tight stops.
6 weeks of Sz has pinched +500pips
The art of trading is Patience.