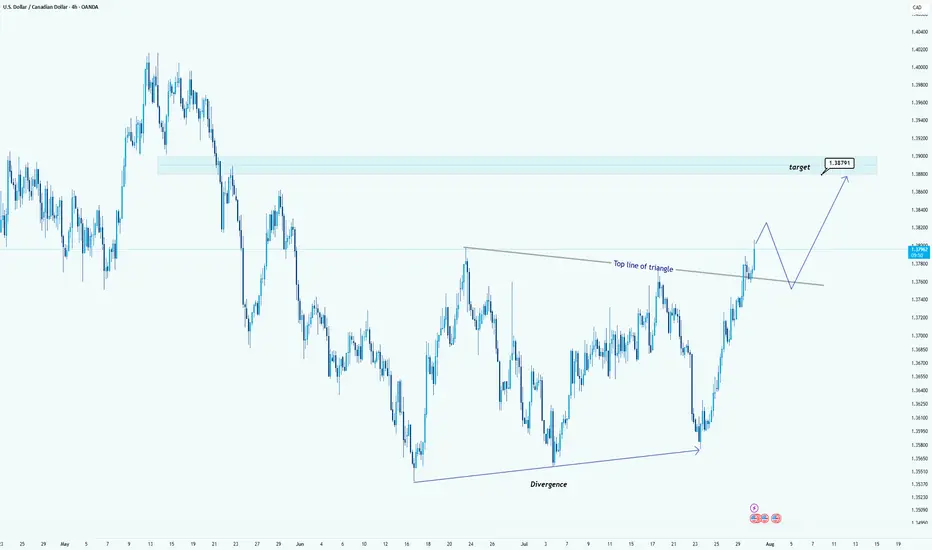
USD/CAD Breaks Triangle: Bullish Target in SightHello guys!
USD/CAD has broken out of a clear triangle formation, signaling strong bullish momentum. The breakout above the top line of the triangle, supported by earlier bullish divergence, confirms that buyers are now in control.
Triangle breakout confirmed
Strong bullish impulse post-breakout
Retest of the broken trendline expected
Target: 1.38791
A clean retest of the breakout level could provide another entry opportunity before price reaches the target zone highlighted in blue.
Forexsignal
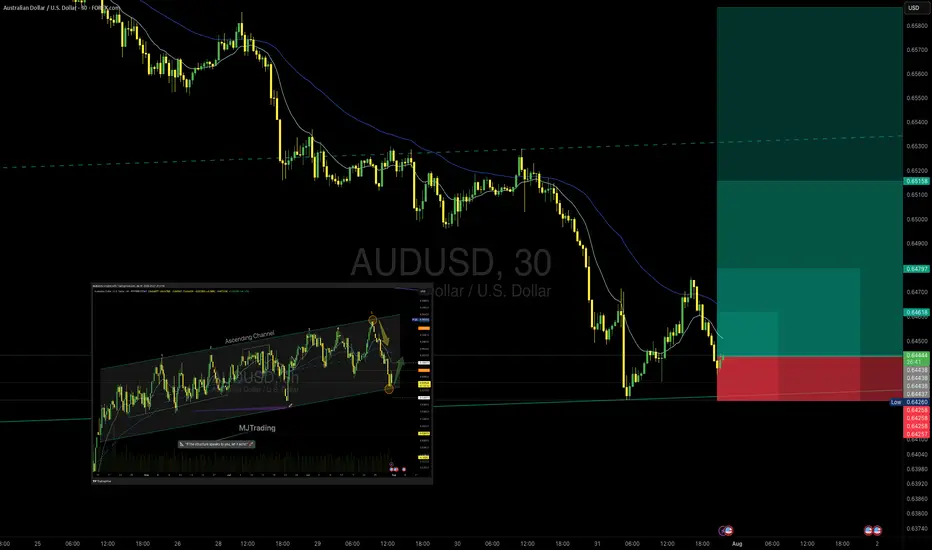
AUD/USD – Potential Bounce Buy SetupOANDA:AUDUSD
Timeframe: 30m
Type: Counter-trend / Bounce from Support
Risk Level: Medium to High
Possible Reward: 4+
🔹 Setup:
Price is testing the lower boundary of the recent support zone (0.6432 – 0.6420), aligning with the previous channel structure visible on the 8h chart. The descending move has shown initial signs of exhaustion, suggesting a potential bounce.
📈 Entry:
Current price zone 0.6432 – 0.6445
🎯 Targets (TP):
TP1: 0.64624
TP2: 0.64797
TP4: 0.65158
⛔ Stop Loss (SL):
0.64250 (below recent swing low and liquidity pool)
8H chart Overview:
Previous Position from top of Channel:
#AUDUSD #Forex #SmartMoney #PriceAction #MJTrading #ChartDesigner
Psychology Always Matters:
NZD/JPY: Bearish Breakdown from Ascending ChannelNZD/JPY has decisively broken below its ascending channel, signaling a shift from bullish structure to bearish momentum. This move aligns with fundamental headwinds for NZD and the potential for JPY strength amid intervention risks and global risk-off sentiment.
Technical Analysis (4H Chart)
Pattern: Breakout from ascending channel support confirms a bearish reversal.
Current Level: 87.12, trading below the broken trendline with strong selling pressure.
Key Support Levels:
86.00 – first bearish target and immediate support zone.
84.60 – extended bearish target if momentum continues.
Resistance Levels:
88.04 – previous support turned resistance.
89.06 – upper boundary and invalidation zone for bearish bias.
Projection: Price is expected to retest 86.00, and if broken, further decline toward 84.60 is likely.
Fundamental Analysis
Bias: Bearish.
Key Fundamentals:
NZD: Pressured by global tariffs and risk-off sentiment.
JPY: Supported by potential FX intervention from Japan’s Ministry of Finance and safe-haven demand.
US Data Impact: Weak NFP boosted Fed cut bets, but risk-off flows strengthen JPY against risk currencies like NZD.
Risks:
China stimulus or a risk-on shift could lift NZD.
Lack of BOJ action may weaken JPY temporarily.
Key Events:
RBNZ policy outlook.
BOJ comments or intervention signals.
US CPI influencing global risk sentiment.
Leader/Lagger Dynamics
NZD/JPY is a lagger, reacting to risk sentiment and JPY moves, with JPY strength leading the pair lower.
Summary: Bias and Watchpoints
NZD/JPY is bearish, with a clear technical break from its ascending channel. The pair targets 86.00 initially and 84.60 on extended downside. Key watchpoints include BOJ FX policy, RBNZ stance, and global risk sentiment, especially if markets move deeper into risk-off mode.

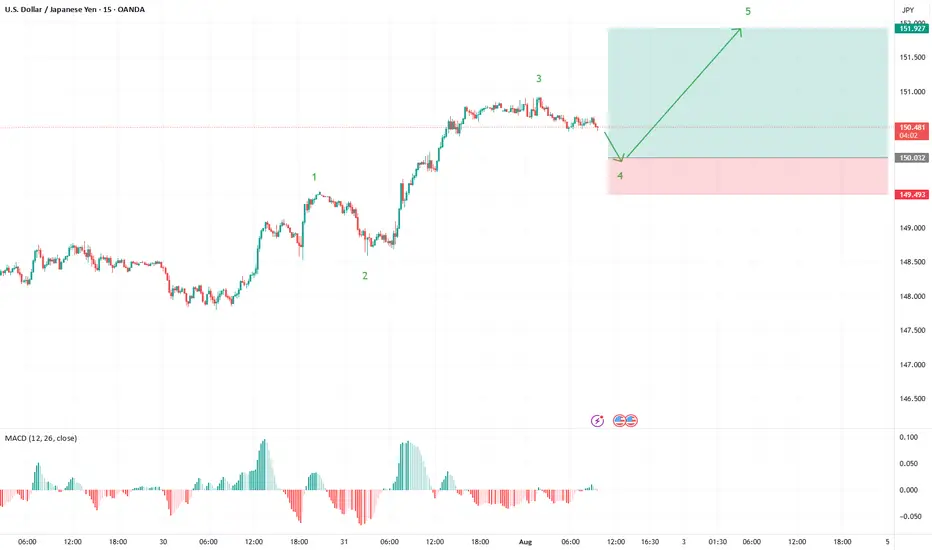
USD/JPY: Fifth Wave Target in SightUSD/JPY is painting a textbook five-wave impulse structure from the recent lows, and we're now positioned for what could be the final act of this motive sequence.
Current Wave Count
✅ Waves 1-3 Complete: Clean impulsive structure with wave 3 showing strong extension
✅ Wave 4 in Progress: Currently correcting from the 150.94 high
🎯 Wave 5 Setup: Targeting completion around 151.95 - 152.20
Key Levels to Watch
Support Zone: 150.00 area (ideal wave 4 retracement)
This aligns with wave principle fourth-wave correction parameters
Provides a healthy pullback without threatening wave 1 overlap
Target: 151.95 - 152.20 zone for wave 5 completion
Classic 5 vs 1+3 projection
Trade Strategy
Monitor for supportive price action near 150.00
Look for an impulsive price action to confirm wave 5 beginning
Structure suggests one more leg higher before a larger correction
The beauty of Elliott Wave: when the count is this clean, the roadmap becomes crystal clear. Let's see if USD/JPY delivers this final push to complete the sequence.
USD/ CAD Are We Heading to $1.46 Territory Watch OUT Afternoon Trading Family
Based on what we are seeing is a nice bullish run up to the following levels :
Levels To Watch For:
1) $1.39
2) $1.41
3) $1.43
4) $1.46
However be aware if we for whatever reason we sink back into the 1.35 territory then we could see a drop down to 1.34
Trade Smarter Live Better
Kris

AUD/USD ANALYSIS: WHERE ARE WE HEADED Good afternoon
Based on what we are saeeing with AUD/USD we see two options
1) Below .645 low then we can see a decent drop down to .635
2) If we can break the highs of .652 then a drive up to .65951 makes sense
Trade Smarter Live Better
Kris

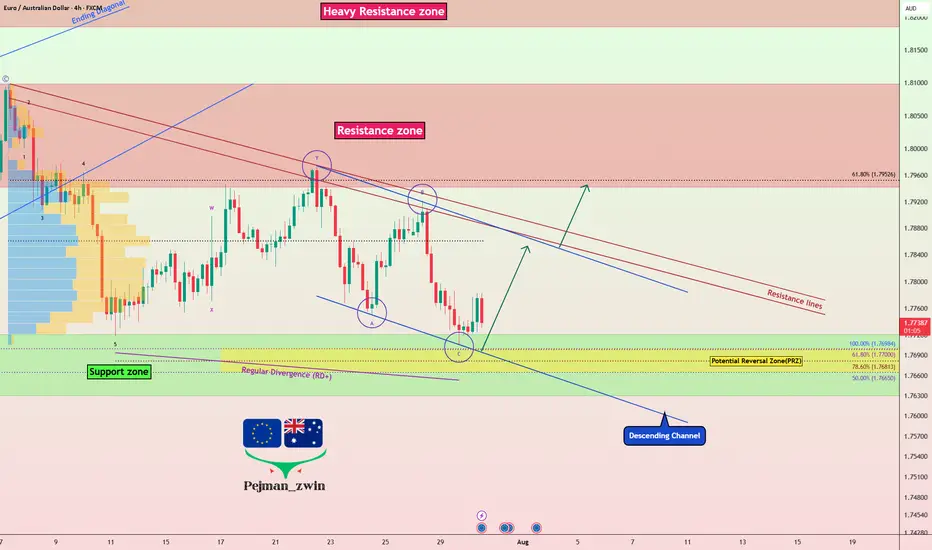
EURAUD Ready to Bounce? Key Support & Fundamentals Aligned!Today I want to share a Long position idea on EURAUD ( OANDA:EURAUD ) with you.
From a fundamental perspective , both the Euro (EUR) and Australian Dollar (AUD) are currently under pressure. However, the Aussie appears fundamentally weaker in the short term, making the EURAUD Long setup more favorable at this stage.
AUD Weakness :
The Reserve Bank of Australia (RBA) has held rates steady at 3.85%, but recent inflation data has dropped to 2.7%, the lowest in over 3 years.
Most economists now expect the RBA to cut rates in its next meeting in August, possibly by 25 basis points.
Slowing economic growth and dovish forward guidance from the central bank are weighing heavily on AUD sentiment.
EUR Outlook :
The European Central Bank (ECB) is also facing weak economic data, but is taking a more cautious approach toward cutting rates.
Despite softer PMIs and sluggish growth in countries like Germany and France, the ECB has not confirmed a near-term rate cut, keeping EUR relatively stable.
This divergence between the RBA’s dovish stance and the ECB’s pause is supportive of EUR strength against AUD.
Summary :
With the RBA likely to ease policy soon and the ECB holding ground for now, the interest rate differential favors EURAUD upside. Fundamentals point toward further weakness in AUD, making the EURAUD Long a strategically sound trade idea for the coming days.
-------------------------------------------
Now let's analyze the conditions of the EURAUD chart on the 4-hour time frame .
EURAUD is currently trading near the Support zone(1.772 AUD-1.763 AUD) , Potential Reversal Zone(PRZ) , and near the lower line of the descending channel .
According to Elliott Wave theory , EURAUD appears to have completed a Zigzag Correction(ABC/5-3-5) .
Also, we can see the Regular Divergence(RD+) between Consecutive Valleys .
I expect EURAUD to rise to at least 1.784 AUD .
Second Target: 1.792 AUD
Note: Stop Loss(SL): 1.762 AUD
Please respect each other's ideas and express them politely if you agree or disagree.
Euro/Australian Dollar Analyze (EURAUD), 4-hour time frame.
Be sure to follow the updated ideas.
Do not forget to put a Stop loss for your positions (For every position you want to open).
Please follow your strategy and updates; this is just my Idea, and I will gladly see your ideas in this post.
Please do not forget the ✅' like '✅ button 🙏😊 & Share it with your friends; thanks, and Trade safe.
Gold (XAU/USD) in Symmetrical Triangle – Short‑Term Squeeze,Price Structure & Technical Setup
Gold is consolidating within a symmetrical triangle, showing lower highs and higher lows—a classic precursor to breakout in either direction
Fxglory Ltd
+5
TradingView
+5
Babypips.com
+5
TradingView
+2
Babypips.com
+2
TradingView
+2
.
Trendlines converge tightly around $3,326–$3,334, hinting at imminent directional acceleration
Investopedia
+4
TradingView
+4
TradingView
+4
.
🎯 Key Levels & Targets
Scenario Trigger Confirm Area Targets Stop Loss
Bullish Breakout above $3,344–$3,350 $3,369 → $3,396 → $3,422–$3,550 ~$3,340
Bearish Breakdown below ~$3,326–$3,320 $3,320 → $3,300 → $3,297 → $3,255 ~$3,335–$3,340
A breakout above $3,344–$3,350 validated with volume may drive prices toward $3,400+, with extended targets up to $3,550 or higher in bullish conditions
Traders Union
Time Price Research
.
A drop below $3,326–$3,320 risks further decline, targeting $3,300, $3,297, and eventually $3,255 if breakdown momentum builds .
📉 Market Context & Drivers
U.S. dollar strength, easing safe-haven demand, and optimistic trade sentiment are constraining gold’s upside unless breakout forces emerge .
Key upcoming catalysts: FOMC guidance, U.S. macro data (GDP, inflation), and geopolitical developments—their tone could tip the bias direction .
⚙️ Trade Rules & Risk Management
Wait for a confirmed breakout or breakdown—do not trade mid-range.
Confirm break with at least one close outside the triangle and rising volume .
Position sizing: Risk 1–2% per trade, adjust stop-loss to price structure ($8–$15 depending on volatility).
Take profits in stages: scale out at minor milestones (first targets), trail stop for extended targets.
Avoid chasing price within the middle of the triangle—risk/reward is unfavorable.
🧠 Why This Plan?
Follows textbook symmetrical triangle trading methodology: entry on breakout, stop beyond pattern opposite side, projection based on triangle height .
Aligns with broader outlook: bearish unless convincing upside breakout appears, consistent with analyst consensus hedging current bull exhaustion and wait‑and‑see on policy signals .
✅ Summary
Gold is coiling inside a tight triangle range near $3,326–$3,334, with breakout potential identified to either side:
Bullish breakout over $3,344–$3,350 targets up to $3,550 or beyond.
Bearish breakdown under $3,326–$3,320 risks slide towards $3,300–$3,255.
Wait for confirmation, apply disciplined risk controls, and let volume validate the move.

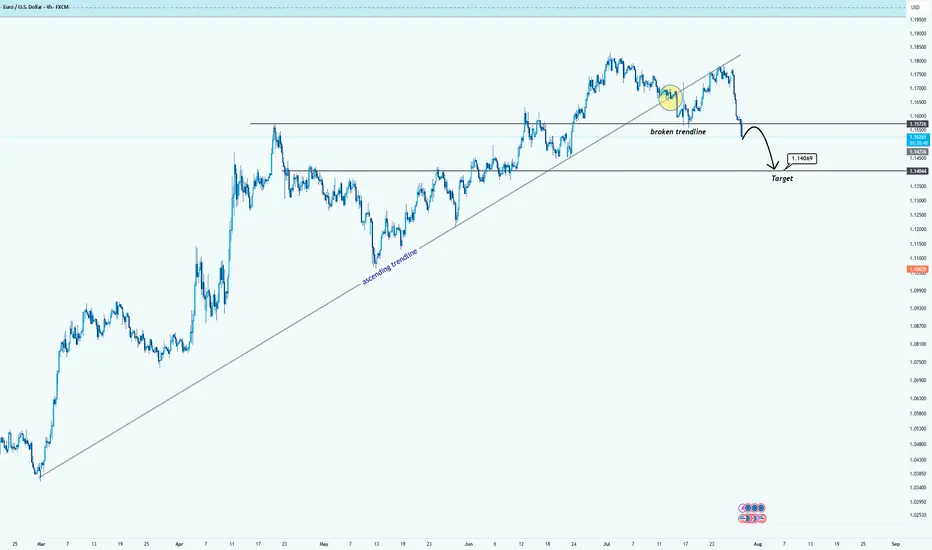
EURUSD Breaks Trendline: Bearish Momentum in PlayHello guys!
After months of climbing steadily along the ascending trendline, EURUSD has finally broken below support. The trendline breach, followed by a tight consolidation (yellow circle), hinted at a loss of bullish strength, and now the breakdown is in full motion.
Broken ascending trendline
Clear rejection after retest
Bearish continuation underway
Target area: 1.1400–1.1440 zone
If sellers maintain control, the price could descend toward the next major demand area.
USDJPY – DAILY FORECAST Q3 | W31 | D30 | Y25📊 USDJPY – DAILY FORECAST
Q3 | W31 | D30 | Y25
Daily Forecast 🔍📅
Here’s a short diagnosis of the current chart setup 🧠📈
Higher time frame order blocks have been identified — these are our patient points of interest 🎯🧭.
It’s crucial to wait for a confirmed break of structure 🧱✅ before forming a directional bias.
This keeps us disciplined and aligned with what price action is truly telling us.
📈 Risk Management Protocols
🔑 Core principles:
Max 1% risk per trade
Only execute at pre-identified levels
Use alerts, not emotion
Stick to your RR plan — minimum 1:2
🧠 You’re not paid for how many trades you take, you’re paid for how well you manage risk.
🧠 Weekly FRGNT Insight
"Trade what the market gives, not what your ego wants."
Stay mechanical. Stay focused. Let the probabilities work.
FX:USDJPY

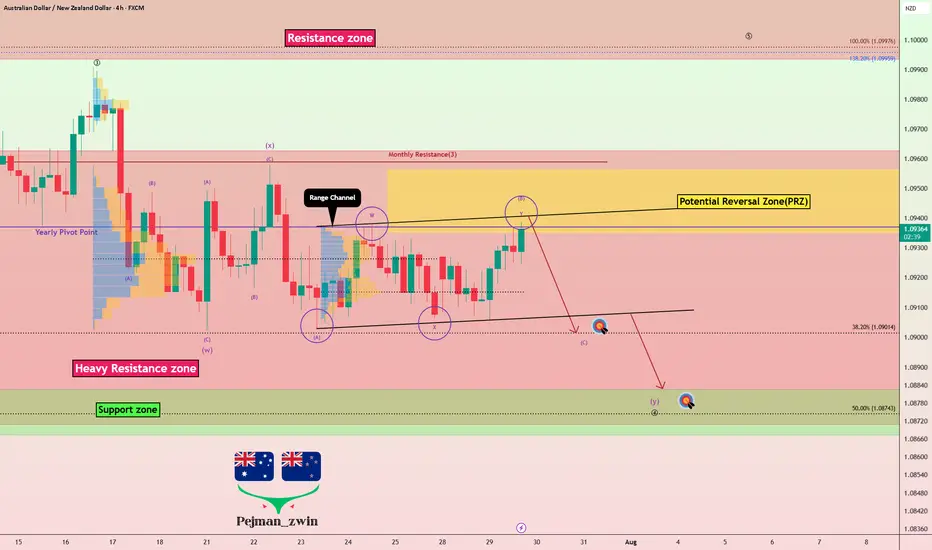
AUDNZD Technical + Fundamental Align for DownsideToday I want to analyze a short position on the AUDNZD ( OANDA:AUDNZD ) pair, first, let's look at it from a fundamental analysis perspective .
Fundamental View on AUDNZD
Key reasons to short AUDNZD:
Australian weakness:
Recent data show weakening consumer sentiment and declining building approvals. The RBA seems hesitant to hike further, putting pressure on the Aussie.
New Zealand resilience:
The RBNZ maintains a relatively hawkish stance. Inflation is still a concern, and the central bank is committed to keeping rates high, supporting NZD strength.
Monetary policy divergence:
The divergence between RBA’s dovish stance and RBNZ’s hawkish approach supports further downside in AUDNZD.
----------------------
Now let's take a look at AUDNZD from a technical analysis perspective on the 4-hour timeframe .
AUDNZD is currently trading in a Heavy Resistance zone(1.0963 NZD-1.0870 NZD) near the upper line of the Range Channel , Potential Reversal Zone(PRZ) and Yearly Pivot Point .
In terms of Elliott Wave theory , AUDNZD appears to be completing microwave B of microwave Y of the main wave 4 .
I expect AUDNZD to drop to at least 1.0904 NZD(First Target) based on the above explanation .
Second Target: 1.0886 NZD
Note: Stop Loss(SL): 1.0963 NZD
Please respect each other's ideas and express them politely if you agree or disagree.
Australian Dollar/New Zealand Dollar Analyze (AUDNZD), 4-hour time frame.
Be sure to follow the updated ideas.
Do not forget to put a Stop loss for your positions (For every position you want to open).
Please follow your strategy and updates; this is just my Idea, and I will gladly see your ideas in this post.
Please do not forget the ✅' like '✅ button 🙏😊 & Share it with your friends; thanks, and Trade safe.
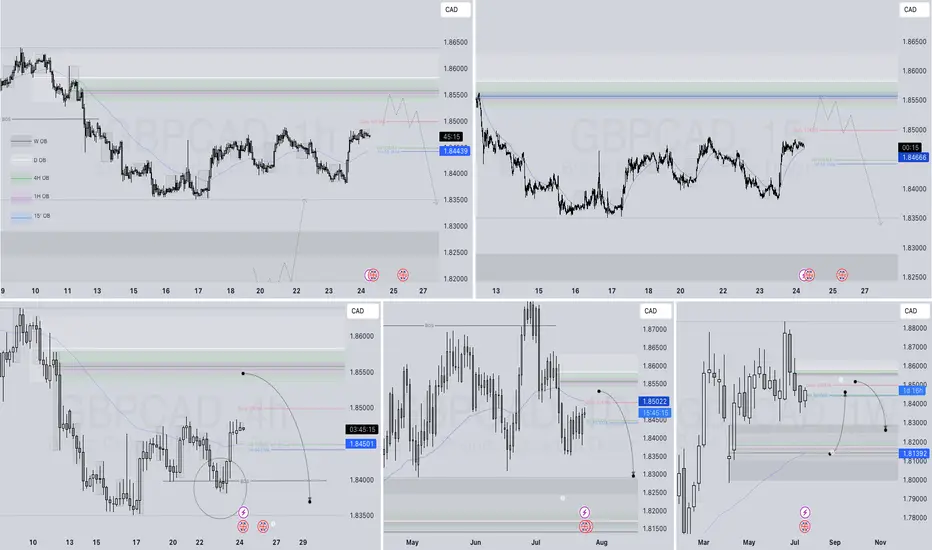
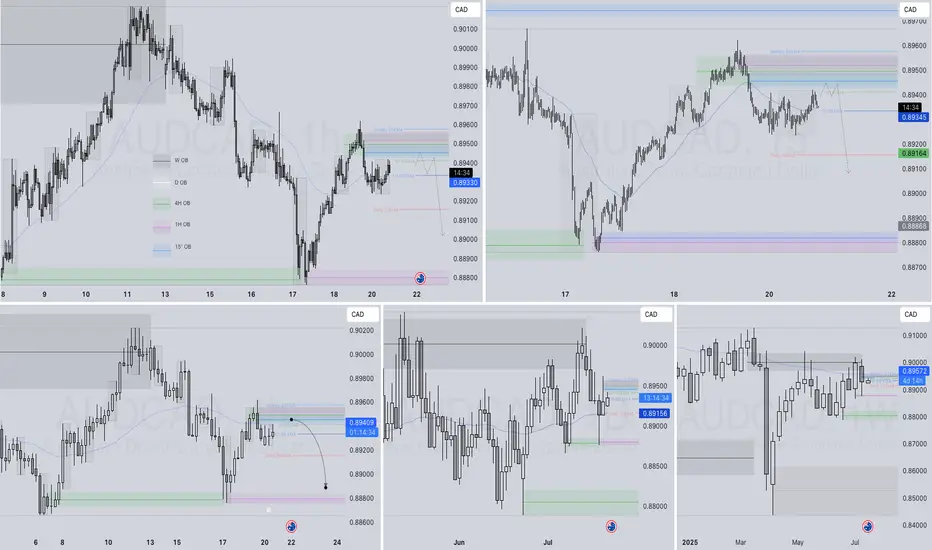
AUDCAD – DAILY FORECAST Q3 | W31 | D30 | Y25
📊 AUDCAD – DAILY FORECAST
Q3 | W31 | D30 | Y25
Daily Forecast 🔍📅
Here’s a short diagnosis of the current chart setup 🧠📈
Higher time frame order blocks have been identified — these are our patient points of interest 🎯🧭.
It’s crucial to wait for a confirmed break of structure 🧱✅ before forming a directional bias.
This keeps us disciplined and aligned with what price action is truly telling us.
📈 Risk Management Protocols
🔑 Core principles:
Max 1% risk per trade
Only execute at pre-identified levels
Use alerts, not emotion
Stick to your RR plan — minimum 1:2
🧠 You’re not paid for how many trades you take, you’re paid for how well you manage risk.
🧠 Weekly FRGNT Insight
"Trade what the market gives, not what your ego wants."
Stay mechanical. Stay focused. Let the probabilities work.
FX:AUDCAD

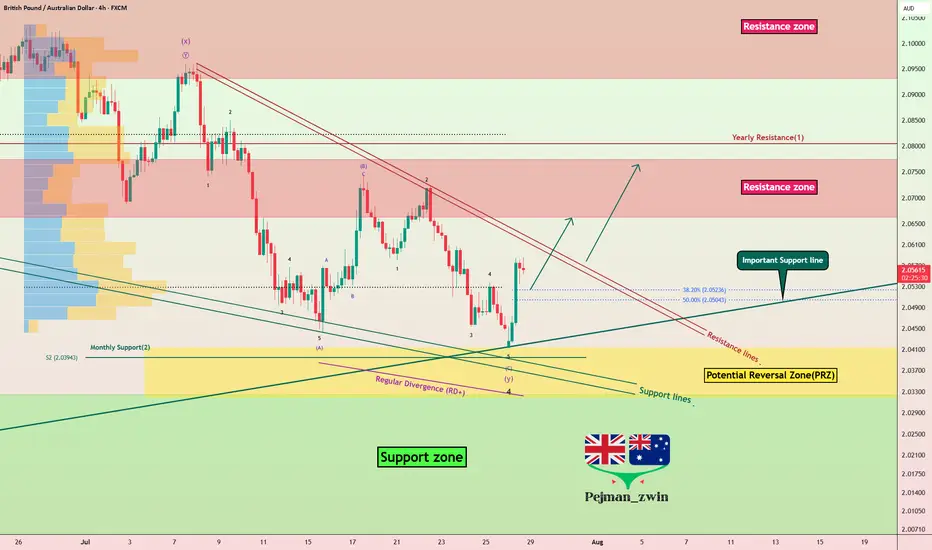
GBPAUD Reverses from Key Zone – Long Setup in Play!Today I want to share with you a Long position on GBPAUD ( OANDA:GBPAUD ).
GBPAUD started to rise well from the Important Support line , Support zone(2.032 AUD-1.987 AUD) , and Potential Reversal Zone(PRZ) and managed to close the 4-hour candle above 2.053 AUD (important) .
In terms of Elliott wave theory , GBPAUD seems to have completed the main wave 4 . The main wave 4 structure was a Double Three Correction(WXY) .
Also, along the way, we can see a Bullish Marubozu candle , which could indicate a continuation of the uptrend .
I expect GBPAUD to break the Resistance lines soon and attack the Resistance zone(2.078 AUD-2.066 AUD) .
First Target: 2.065 AUD
Second Target: 2.076 AUD
Note: Stop Loss(SL): 2.040 =Worst SL
Please respect each other's ideas and express them politely if you agree or disagree.
British Pound/ Australian Dollar Analyze (GBPAUD), 4-hour time frame.
Be sure to follow the updated ideas.
Do not forget to put a Stop loss for your positions (For every position you want to open).
Please follow your strategy and updates; this is just my Idea, and I will gladly see your ideas in this post.
Please do not forget the ✅' like '✅ button 🙏😊 & Share it with your friends; thanks, and Trade safe.
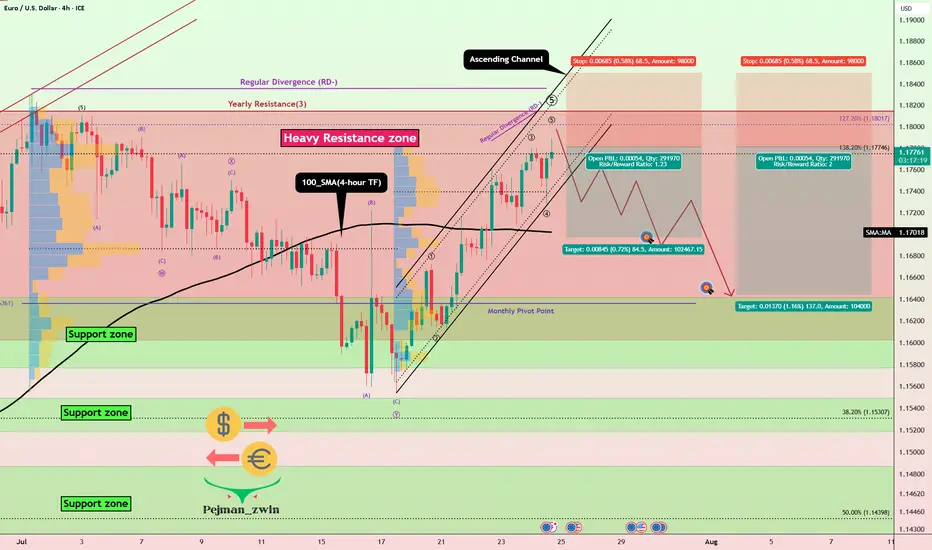
EURUSD at Make-or-Break Zone: Time to Short?EURUSD – Key Data Out Today, Short Setup Confirmed?
Today, several important economic indexes were released for both the Euro(EUR) and the Dollar(USD) . Let’s break them down in a simple way:
Eurozone PMI Data: Mixed to Weak
France:
Manufacturing PMI: 48.4 (slightly lower than forecast)
Services PMI : 49.7 (flat, but below 50 = contraction)
Germany:
Manufacturing PMI: 49.2 (weaker than expected)
Services PMI : 50.1(slightly expansionary)
Eurozone Overall:
Manufacturing PMI: 49.8 (still below 50)
Services PMI : 51.2 (slightly stronger than forecast)
ECB left the Main Refinancing Rate unchanged at 2.15% , which was widely expected.
U.S. Data( TVC:DXY ): Strong and Surprising
Unemployment Claims: 217K (better than expected 227K)
Manufacturing PMI: 49.5 (below forecast of 52.7 – a negative surprise)
Services PMI: 55.2 (well above forecast and previous – bullish for USD)
Interpretation :
The Eurozone's growth remains sluggish, especially in France and Germany.
Despite a drop in U.S. manufacturing, the services sector remains strong, and unemployment data confirms labor market resilience.
This mixed picture slightly tilts the balance in favor of the U.S. dollar, especially as the ECB remains on hold while the Fed may still consider being restrictive.
Bias: Short EURUSD ( FX:EURUSD )
Fundamentals support a Short position in EURUSD, in line with the current technical setup.
---------------------------------
Now let's take a look at the EURUSD chart on the 4-hour time frame to find the best Short position .
EURUSD is currently trading in an Ascending Channel and at a Heavy Resistance zone($1.1845-$1.1602) .
Also, in terms of Elliott wave theory , it seems that EURUSD is completing a microwave 5 of the main wave 5 .
One of the most important supports ahead for EURUSD could be the 100_SMA(4-hour TF) .
If the currently 4-hour candlestick forms a Shooting Star Candlestick Pattern , it is a better sign for EURUSD to fall .
Also, we can see the Regular Divergence(RD-) between Consecutive Peaks .
I expect EURUSD to decline to at least $1.169 AFTER breaking the lower line of the ascending channel .
Second Target: Support zone($1.1642-$1.158) and Monthly Pivot Point.
Note: Stop Loss(SL)= $1.1850
Please respect each other's ideas and express them politely if you agree or disagree.
Euro/U.S. Dollar Analyze (EURUSD), 4-hour time frame.
Be sure to follow the updated ideas.
Do not forget to put a Stop loss for your positions (For every position you want to open).
Please follow your strategy and updates; this is just my Idea, and I will gladly see your ideas in this post.
Please do not forget the ✅' like '✅ button 🙏😊 & Share it with your friends; thanks, and Trade safe.
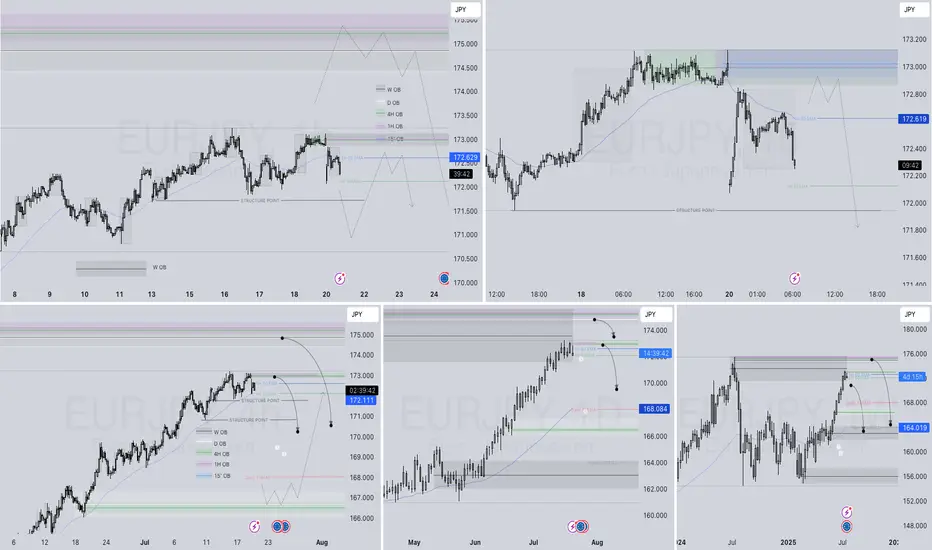
EURJPY – WEEKLY FORECAST Q3 | W31 | Y25📊 EURJPY – WEEKLY FORECAST
Q3 | W31 | Y25
Weekly Forecast 🔍📅
Here’s a short diagnosis of the current chart setup 🧠📈
Higher time frame order blocks have been identified — these are our patient points of interest 🎯🧭.
It’s crucial to wait for a confirmed break of structure 🧱✅ before forming a directional bias.
This keeps us disciplined and aligned with what price action is truly telling us.
📈 Risk Management Protocols
🔑 Core principles:
Max 1% risk per trade
Only execute at pre-identified levels
Use alerts, not emotion
Stick to your RR plan — minimum 1:2
🧠 You’re not paid for how many trades you take, you’re paid for how well you manage risk.
🧠 Weekly FRGNT Insight
"Trade what the market gives, not what your ego wants."
Stay mechanical. Stay focused. Let the probabilities work.
OANDA:EURJPY
AUD/USD Sell SetupOANDA:AUDUSD
Timeframe: m30
Entry: 0.66151
SL: 0.66266
TP1: 0.66033
TP2: 0.65914
TP4: 0.65681
📊 Setup Rationale
🔺 Channel Top Rejection (8H Overlay) Price has touched the upper boundary of a descending channel visible on the 8-hour chart. This zone has historically acted as a strong resistance, increasing the probability of a reversal.
🧱 Local Structure (30min) Entry aligns with a minor double top (in lower TFs) and bearish momentum. The tight SL allows for a high R:R profile.
🔄 Momentum Shift Watch for bearish engulfing or rejection wick on lower timeframes to confirm entry.
#MJTrading #Forex #AUDUSD #Sell
Psychology always matters:
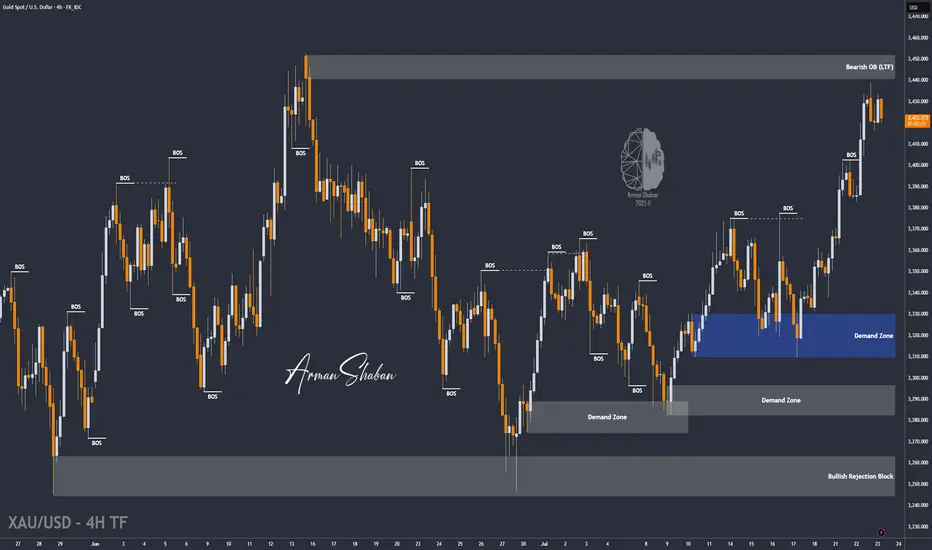
XAU/USD | Watching for Potential Drop Toward $3391! (READ)By analyzing the gold chart on the 4-hour timeframe, we can see that gold continued its bullish move after holding above $3409, successfully hitting the $3440 target and delivering over 200 pips in returns! After reaching this key supply zone, gold corrected down to $3415 and is now trading around $3421. If the price stabilizes below $3431, we can expect further downside movement, with the next bearish targets at $3415, $3404, and $3391. If this scenario fails, an alternative setup will be shared.
Please support me with your likes and comments to motivate me to share more analysis with you and share your opinion about the possible trend of this chart with me !
Best Regards , Arman Shaban
GBPCAD Q3 | D24 | W30 | Y25📊GBPCAD Q3 | D24 | W30 | Y25
Daily Forecast🔍📅
Here’s a short diagnosis of the current chart setup 🧠📈
Higher time frame order blocks have been identified — these are our patient points of interest 🎯🧭.
It’s crucial to wait for a confirmed break of structure 🧱✅ before forming a directional bias.
This keeps us disciplined and aligned with what price action is truly telling us.
📈 Risk Management Protocols
🔑 Core principles:
Max 1% risk per trade
Only execute at pre-identified levels
Use alerts, not emotion
Stick to your RR plan — minimum 1:2
🧠 You’re not paid for how many trades you take, you’re paid for how well you manage risk.
🧠 Weekly FRGNT Insight
"Trade what the market gives, not what your ego wants."
Stay mechanical. Stay focused. Let the probabilities work.
FRGNT
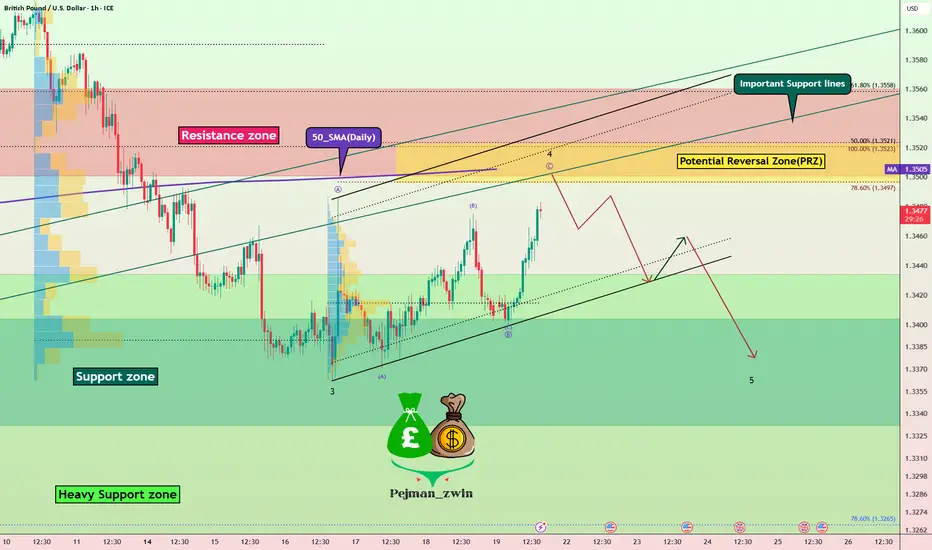
Short Opportunity on GBPUSD – Technical & Fundamentals AlignToday I want to look at the Short position opportunity in GBPUSD ( FX:GBPUSD ). So let's take a look at the GBPUSD pair from a fundamental and technical perspective.
Fundamental Analysis:
The British Pound remains under pressure due to growing expectations of a 25–50 bps rate cut by the Bank of England in early August. Markets are increasingly leaning toward easing as UK inflation hit 3.6% in June, the highest in over a year, while economic growth weakened and consumer confidence dropped to its lowest since early 2024
Ongoing fiscal concerns, including potential tax hikes and budget instability, continue to weigh on the pound. In contrast, the US Dollar( TVC:DXY ) remains relatively robust—supported by strong economic data and a safe-haven preference amid global uncertainty
Summary:
BoE easing becomes more likely due to weak UK data and inflation.
Fiscal risks and low consumer sentiment add downward pressure on GBP.
USD strength from solid data and safe-haven demand supports further GBPUSD downside.
-------------------------
In terms of technical analysis , in the 1-hour timeframe , GBPUSD is approaching the Resistance zone($1.356-$1.350) , the Potential Reversal Zone(PRZ) , and the 50_SMA(Daily) . Meanwhile, this return to Important Support lines could act as a pullback to these lines. Important support lines and 50_SMA(Daily) were broken last week.
In terms of Elliott Wave theory , GBPUSD appears to be completing a main wave 4 . Main wave 4 is likely to have a Zigzag Correction(ABC/5-3-5) .
I expect GBPUSD to start declining from the Potential Reversal Zone(PRZ) and reach the targets I have marked on the chart.
Note: Stop Loss(SL): 1.3575USD = Worst Stop Loss(SL)
Please respect each other's ideas and express them politely if you agree or disagree.
British Pound / U.S Dollar Analysis (GBPUSD), 1-hour time frame.
Be sure to follow the updated ideas.
Do not forget to put a Stop loss for your positions (For every position you want to open).
Please follow your strategy and updates; this is just my Idea, and I will gladly see your ideas in this post.
Please do not forget the ✅' like '✅ button 🙏😊 & Share it with your friends; thanks, and Trade safe.
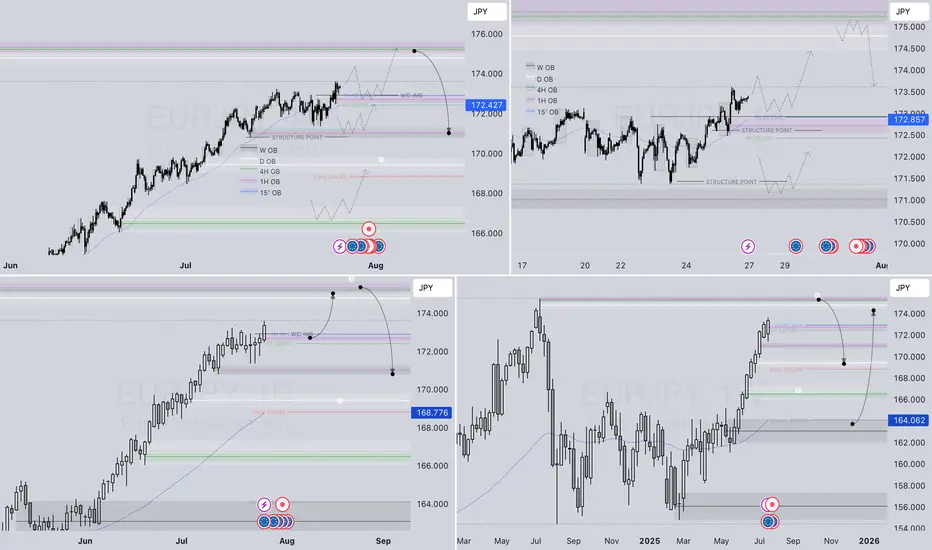
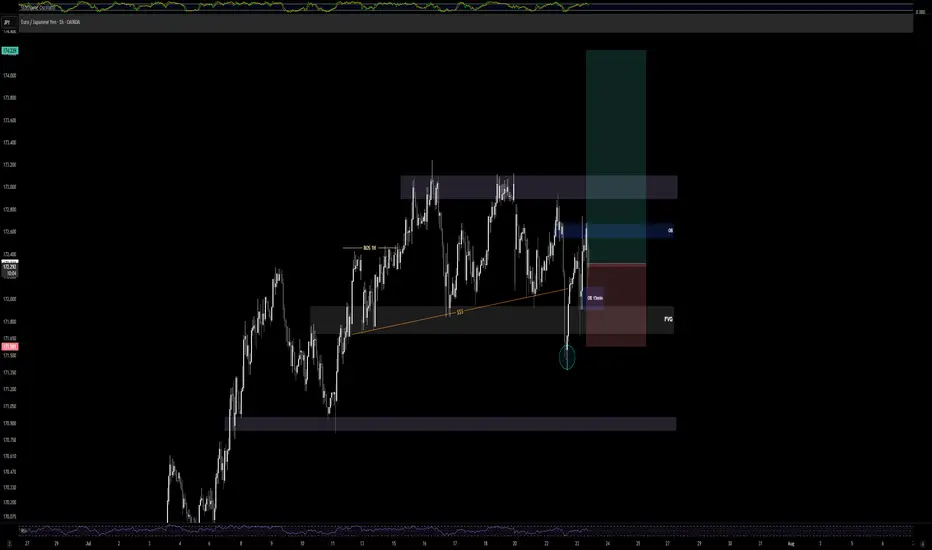
EUR/JPY - Good OpportunityPrice tapped into 1H demand zone and the 15min OB inside the FVG before showing a strong rejection. Bullish structure still intact with a clean 2:1 RR targeting previous supply zone. Patience paid off on this textbook entry.
AUDCAD Q3 | D21 | W30 | Y25 📊AUDCAD Q3 | D21 | W30 | Y25
Daily Forecast 🔍📅
Here’s a short diagnosis of the current chart setup 🧠📈
Higher time frame order blocks have been identified — these are our patient points of interest 🎯🧭.
It’s crucial to wait for a confirmed break of structure 🧱✅ before forming a directional bias.
This keeps us disciplined and aligned with what price action is truly telling us.
📈 Risk Management Protocols
🔑 Core principles:
Max 1% risk per trade
Only execute at pre-identified levels
Use alerts, not emotion
Stick to your RR plan — minimum 1:2
🧠 You’re not paid for how many trades you take, you’re paid for how well you manage risk.
🧠 Weekly FRGNT Insight
"Trade what the market gives, not what your ego wants."
Stay mechanical. Stay focused. Let the probabilities work.
FRGNT 📊
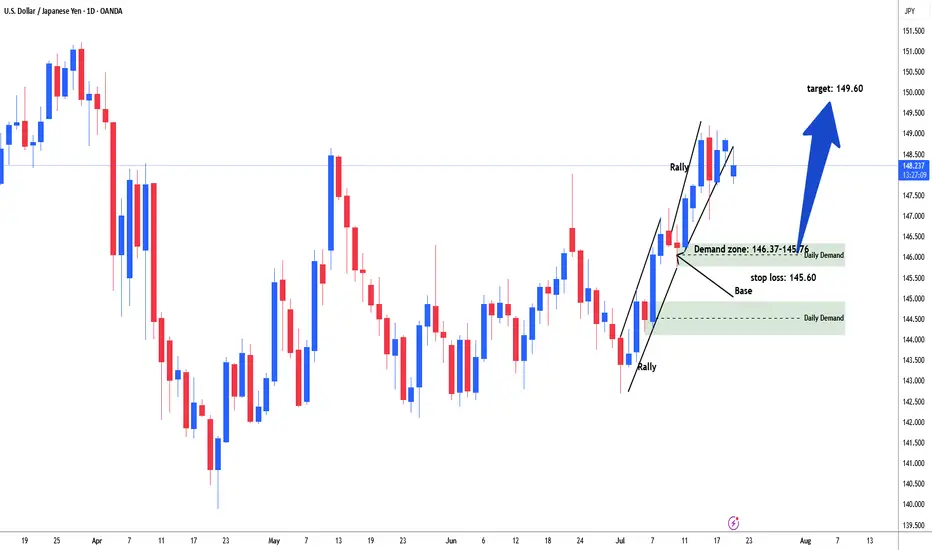
USDJPY Possible long for 149.60#usdjpy started rally from the start of the month of July. Price consolidate in range between 142.85-10. Then started rally. price again consolidate in range between 147.15-145.76 area. Market build energy and institutional add further longs and broke above the daily resistance line 148.60. Need to sell off / retracement to test demand zone range 146.37-145.78 area to test and filled remaining institutional orders for long. Buying area 146.37-145.76. stop loss: 145.60. Target: 149.60
EURJPY Q3 | D21 | W30 | Y25📊EURJPY Q3 | D21 | W30 | Y25
Daily Forecast 🔍📅
Here’s a short diagnosis of the current chart setup 🧠📈
Higher time frame order blocks have been identified — these are our patient points of interest 🎯🧭.
It’s crucial to wait for a confirmed break of structure 🧱✅ before forming a directional bias.
This keeps us disciplined and aligned with what price action is truly telling us.
📈 Risk Management Protocols
🔑 Core principles:
Max 1% risk per trade
Only execute at pre-identified levels
Use alerts, not emotion
Stick to your RR plan — minimum 1:2
🧠 You’re not paid for how many trades you take, you’re paid for how well you manage risk.
🧠 Weekly FRGNT Insight
"Trade what the market gives, not what your ego wants."
Stay mechanical. Stay focused. Let the probabilities work.
FRGNT 📊