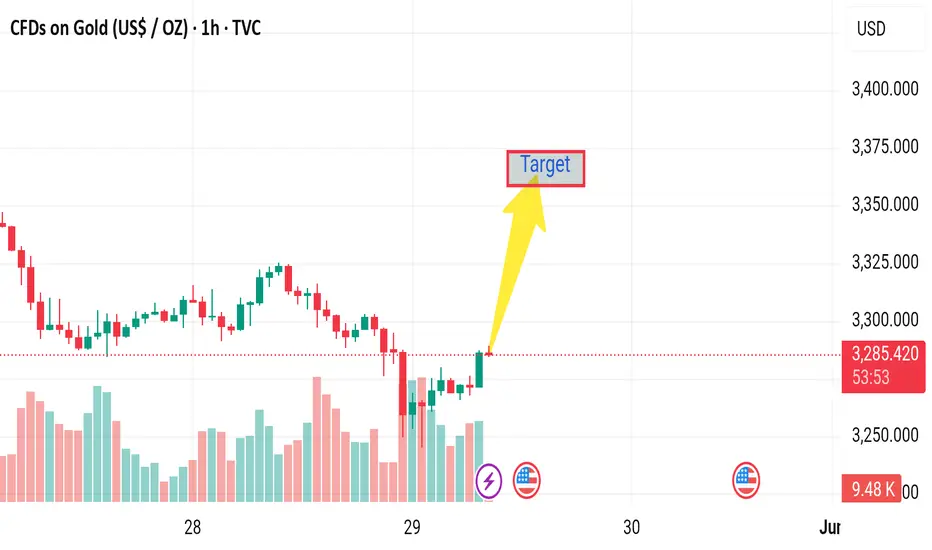
Market next move 🔻 Disruption to Bullish Thesis
1. Resistance Zone Near Target
The "Target" area might align with a previous resistance level (historically where price has reversed or consolidated).
If price hits that zone, it could stall or reject, rather than break through.
2. Bearish Volume Divergence
While the candles are green and pushing upward, volume is not increasing significantly.
Lack of strong buying volume can suggest a weak rally — potentially a bull trap.
3. Trend Context: Larger Downtrend
The chart shows a strong prior downtrend before the recent small upward push.
This move could be a dead-cat bounce or retracement within a broader bearish move.
4. Fundamental Risk: USD Strength
If the US Dollar Index (DXY) strengthens due to macroeconomic data or Fed commentary, gold (USD-denominated) typically drops.
The calendar icons suggest upcoming US economic data, which could disrupt gold’s movement.
5. Candle Structure Shows Exhaustion
The current bullish candles are smaller compared to previous strong red ones.
This may imply momentum exhaustion before reaching the target.
Forexsignal
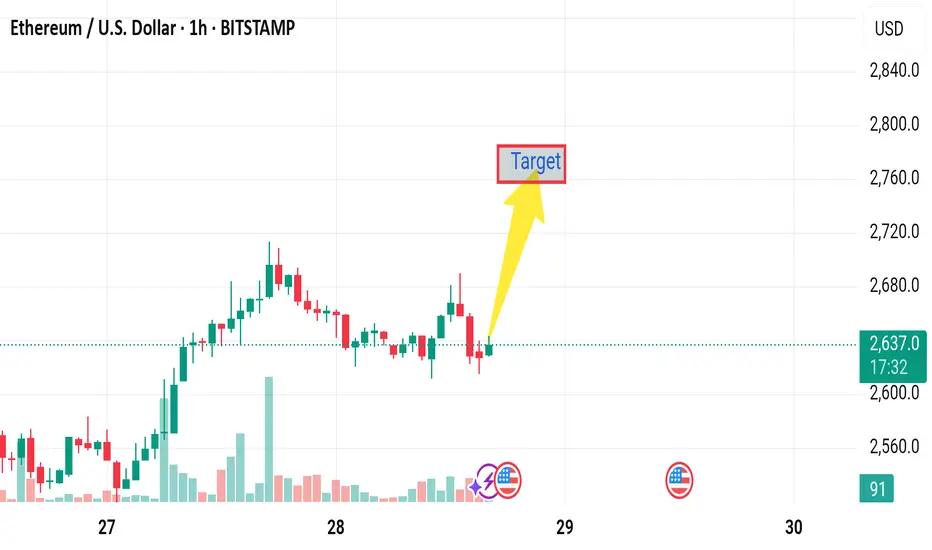
Market next move
🚨 Disruption: Bearish Outlook
🔻 1. Lower High Pattern Forming
Price peaked earlier and has not made a new high. Instead, we’re seeing a flattening top. This could indicate distribution rather than continuation. A failure to break above ~$2,675 confirms a lower high.
🔻 2. Diverging Momentum
The price has moved sideways with decreasing volume, suggesting momentum is fading. Buyers may be losing interest, setting up for a reversal or sharp dip.
🔻 3. Bearish Candlestick Rejection
Recent candles show upper wicks, signaling selling pressure at highs. If this continues, the price may be forming a rounded top, not prepping for a breakout.
🔻 4. Potential Breakdown Zone
If ETH falls below the ~$2,620 support region, it opens the door to $2,580 or even $2,540, especially ahead of upcoming economic events (marked on the chart) which may spook risk markets.
🔻 5. Liquidity Trap Risk
This small bounce could be a liquidity trap—pulling in long traders before reversing sharply. This tactic often happens ahead of volatility spikes
Market next target
📊 Original Analysis Summary:
Bias: Bullish reversal expected from the support box.
Path: Minor pullback followed by a breakout toward a higher target.
Indicators: Green arrow bounce, blue and yellow upward paths projecting continuation.
---
🚨 Disruption & Bearish Risks:
🔴 1. Support Zone is Weak
The price dipped into the red support box and bounced, but barely made a strong recovery. A weak reaction from this zone could signal buyers are hesitant or exhausted.
🔴 2. Bear Flag Formation
The current price action could be forming a bear flag pattern: a brief upward consolidation following a sharp drop. If confirmed, this would likely lead to another leg down, not up.
🔴 3. Volume Discrepancy
The bounce lacks volume confirmation—note the relatively low buying bars after the large red selling volume spike. This suggests weak bullish conviction and potential for another sell-off.
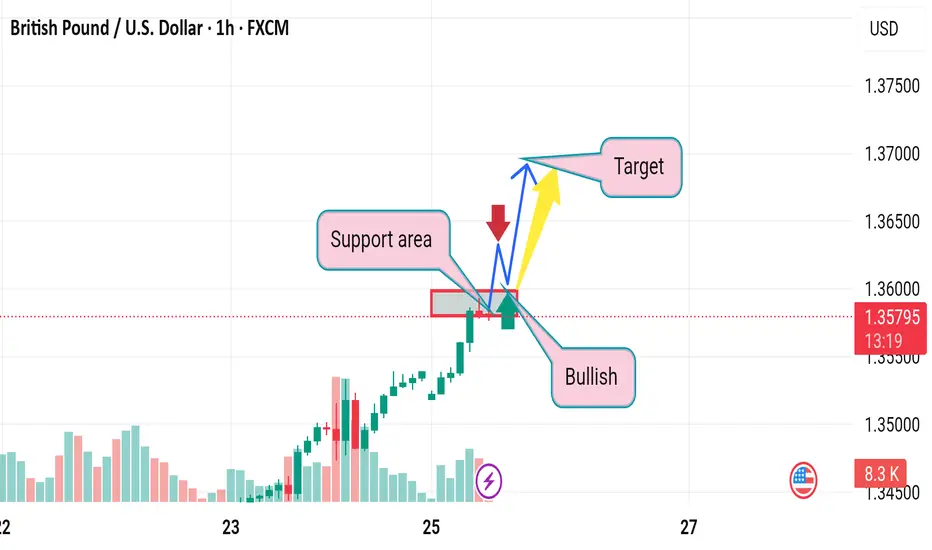
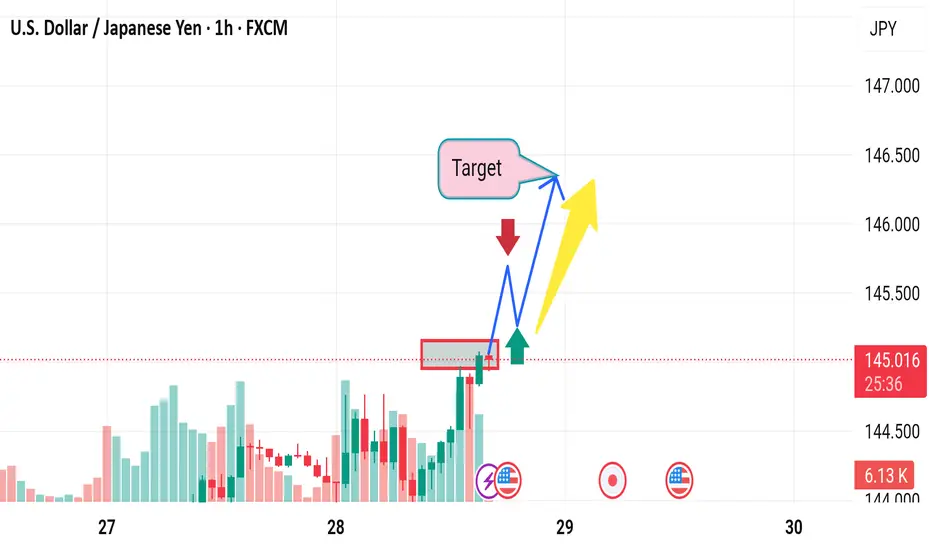
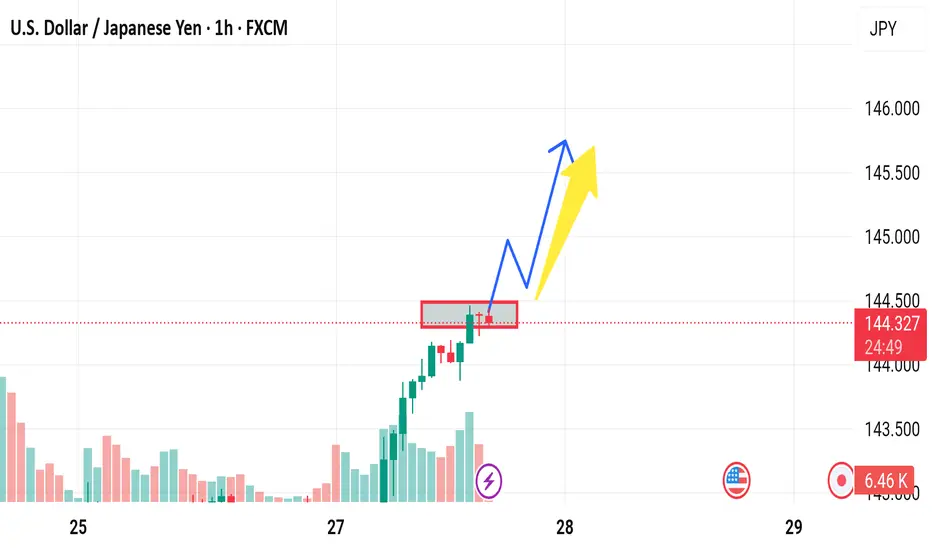
Market next move
📊 Current Analysis Summary:
Pair: USD/JPY on the 1-hour timeframe.
Bias: Bullish breakout above a minor consolidation (highlighted box).
Target: Set higher, implying continuation of upward momentum.
Arrows: Show bullish path with a minor pullback, then a breakout continuation.
---
❌ Disruptive Breakdown:
🔴 1. Fake Breakout Risk
Price is testing the upper bound of the consolidation box. If this breakout fails to hold, it could trap late buyers. A rejection back inside the box might trigger a bearish reversal—a textbook bull trap scenario.
🔴 2. Volume Divergence
Despite the green breakout candle, the volume spike is not aggressive enough. If volume fails to increase further, it may suggest exhaustion, not momentum. This divergence undermines the breakout’s credibility.
🔴 3. Fundamental Uncertainty
Several U.S.-related economic icons (e.g., high-impact news) are visible. A hawkish BoJ or weaker-than-expected U.S. data could sharply reverse USD strength, causing a retracement or dump back below 145.000.
🔴 4. Overextended Short-Term Move
The steep rise could signal near-term exhaustion. RSI or other momentum indicators (not shown here) likely suggest overbought conditions, increasing the probability of a cool-off retracement.
🔴 5. Liquidity Grab & Drop Setup
Price might poke just above the box (to trigger stop losses and attract breakout traders), then reverse aggressively downward—a liquidity sweep or stop-hunt move before the real direction emerges.
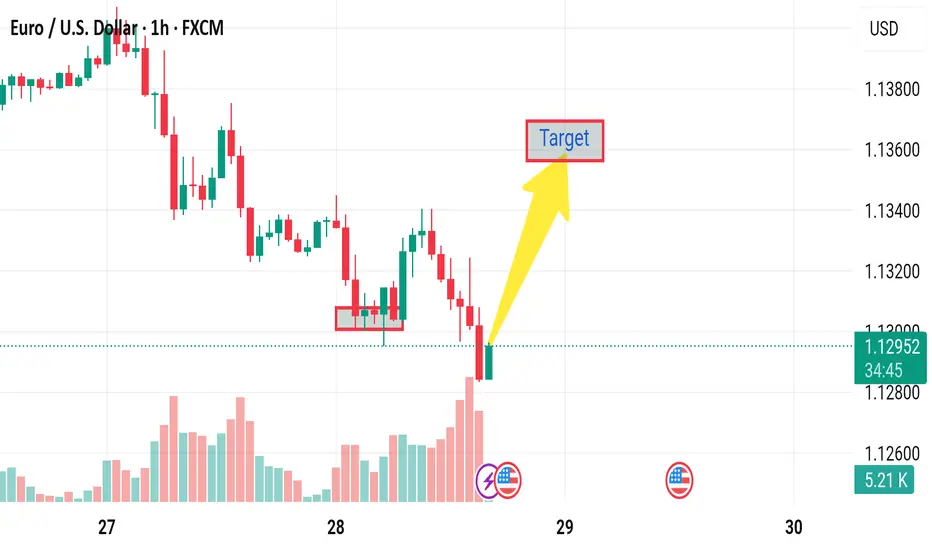
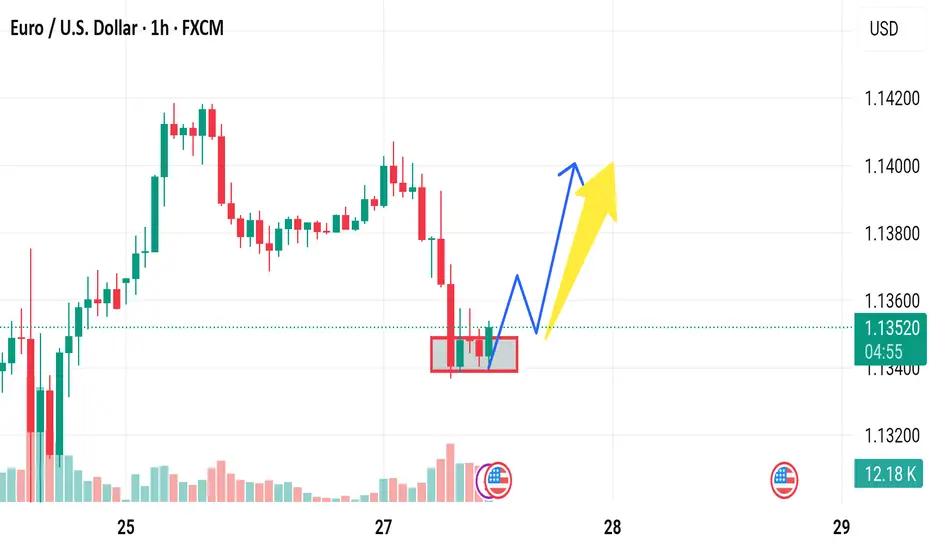
Market next move Current Analysis Breakdown:
Pair: EUR/USD on a 1-hour timeframe.
Recent Action: Sharp decline with a small bullish reversal candle.
Assumption: A potential bounce or reversal targeting the area marked as "Target."
Volume: Increased during the decline and slightly bullish at the last candle.
Technical Area: The “Target” is set above the current price, implying a bullish move is expected.
---
Disrupting the Analysis:
Let’s introduce potential bearish or contrarian scenarios to question the bullish target assumption:
1. False Reversal / Dead Cat Bounce
The small green candle after a strong red volume drop could simply be a temporary retracement or a dead cat bounce—a short-lived recovery before the price resumes falling.
2. Volume Analysis Contradiction
While volume has increased, the spike occurred mostly during red candles (bearish). This indicates strong selling pressure, not accumulation. The green candle’s volume is relatively small, suggesting weak buyer interest.
XAUUSD buy now XAUUSD next move opportunity Instrument: Gold Spot (XAU/USD), 1H chart
Price Level: $3,323.31
Highlighted Zone: A support area around $3,310–$3,315
Outlook: Bullish, with two potential upward paths indicated (green and red arrows)
Assumption: Price will hold the support zone and bounce higher

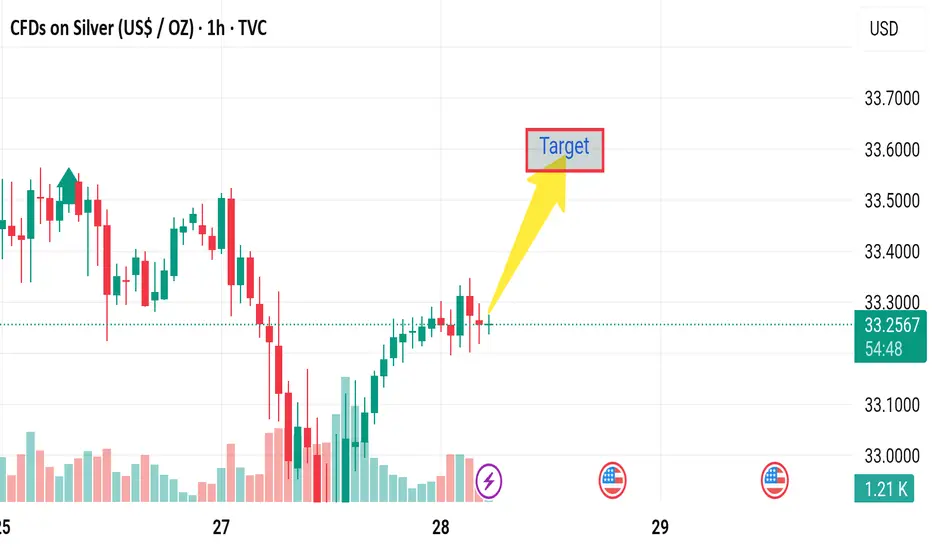
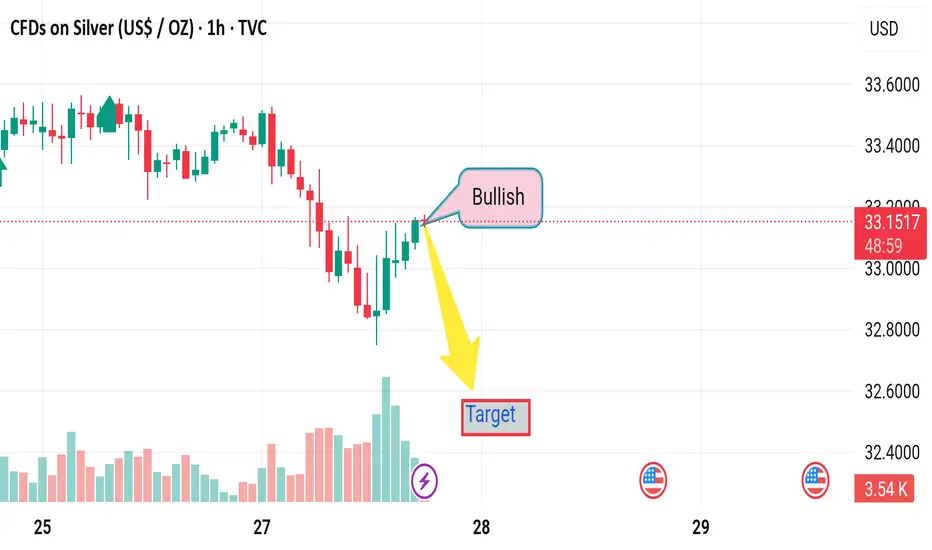
Market next move 🚨 Disruptive Take on the Current Silver-CFD Setup (1 h)
⚠️ Key Issue Why It Undermines the Long-Target Thesis
1. Target looks “wishful” The arrow projects a move into the 33.55–33.60 zone without price ever clearing the nearest resistance band around 33.30–33.35. A premature target can bait traders into chasing the tail end of a relief rally.
2. Volume doesn’t back the bounce Notice how the big green climb out of the pit on the 27 th started on strong volume, but the last 10–12 candles show shrinking green bars. Demand is decaying as price inches higher—a classic recipe for a bull trap.
3. Momentum is stalling The most recent candle printed red right at the dotted mid-line, hinting at exhaustion. Without a fresh momentum kick (e.g., higher high ➜ bullish engulfing), upside continuation is statistically fragile.
4. Structure still favors lower highs The broader pattern since the 25–26 th is a series of lower swing-highs. Until that diagonal is broken decisively, every uptick remains a counter-trend bounce, not a new up-trend.
5. Macro landmine ahead The U.S. flag icon marks an impending data release. Silver’s intraday volatility tends to spike on USD events; any dollar strength could instantly unwind the thin-volume rise. Trading into news with no contingency ≠ smart risk.
6. Stop-loss placement is unclear Without a clearly defined invalidation level (e.g., below 33.00 or under the 27 th swing-low), the R-R profile is lopsided: limited upside room vs. plenty of air underneath.
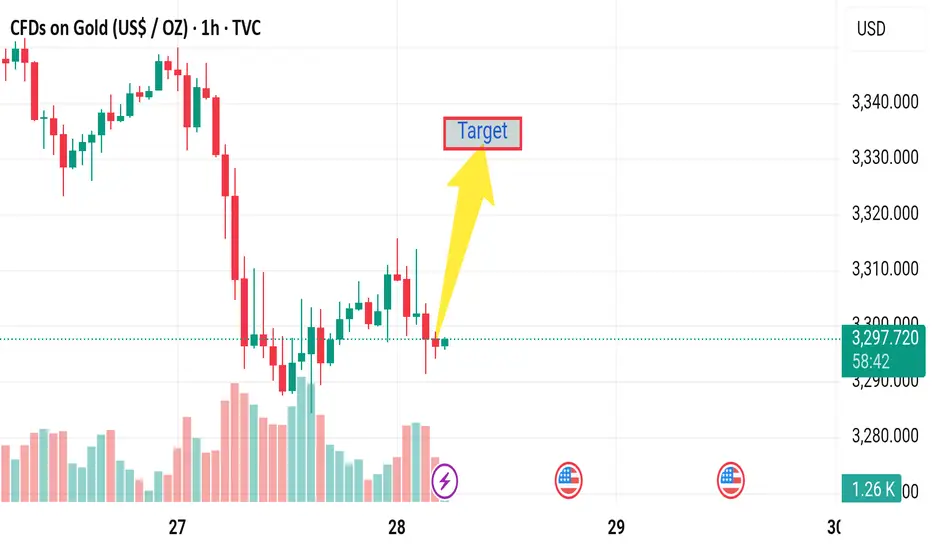
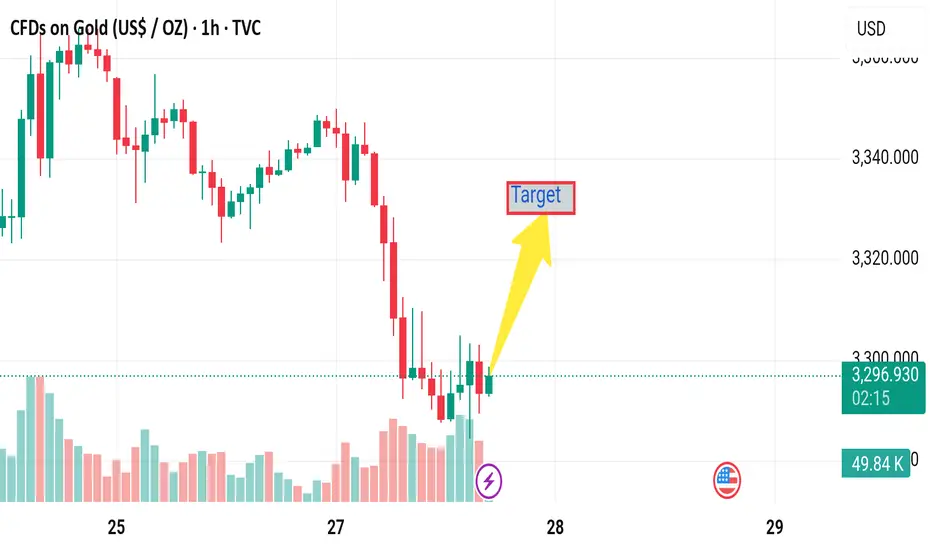
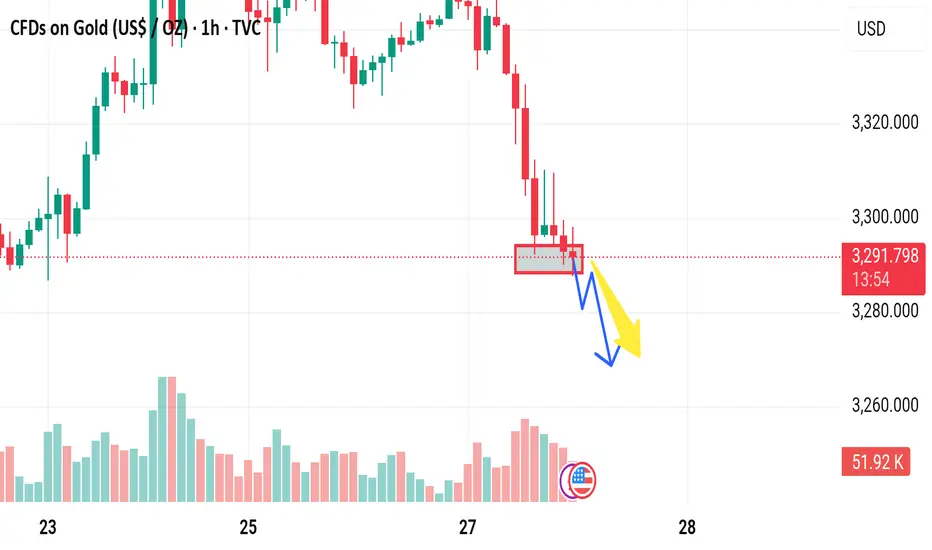
Market next move 🚨 Disruption Analysis of the Gold CFD Chart
1. Over-Optimistic Target Placement
The target is placed significantly above the current market trend without substantial confirmation of a reversal.
The recent bullish candles are weak and not supported by volume spikes.
There's a bearish engulfing pattern forming, suggesting a possible continuation of the downtrend.
2. Weak Volume Confirmation
The rise in price does not coincide with a strong increase in buying volume.
Volume bars are mixed and not clearly favoring buyers, indicating market indecision rather than strength.
3. False Bottom Assumption
The assumption that the market has bottomed on the 27th is speculative.
Without a double-bottom pattern or significant bullish divergence on an RSI/MACD (not shown here), the upward bias is unjustified.
4. Price Action Breakdown
Lower highs and lower lows are still visible.
The short bounce could be a retracement rather than a trend reversal.
5. Macro or Fundamental Events Ignored
Given the presence of the US flag icon (economic event), any upcoming data release (like GDP, interest rates, etc.) could drastically alter market direction.
Trading before news without adjusting targets and stops is risky.
Market next move
1. Misleading Bullish Label
Issue: The chart marks the latest price action as "Bullish" based on a short-term recovery.
Disruption: This could be a dead-cat bounce — a temporary recovery in a downtrend. The overall trend from the prior candles is bearish, and a few green candles don’t confirm a reversal without volume or structural confirmation.
---
2. Volume Analysis Ignored
Issue: The volume spike accompanying the recent green candles is not fully analyzed.
Disruption: Although there's higher volume, it could be short covering or a reaction to news, not organic buying interest. No volume divergence or institutional footprint confirmation is given.
---
3. No Confirmation Pattern
Issue: No mention of chart patterns (e.g., double bottom, inverse head and shoulders, etc.).
Disruption: Calling it “bullish” without a clear technical pattern or confirmation (like a break of resistance or retest) is speculative.
---
4. Vague Target
Issue: The “Target” is labeled without specifics.
Disruption: There's no price level, Fibonacci retracement, or resistance level justification. A target without rationale lacks credibility.
---
5. No Risk Management
Issue: No stop-loss or risk level is discussed.
Disruption: Without defined risk-reward ratio, the analysis is incomplete and not tradable. Every strategy needs downside planning.
Market next target Disruption of the Analysis
1. Weak Confirmation of Reversal: The chart shows a possible target zone after a recent small bullish move, but the candlestick reversal pattern is weak and lacks a strong confirmation candle. Without a bullish engulfing or a high-volume breakout, this “Target” may be premature.
2. Downtrend Momentum Intact: Despite the slight bounce, the broader trend remains bearish (visible by the previous lower lows and lower highs). No trendline break or structural shift supports a move toward the target.
3. Volume Does Not Support Breakout: Although there is a small spike in green volume, it does not exceed previous bearish volume, which suggests that buyers are not yet in control.
4. Over-reliance on Visual Targeting: The “Target” label appears to be placed based on a subjective expectation, not on a clear technical structure like a resistance level, Fibonacci retracement, or moving average. This makes it speculative.
5. Lack of Indicator Confluence: There are no visible indicators (like RSI, MACD, or EMA crossovers) shown to justify a reversal. Trading solely on price action without confirmation from indicators reduces reliability.
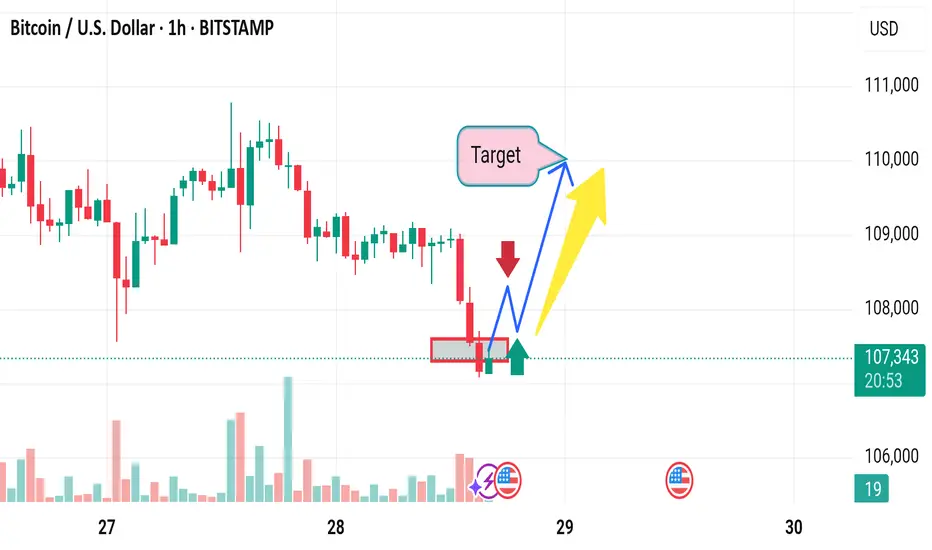
Market next move
Bullish Disruption Scenario
1. False Resistance Breakdown:
The red zone marked as resistance may fail to hold. The recent strong bullish candle and volume spike hint at possible accumulation rather than rejection.
2. Breakout and Retest Play:
Price could break above the resistance zone, retest it as new support, and then continue higher—invalidating the expected red and blue downward paths.
3. Volume Behavior:
The most recent green volume spike could signal strong institutional buying, which often precedes a breakout.
4. Higher Lows Formation:
Price structure is creating higher lows, which is a bullish signal in consolidation before breakout.
5. Market Sentiment:
If upcoming U.S. macroeconomic data (see flag icons) is dovish or supportive of crypto risk-on assets, BTC could rally sharply.
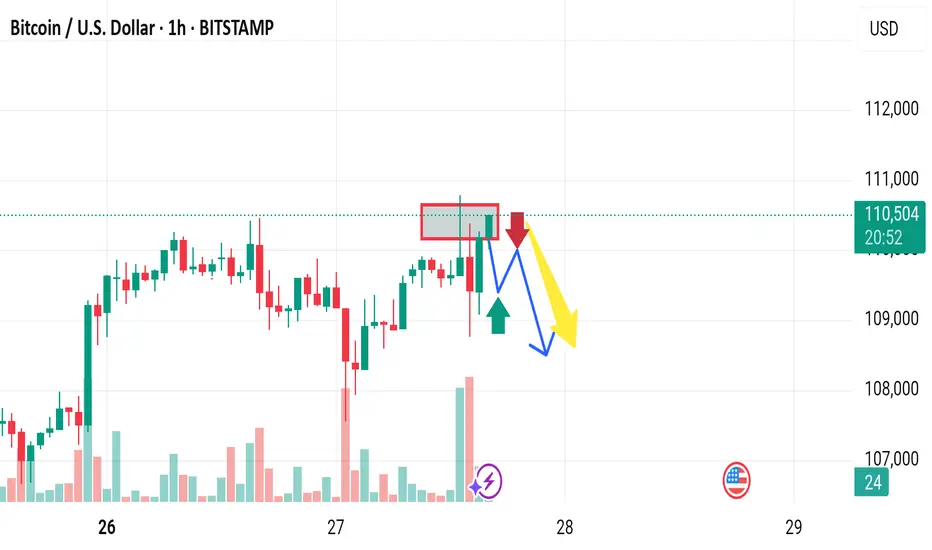
Market next move Bearish Disruption Scenario
1. Resistance Zone Holding (Red Box):
The current price is testing a strong resistance zone (highlighted in red).
There’s a chance that this level won't be broken easily due to historical supply or institutional sell orders.
2. Volume Spike Warning:
The recent green volume bars show increased buying, but this could signal buyer exhaustion if no significant breakout follows.
3. Fake Breakout Potential:
Price may perform a false breakout above the resistance, trapping late buyers before reversing down sharply.
4. Bearish Candlestick Confirmation:
If the next few candles form a reversal pattern (like a bearish engulfing or shooting star), it would support a short-term correction or drop.
5. Macro & News Risk:
Note the upcoming economic events (flag icons). U.S. or Japan economic data could disrupt the technical setup.
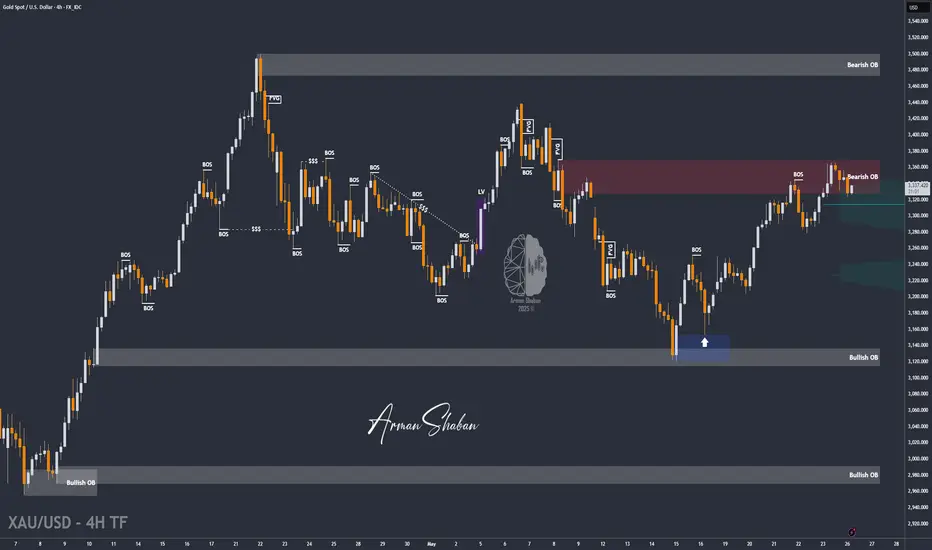
XAU/USD: Bull or Bear? Let's Find Out! (READ THE CAPTION)By examining the gold chart on the 4-hour timeframe, we can see that after our previous analysis, the price first corrected to the $3323 area and is currently trading around $3336. As mentioned in the previous analysis, as long as the price remains above $3313, we can expect further upside for gold. Based on the prior analysis, the next bullish targets are $3342, $3358, $3366, and $3394.
Please support me with your likes and comments to motivate me to share more analysis with you and share your opinion about the possible trend of this chart with me !
Best Regards , Arman Shaban
Market next move . Support Fatigue / Breakdown Risk
Observation: Price has tested the red support zone multiple times.
Disruption: Repeated tests of support often weaken it. If it breaks, a sharp drop may follow.
Implication: Instead of bouncing, EUR/USD could slide below 1.13200, triggering stop-losses.
---
2. Lack of Bullish Volume Confirmation
Observation: The recent candles show low volume on bullish attempts.
Disruption: Weak demand at support indicates hesitation among buyers.
Implication: Without a volume spike, any bounce may be short-lived or fail entirely.
---
3. Bearish Momentum Still Intact
Observation: Price action shows consistent lower highs and lower lows.
Disruption: The short-term trend is still bearish, so this could be a pause before continuation down.
Implication: A false bullish break could trap long traders before a drop resumes.
---
4. Fundamental Risks (USD Strength)
Disruption: Any U.S. data surprises or hawkish Fed comments (noted by U.S. event icons on the chart) could push USD higher, dragging EUR/USD down.
Implication: Technical bounce setups could be invalidated by macro events.
Market next move
1. False Breakout / Bull Trap Risk
Observation: Price just touched the support and bounced slightly.
Disruption: If buyers fail to push above the next resistance (around 32.95–33.00), it could be a bull trap.
Implication: The bounce might just be a short-covering rally before another leg down.
---
2. Weak Buying Volume
Observation: The bounce lacks strong green volume bars so far.
Disruption: Weak volume on the bounce suggests limited buyer conviction.
Implication: Without a volume surge, the upward move could fizzle out quickly.
---
3. Lower High Structure
Observation: The trend before the support touch is clearly down.
Disruption: This bounce may only form a lower high before continuation lower.
Implication: The larger trend remains bearish unless 33.20+ is reclaimed with strength.
---
4. Fundamental Headwinds
Disruption: Any upcoming data like strong USD, rising interest rates, or weak industrial demand could push silver down despite technical setups.
Implication: Bullish setups could fail fast due to macroeconomic pressure.

Market next move
1. Potential Bear Trap Scenario
Observation: The highlighted consolidation area could be a support zone.
Disruption: If the price quickly reclaims and holds above this zone (around 3,292), it could be a bear trap. This might attract buyers looking for a false breakdown reversal.
Implication: This could lead to a short-term rally instead of continuation lower.
---
2. Volume Divergence
Observation: Despite the breakdown, the selling volume seems to taper off compared to the previous heavy down move.
Disruption: Lower volume on a breakdown can signal weakening bearish momentum. Price might consolidate or even reverse.
Implication: Watch for bullish volume spikes as a sign of reversal interest.
---
3. Oversold RSI or Momentum Indicators
Disruption: If momentum indicators like RSI (not visible on this chart) show oversold conditions, this may suggest a relief bounce is more likely than further immediate downside.
Implication: Short-term traders could get trapped if they short too late.
---
4. Fundamental Triggers
Disruption: Any sudden positive news for gold (e.g. economic uncertainty, lower bond yields, central bank demand) can reverse this technical setup quickly.
Implication: Be cautious trading solely on technicals in sensitive markets like gold.
Market next target ---
Bearish Disruption Analysis
1. False Breakout Zone (Red Box Area):
The price is revisiting the red box area (potential supply/resistance zone). If it fails to break and close above this zone convincingly, it may signal a bull trap.
Previous attempts to push higher were rejected around this level, showing seller strength.
2. Lower High Formation Risk:
The recent upward move might form a lower high compared to the high from the 25th.
If price reverses below $33.30–$33.20, it could trigger more downside momentum, potentially targeting the $33.00 or even $32.80 level.
3. Volume Divergence:
Notice the decline in volume as price attempts to rise. Lower buying volume may indicate weak bullish conviction, which increases the risk of a downturn.
4. Bearish Candlestick Reversal Pattern:
If any bearish engulfing or shooting star candlestick forms near resistance, it would support a bearish reversal case.

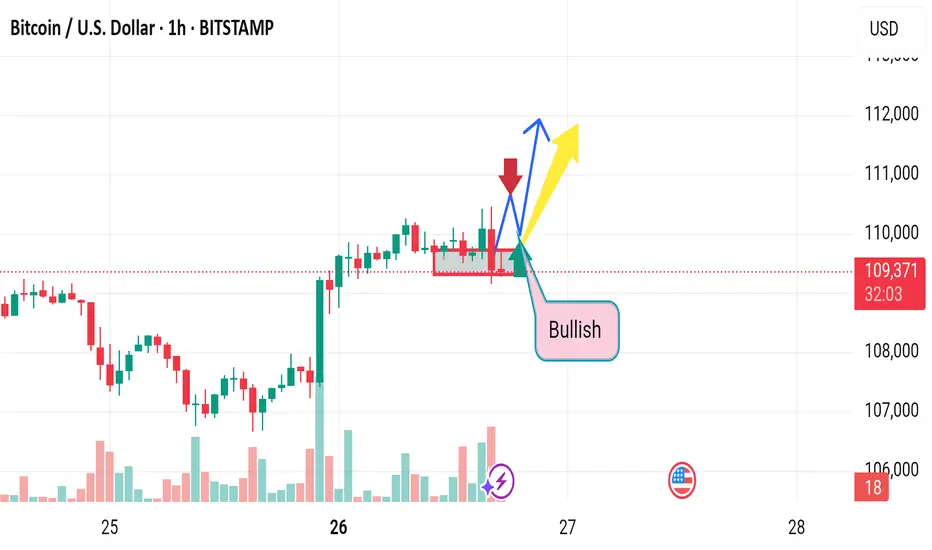
Market next move
Disruption of the Bullish Bias:
1. False Breakout Risk
The area marked with a red rectangle might be showing signs of consolidation, but there's a possibility that the bullish breakout is a bull trap.
Volume does not strongly confirm a breakout; note that the volume on the recent upward candles is not significantly higher than the surrounding bars — often a sign of weak buyer conviction.
2. Resistance Overhead
BTC is approaching the psychological level of 110,000, which may act as resistance.
Price action shows several small-bodied candles with wicks, indicating indecision or rejection from higher levels.
3. Bearish Divergence Potential
If paired with RSI or MACD indicators (not visible in this image), there might be signs of bearish divergence — price making higher highs while the indicator makes lower highs.
4. Liquidity Sweep Scenario
The recent wick into the highlighted zone could be a liquidity sweep — grabbing stop-losses before reversing downward.
This would support a bearish move contrary to the bullish forecast.
5. Market Sentiment & Fundamentals
Ignoring macro events such as Fed decisions, ETF movements, or regulatory news can be dangerous. If bearish news breaks out, technical setups can fail fast
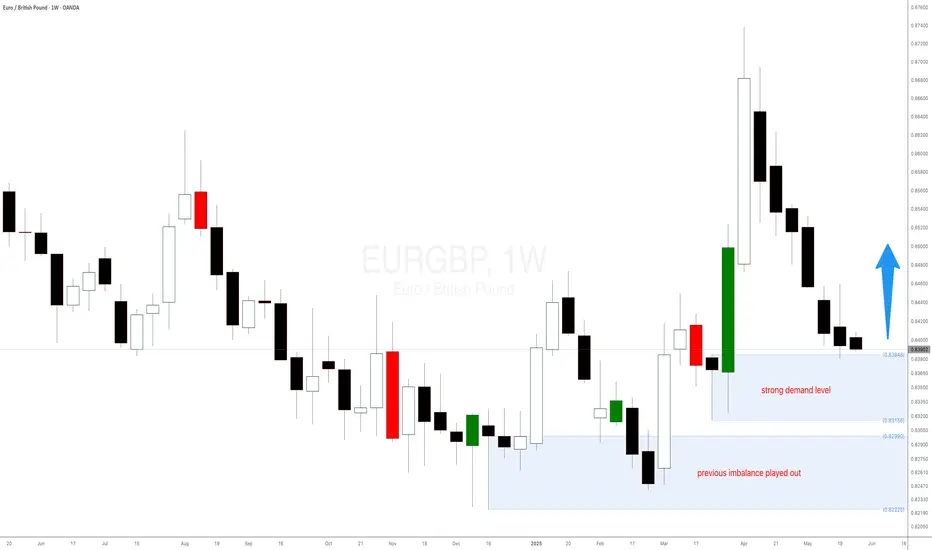
Why EUR vs GBP Could Be Your Best Trade This Week!When it comes to forex swing trading or even forex intraday trading, the temptation to zoom into lower timeframes—like the 15-minute or 1-hour charts—is strong. Most forex traders focus on short-term momentum, often diving into scalping strategies that chase quick pips. However, the real edge lies where most don’t look: the higher timeframes, particularly the weekly chart. The EUR/GBP forex pair is a perfect example of these higher timeframes' power, especially when paired with smart money concepts like demand and supply imbalances.
EUR/GBP: A Hidden Gem for Forex Swing Traders
The EUR/GBP Forex cross pair is often overlooked compared to major USD-based pairs. However, for seasoned swing traders and institutional players, EUR/GBP offers deep liquidity, cleaner technical analysis and price action structures, and strong reaction zones that are respected time and time again.
At the end of May 2025, a significant weekly demand imbalance at 0.8384 finally took control of price action—something smart money traders had been anticipating for months. This wasn't a surprise for those watching the higher timeframes. Similar to how the previous weekly imbalance at 0.8299 took control in February 2025, these zones have proven critical in guiding the medium- to long-term direction of EUR/GBP.
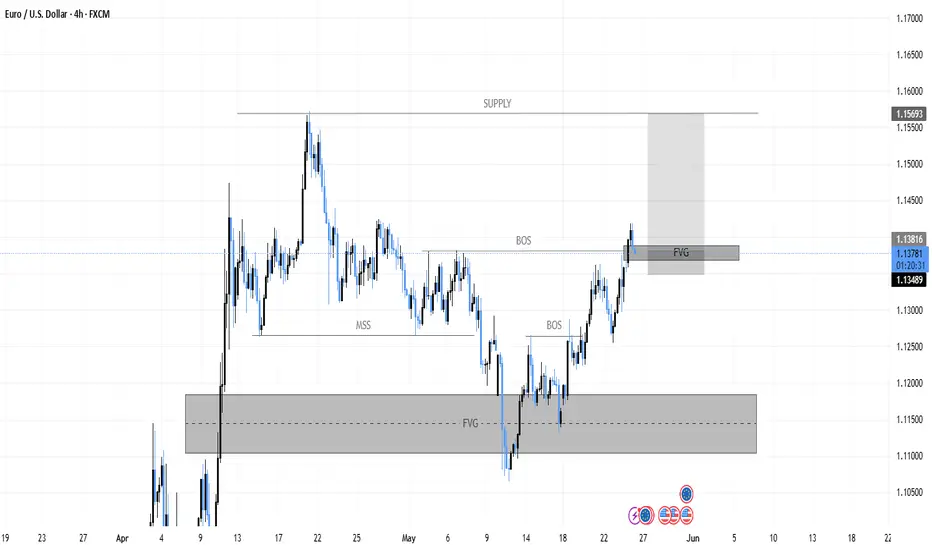
VIEW: EURUSD-Cut your losses short and let your winners run.
-The market is a device for transferring money from the impatient to the patient.
-In investing, what is comfortable is rarely profitable.
-Trade what you see, not what you think.
CONFIRMATION
-Price is bullish
-Strong order block
-BOS
-Liquidity sweep
-FVG filled
-Price retraced
NB: Do not ever compare yourself to other traders. Take regular breaks from trading Maintain a trading journal Love your craft Learn from other successful traders.
Market next target Original Analysis Summary:
Support Area Identified: Around 3335.
Expected Scenario: Bounce from support leading to a bullish move toward the "Target" zone.
Two Paths Shown: A direct bounce (yellow) or a fakeout/drop below support followed by a bullish reversal (blue arrow).
---
Disruption Analysis: Bearish Scenario
1. Support Breakdown:
Instead of bouncing at the support area (~3335), the price fails to hold and breaks down below.
Increased volume or bearish momentum could lead to this breakdown.
2. New Target Zone:
If support is broken, the next key demand zone may lie around 3300 or below, making that the new target.
Traders expecting a bounce may get trapped (bull trap), adding to sell pressure.
3. Invalidation of Bullish Setup:
The presence of consecutive lower highs leading into the support area could indicate weakening bullish momentum.
A retest of the broken support as new resistance would confirm the shift in structure (support becomes resistance).

gbpnzd buy signal. Don't forget about stop-loss.
Write in the comments all your questions and instruments analysis of which you want to see.
Friends, push the like button, write a comment, and share with your mates - that would be the best THANK YOU.
P.S. I personally will open entry if the price will show it according to my strategy.
Always make your analysis before a trade
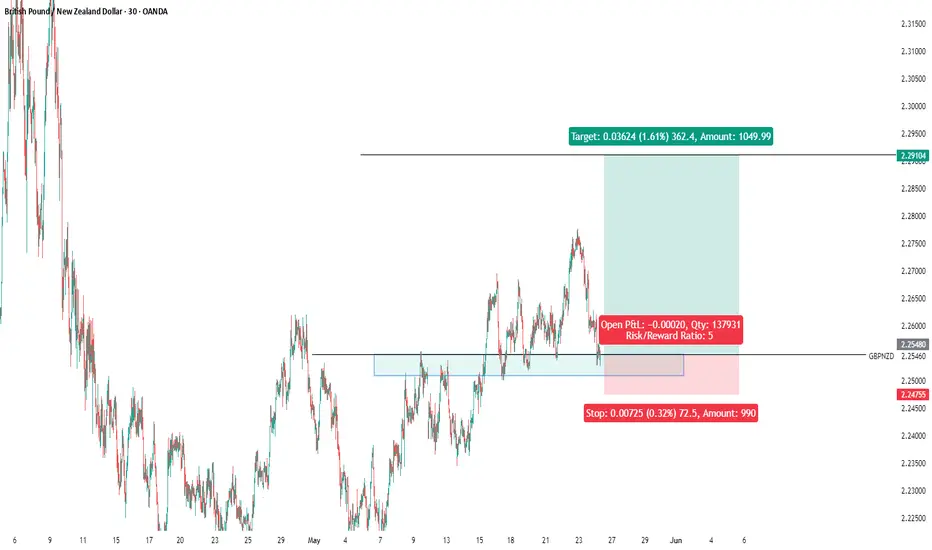
Market next target
Original Analysis Summary:
Identifies a bullish breakout above a support zone.
Expects continuation upward to a target zone after minor pullback.
Assumes support holds and bullish trend continues.
---
Disruptive Bearish Interpretation:
1. Fakeout Risk (Bull Trap):
Price broke above the support area, but this could be a false breakout designed to lure in long positions before a reversal.
2. Trendline Retest Failure:
The price is testing a trendline or resistance zone. Failure to break above this area could indicate rejection and reversal.
3. Bearish Divergence:
If momentum indicators (e.g., RSI or MACD, not shown here but inferred) show divergence, it may warn of weakening bullish strength despite price rising.
4. Candlestick Exhaustion:
Recent candles show upper wicks and slowing momentum — a common sign of potential exhaustion.