Market next move
Bearish Disruption to the EUR/USD Analysis:
1. Strong Resistance Zone (Red Box):
Price is struggling to hold above the resistance area. Several candles have long upper wicks, signaling rejection and selling pressure.
This may form a double-top or even a bull trap.
2. Volume Anomaly:
The upward price move shows decreasing volume, which is a classic signal of weak momentum. Without increasing volume, breakouts often fail.
3. Overextended Rally:
The pair has already made a sharp move up from below 1.1300 to near 1.1340. This type of parabolic move can lead to a snapback correction.
If bulls cannot decisively break resistance soon, profit-taking may trigger a short-term retracement.
4. Bearish Divergence Potential:
If RSI or MACD indicators are available, watch for bearish divergence (price makes higher highs while indicators make lower highs). This would reinforce downside risk.
5. Fundamental Pressure:
If any upcoming U.S. economic data (like PMI, FOMC minutes, etc.) is strong, it could boost USD and push EUR/USD down from this resistance.
Forexsignal

GOLD BUY NOW STRONG BULLISH NEXT MOVE1. Double Top Resistance
The chart identifies a "double top" near the current level. This is typically a strong bearish reversal pattern.
If price fails to convincingly break above this level (around 3,310–3,320), it may indicate a loss of bullish momentum.
2. Overextended Move
Recent candles show a steep rally (notably the 3.03 move), which may be overbought on lower timeframes (e.g., RSI likely >70).
Parabolic moves are often followed by sharp corrections.
3. Support Cluster Vulnerability
The red shaded support zones could act as liquidity traps. If price dips into those zones and fails to bounce, it may trigger sell-offs.
Especially the zone just below the current price — if broken — could accelerate downside toward the "Strong Support Area" around 3,270.
4. False Breakout Risk

Market next move Bearish Disruption Analysis:
1. Weak Breakout Confirmation:
Although price broke above the red consolidation zone, it quickly pulled back within the range, suggesting a false breakout or bull trap.
The current red candle closing back into the range hints at bullish exhaustion.
2. Volume Divergence:
Note the declining volume on the recent upward push compared to the initial breakout on the 20th.
Lower volume during a breakout typically signals lack of conviction, weakening the bullish case.
3. Resistance Cluster:
The price is stalling just above the 3306 level — possibly facing resistance from previous highs or round-number psychological resistance.
Bears may take control if price fails to hold above 3300.
4. Potential Bearish Scenario:
Price re-enters the consolidation range and breaks below it.
Target zones could be:
3,290 (local support from the range base)
3,270 (previous minor support)
Further down toward 3,250 if momentum builds.

Market next move 1. Weak Momentum Into Resistance
The candles near resistance are small-bodied and lack strong bullish volume.
Disruption: This signals buying exhaustion. Price could consolidate or reverse sharply, especially if buyers fail to defend this level.
---
2. Resistance Zone Saturation
The resistance zone (highlighted in red) has already been tested multiple times.
Disruption: This could either lead to a breakout or—more likely in a weak volume context—a liquidity trap and reversal, as market makers use the expectation of a breakout to trap long positions.
---
3. Potential Double Top Pattern
Look closely at the two peaks around the resistance zone. They resemble a developing double top.
Disruption: If price fails to break out convincingly and starts dropping, this double top may trigger a fall back to $105,000 or even lower.
---
4. Bearish Divergence Possibility
While not shown on this chart, in cases like this, it's common for momentum indicators (like RSI or MACD) to show bearish divergence.
Disruption: Even if price hits slightly higher highs, a divergence could signal that momentum is fading and a deeper pullback is incoming.
---
5. High Sell Volume on the Spike (May 19)
That long wick candle with high volume around May 19 suggests strong seller interest above $107K.
Disruption: Buyers could struggle again in this zone, especially if that volume spike was from whales distributing.

Market next move
1. Red Zone Retest Failure
Disruption: If the price breaks back below the red highlighted zone (around 3,265–3,270), it may indicate a false breakout.
Impact: This would invalidate the bullish continuation and could lead to a sharp decline toward 3,240 or even lower.
---
2. Low Volume on the Breakout
Disruption: The breakout rally appears strong, but if upcoming candles show declining volume, it may suggest weak momentum.
Impact: A drop in volume could precede a reversal or sideways consolidation instead of the projected move to 3,306.
---
3. Double Top or Bearish Rejection at 3,306
Disruption: The price could reach the 3,306 target and form a double top, leading to bearish rejection.
Impact: This could be the start of a downtrend or extended consolidation.
---
4. Overbought Conditions
Disruption: If momentum indicators like RSI or Stochastic (not shown on chart) are in overbought territory, this could suggest a pullback is likely before continuation.
Impact: May lead to a deeper retracement than expected.
---
5. Macroeconomic or News Catalyst
Disruption: Unforeseen macro events (e.g., interest rate announcements, geopolitical tension) could cause sudden shifts against the technical outlook.
Impact: Could override technical structure entirely.

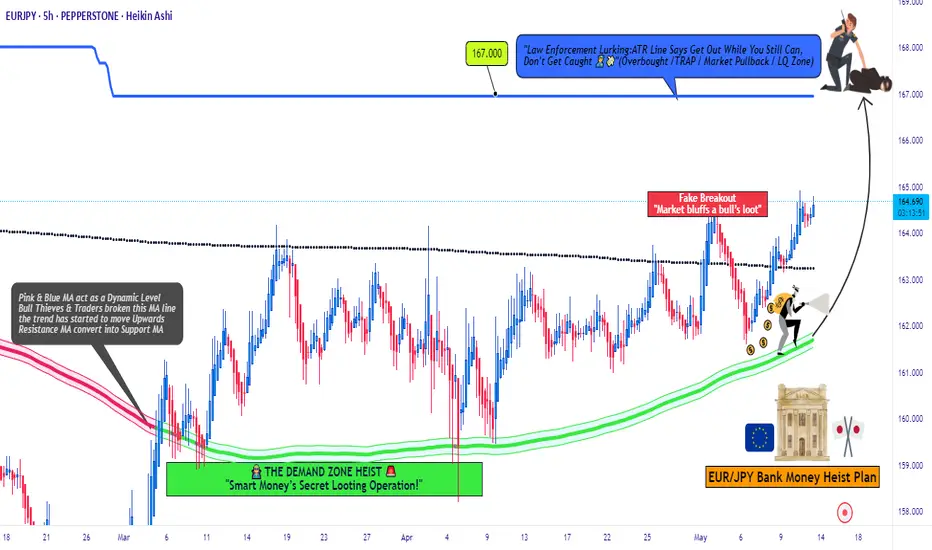
EUR/JPY "Yuppy" Heist: Sniping Swiss Profits with Thief Trading!🌍 Hello Global Traders! 🌟
Money Makers, Risk Takers, and Market Shakers! 🤑💸✈️
Dive into our EUR/JPY "Yuppy" Forex heist, crafted with the signature 🔥Thief Trading Style🔥, blending sharp technicals and deep fundamentals. Follow the strategy outlined in the TradingView chart, focusing on a long entry targeting the high-risk MA Zone. Expect a wild ride with overbought conditions, consolidation, and potential trend reversals where bearish players lurk. 🏆💰 Celebrate your wins, traders—you’ve earned it! 💪🎉
Entry 📈: The vault’s open! Grab bullish opportunities at any price, but for precision, set buy limit orders on a 15 or 30-minute timeframe near swing lows or highs for pullback entries.
Stop Loss 🛑:
📍 Place your Thief SL at the recent swing low on the 4H timeframe (163.00) for scalping or day trades.
📍 Adjust SL based on your risk tolerance, lot size, and number of open orders.
Target 🎯: Aim for 167.00
💵 EUR/JPY "Yuppy" is riding a bullish wave, fueled by key market drivers. ☝
Unlock the full picture—dive into Fundamentals, Macro Insights, COT Reports, Quantitative Analysis, Sentiment Outlook, Intermarket Trends, and Future Targets. Check 👉🌎🔗.
⚠️ Trading Alert: News & Position Management 📰🚨
News can shake the market hard. Protect your trades by:
Avoiding new entries during news releases.
Using trailing stops to lock in profits and shield running positions.
📌 Markets move fast—stay sharp, keep learning, and adapt your strategy as conditions evolve.
💖 Power up our heist! 🚀 Tap the Boost Button to amplify our Thief Trading Style and make stealing profits a breeze. Join our crew, grow stronger, and conquer the markets daily with ease. 🏆🤝❤️
Catch you at the next heist, traders—stay ready! 🤑🐱👤🤩
Market next move 1. Over-Reliance on Support Zone
The analysis heavily leans on the assumption that the support zone (marked with the purple "Support" label) will hold.
However, this support has already been tested multiple times, which weakens its strength.
A break below this zone could trigger significant stop-loss hunting, leading to a bearish breakdown instead of a bullish reversal.
2. Volume Analysis Suggests Weak Momentum
The recent bounce lacks strong volume. This suggests that buying interest is not convincing at this level.
Without volume confirmation, any bullish move is less likely to sustain.
3. Lower Highs Pattern
Despite small rallies, the chart is forming lower highs, which is typically a bearish signal.
This hints at seller dominance, and the yellow bullish projection might be overly optimistic.
4. Resistance Overhead
The price is approaching a short-term resistance zone (red box), which has rejected the price previously.
Without a clear breakout above that, the bullish case is speculative.
5. Fundamental Factors Unaccounted
The chart doesn’t account for macro factors like U.S. dollar strength, interest rates, or geopolitical influences that often affect gold.
If the dollar strengthens, gold may drop, breaking the support.
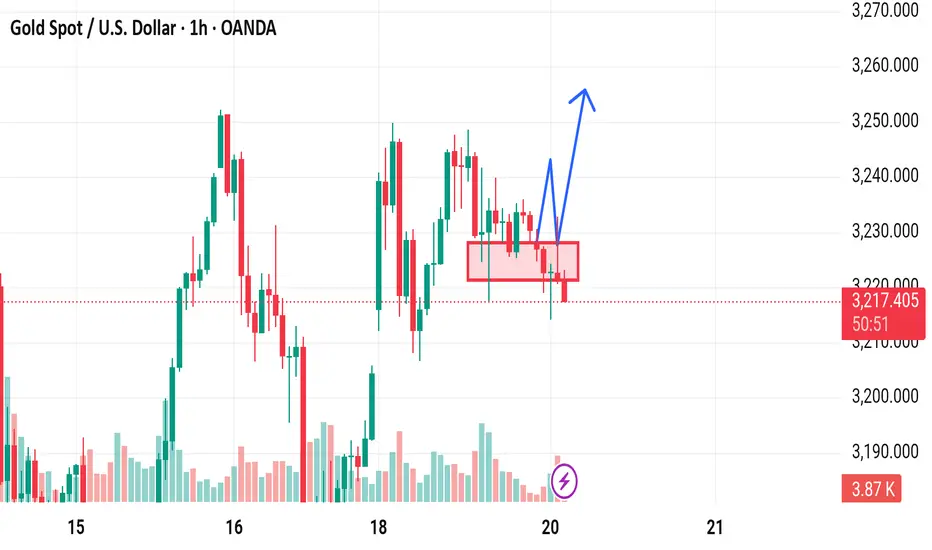
Market next move Bearish Disruption Analysis:
1. Range Weakness and Exhaustion Risk:
The price has been ranging within a tight zone, and repeated tests of the support line near 3,215–3,218 show weakening buyer pressure.
If bulls were strong, we might have already seen a breakout with momentum. Instead, there's sideways choppiness, suggesting indecision or exhaustion.
2. Lower Highs Forming:
Despite a flat support zone, price is forming lower highs, a bearish signal. Sellers are stepping in earlier on each bounce, tightening the range from the top.
3. Volume Depletion:
Volume is gradually dropping during this consolidation. If a breakout happens without a volume surge, it risks becoming a false breakout.
4. Liquidity Sweep Possibility:
Market makers might push price below the support zone (~3,215) to trigger stop-losses and accumulate orders before a potential real breakout. This would trap late buyers who enter early.
5. Bearish Scenario Path:
If price breaks below 3,215 and closes under that on decent volume, expect a move to the next demand zone near 3,200 or lower.
Downside target could be around 3,180–3,190, where the previous demand base formed on May 15.
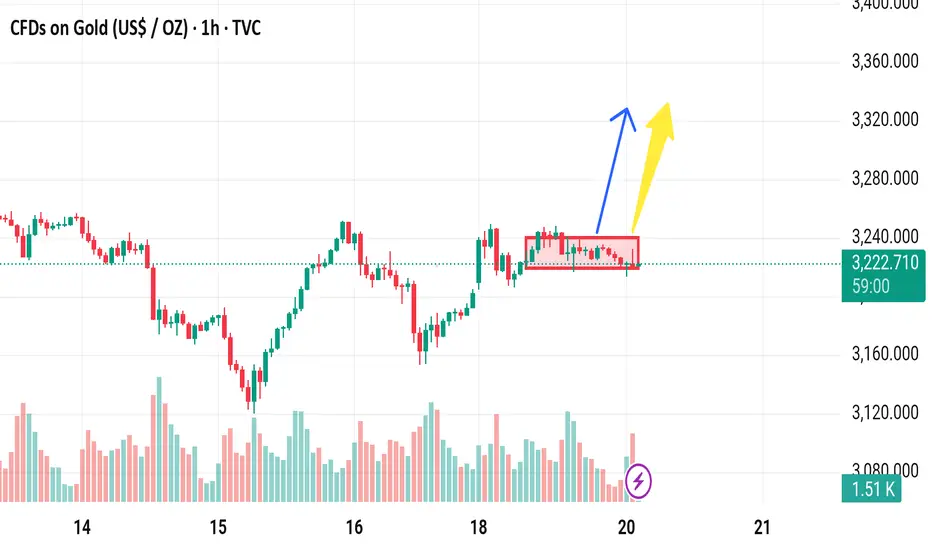
Market next moveBearish Disruption Scenario:
1. False Breakout Trap:
If the price breaks above the rectangle but lacks strong volume or fails to sustain above resistance, it may turn into a bull trap.
This could lead to a sharp reversal and shake out long positions.
2. Volume Divergence:
Notice that volume is decreasing during the consolidation. Without a spike in volume on breakout, the move could lack conviction.
This weakens the bullish case.
3. Resistance Zone Overhead:
There's likely a resistance zone just above the rectangle (around 3,240–3,260), where selling pressure could resume.
Price may test the zone, reject it, and fall back inside or below the range.
4. Double Top Risk:
The price action on the 18th and current range-top could form a double-top pattern if rejected.
A drop below the lower bound of the rectangle (~3,210) would confirm the pattern, suggesting bearish continuation.
5. Macro or Fundamental Risks:
Any unexpected strong U.S. dollar movement or interest rate expectations could push gold lower, invalidating bullish technical setups.
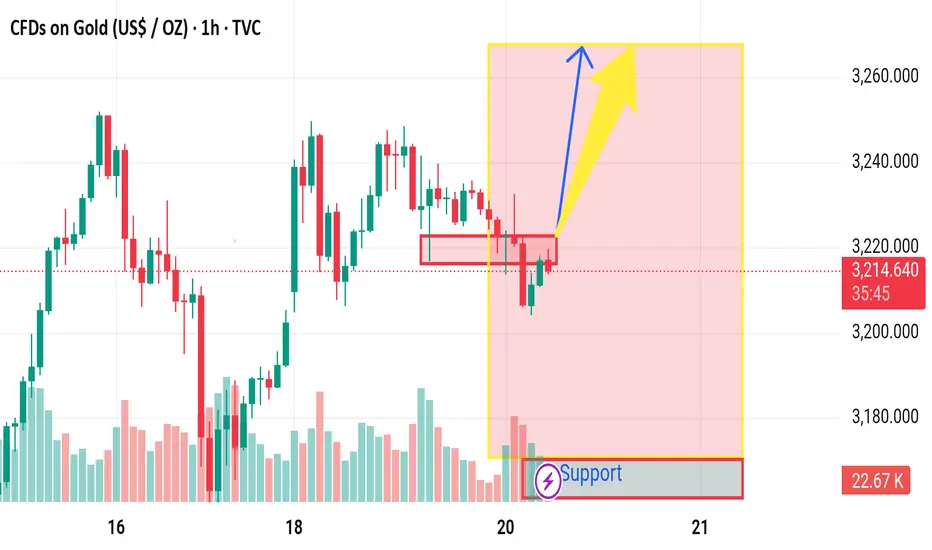
XAUUSD buy now gold next move The price is currently hovering around a critical resistance level just above the support zone.
Multiple wicks on the recent candles indicate rejection and selling pressure.
This may be a bull trap, drawing in buyers before a drop

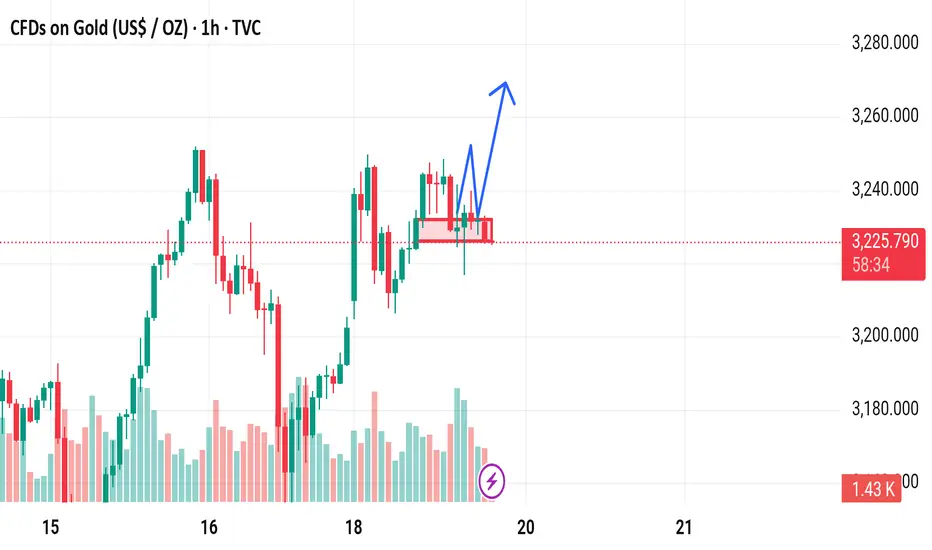
Market next move
1. Bearish Rejection from Resistance
Disruption: The price has struggled to break above the 3,240–3,250 area multiple times. This could indicate strong resistance.
Implication: If the price fails again, we may see a rejection and a move down towards the 3,180–3,160 support range instead of a bullish breakout.
---
2. Volume Analysis Caution
Disruption: The volume during recent upward moves is not significantly higher than the downswings.
Implication: Weak buying volume might not support a strong breakout, suggesting a fakeout could occur.
---
3. False Breakout Possibility
Disruption: A possible fake breakout above the red box might lure in buyers before a reversal.
Implication: Watch for a "bull trap" where the price briefly breaks up and then reverses sharply downward.
---
4. Macro Events Ahead
Disruption: The timing (around May 20) could align with macroeconomic news (e.g., Fed minutes, CPI, etc.).
Implication: News can trigger volatility and negate technical expectations.
---
5. RSI or Momentum Indicators?
Disruption: Without checking RSI or other momentum indicators, the analysis might lack confirmation.
Implication: Overbought/oversold conditions could shift the bias unexpectedly.
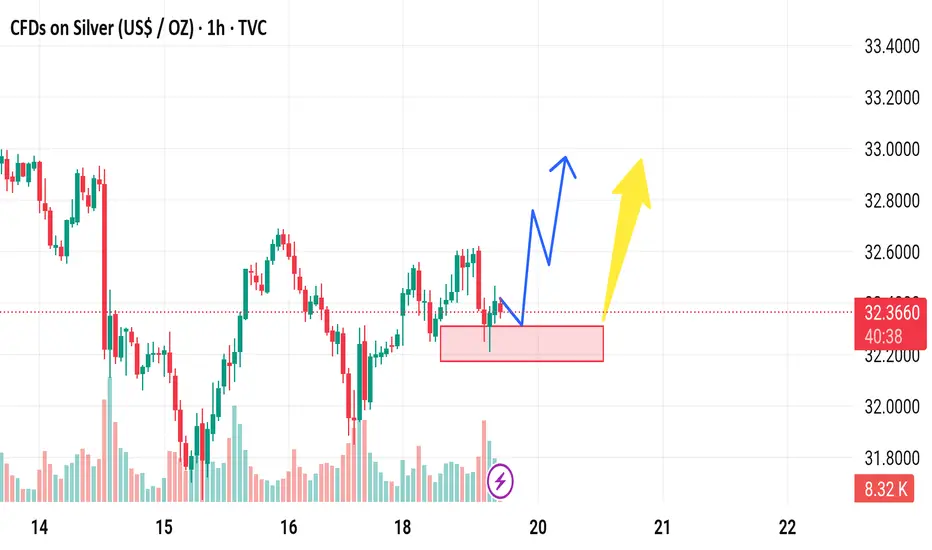
Next move Disruption Analysis: Bearish Risk Perspective
1. Sideways Consolidation (Red Box Zone):
The price is consolidating in a tight range between roughly 32.20 and 32.40, showing indecision and potential for either a breakout or breakdown.
Repeated rejections near the top of this box can signal exhaustion of buying pressure.
2. Volume Observation:
There’s no strong volume surge indicating accumulation; volume appears mixed and doesn't strongly support a bullish breakout.
A potential fakeout risk exists if the price spikes above the consolidation range only to fall back in (bull trap).
3. Potential Bearish Breakdown:
If the price breaks below the red box, especially under 32.20, it could trigger stop-losses and initiate a short-term bearish trend.
First downside target: 32.00 psychological level, followed by 31.80 support from previous lows.
4. Wick Rejection on Top:
The recent candles inside the box show long upper wicks — signs of selling pressure at higher levels.

Next move Bearish Disruption Perspective:
1. Failure to Break Above Supply
Price is struggling near 32.40–32.50, a visible resistance area from prior swing highs.
Repeated rejections here can signal seller strength or profit-taking.
2. Exhaustion Patterns
The price is forming sideways consolidation (highlighted in red).
A failure to break upward from this box and a false breakout wick would suggest buyer exhaustion.
3. Bearish Breakdown Scenario
If price breaks below the red box support (~32.30), this range could flip into resistance.
A clean drop below 32.30 would likely open the path toward 32.00 and potentially 31.80.
4. Volume Spike on Red Candle
Volume on red bars (10.64K) suggests aggressive selling pressure creeping in.
Watch for confirmation if next candles close red with high volume.

Next target Bearish Disruption Points
1. False Breakout Risk
Price is hovering near the recent highs but hasn’t made a convincing higher high.
A fakeout above 32.42 followed by a sharp rejection could trap buyers and trigger a sell-off.
2. Exhaustion at Resistance
The current level (~32.33–32.42) was a previous distribution zone on May 13–14.
Low volume follow-through may indicate weak buying interest, increasing the odds of a reversal.
3. Bearish Divergence (Potential)
If RSI or MACD shows lower highs while price pushes up, that’s a bearish divergence—a common reversal signal.
(You’d need to check indicators for confirmation.)
4. Support Flip to Resistance
If the price breaks back below the red box (~32.25), the same zone could act as resistance, turning into a supply zone.
5. Volume Clue
Volume appears lower during the recent bullish attempts, hinting at buyer fatigue.
Higher volume on red candles would validate a bearish shift.

Silver next move Weak Demand Zone Bounce
The current price action shows only a minor bounce from the demand zone.
A lack of strong bullish candles or volume confirmation may indicate weak buying interest.
2. Lower High Structure
The chart appears to be forming lower highs, suggesting a possible downtrend continuation.
If price fails to break the recent swing high near 32.70, bears might gain control.
3. Volume Concern
Recent bullish candles have decreasing volume, while the latest red candle has higher volume—this could signal a bearish divergence.
4. Bearish Trap Possibility
The current consolidation above support might turn into a distribution zone, leading to a fake breakout downward.
Gold next move The price is currently at a prior resistance level (~3,229) which may act as a supply zone. The market has already failed to break above this level multiple times in the past, indicating strong selling pressure.
2. Volume Divergence
If we analyze the volume at the most recent peaks, there's a possibility of lower buying volume despite higher prices—this could signal weakening bullish momentum.
3. False Breakout Risk
The chart suggests a possible pullback to the red demand zone before continuation. However, if the price fakes out into the zone and fails to hold above ~3,210, this could trigger a deeper selloff.
4. Double Top Formation Risk
There appears to be a potential double top pattern around 3,250–3,260, which may signal a bearish reversal if neckline support (~3,210) is broken.
5. Macroeconomic Influence
Unless supported by strong fundamentals (e.g., dovish Fed signals, rising inflation), any bullish breakout might lack fuel to sustain a rally beyond resistance.
Disruptive Bearish Scenario:
Price breaks below the red demand zone (~3,210).
Retests it as resistance.
Targets the next major support zone near 3,175–3,180.

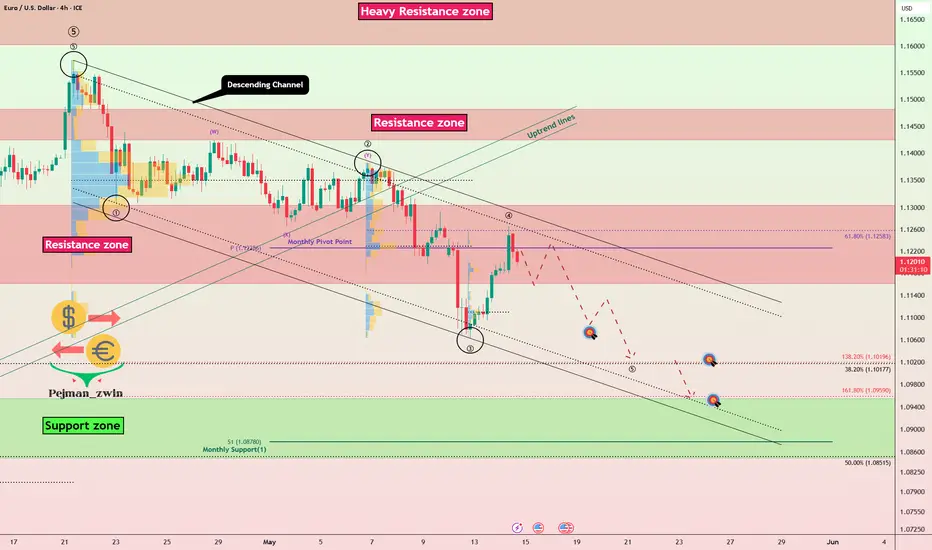
EURUSD Near Top Of Channel — Correction Imminent!!!EURUSD ( FX:EURUSD ) is trading in the Resistance zone($1.1310-$1.1162) , near the upper line of the descending channel and the Monthly Pivot Point .
In terms of Elliott wave theory , it seems that EURUSD has completed five main impulse waves , and with the break of the Uptrend lines , we should expect corrective waves . Most likely, EURUSD is completing microwave 4 , and we should expect the next decline and the formation of microwave 5 .
I expect EURUSD to fall to at least $1.1073 , and the next targets are marked on the chart.
Note: If EURUSD touches $1.1330 , we should expect further gains.
Please respect each other's ideas and express them politely if you agree or disagree.
Euro/U.S. Dollar Analyze (EURUSD), 4-hour time frame.
Be sure to follow the updated ideas.
Do not forget to put a Stop loss for your positions (For every position you want to open).
Please follow your strategy and updates; this is just my Idea, and I will gladly see your ideas in this post.
Please do not forget the ✅' like '✅ button 🙏😊 & Share it with your friends; thanks, and Trade safe.
GOLD NEXT MOVE Instrument: Gold Spot vs. USD (XAU/USD)
Timeframe: 1-hour
Current Price: 3,176.12
Support Area: ~3,120–3,160 (highlighted in pink)
Resistance Area: ~3,300 (highlighted in blue)
Forecast: Bounce from support and rally toward resistance

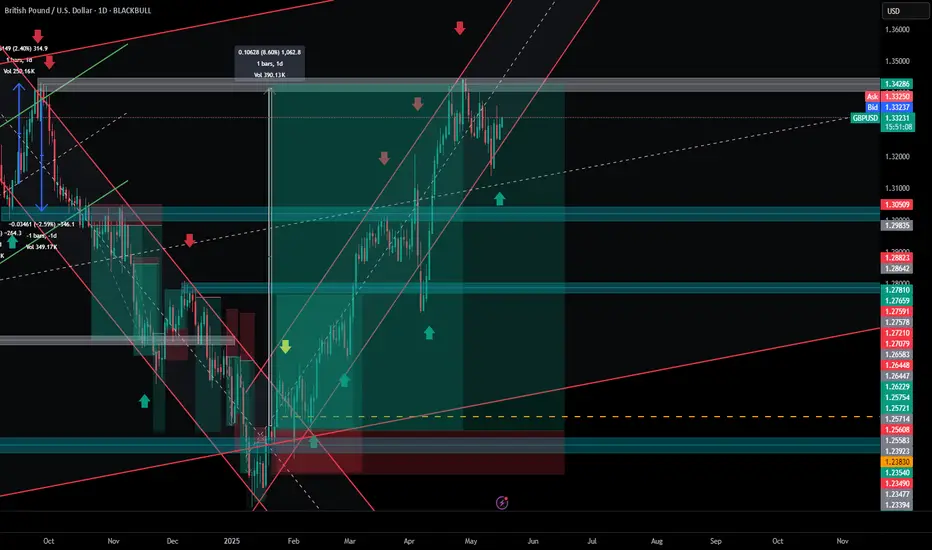
GBPUSD SWING: +1000 Pips Later, GU Is Still Climbing in Stealth 🧠 Last Idea Recap from Early Feb 2025:
- We previously caught a multi-leg upside off the bottom channel (~1.2550) with over 350 pips in structured recovery.
- Price is now grinding within upper consolidation, testing the 1.3315–1.3350 supply shelf.
Note: Check out the previous Idea from related publications to verify.
Update: GBPUSD has now delivered over 1000+ pips in swing structure from the bottom breakout (1.2550s), with even more gains harvested through intra-day and scalp setups inside this multi-week ascending channel.
Recent UK macro strength (GDP beat across MoM, QoQ, YoY) injected new life into price action, adding fundamental confluence to the clean bullish technicals already building. Price continues to respect the rising structure with higher lows and controlled consolidation near a breakout shelf at 1.3350–1.3375.
🔍 Current Structure :
- Bullish flag forming near key supply zone
- No sign of distribution or exhaustion
- Channel still intact, buyers defending every dip
Next Leg:
- Break and hold above 1.3375 could fuel another 100–150 pip run toward 1.3470 and eventually 1.3550+
- Short-term traders: watch for a stop-hunt sweep before the real move
Entry Notes:
- Use lower timeframes (4H/1H) for confirmation wicks, volume spikes, or engulfing candles
- Avoid getting trapped on the first breakout candle—look for retest/reclaim plays
Whether you’re swinging or scalping, this pair has remained one of the cleanest GBP structures in months, and this ride might not be over yet.
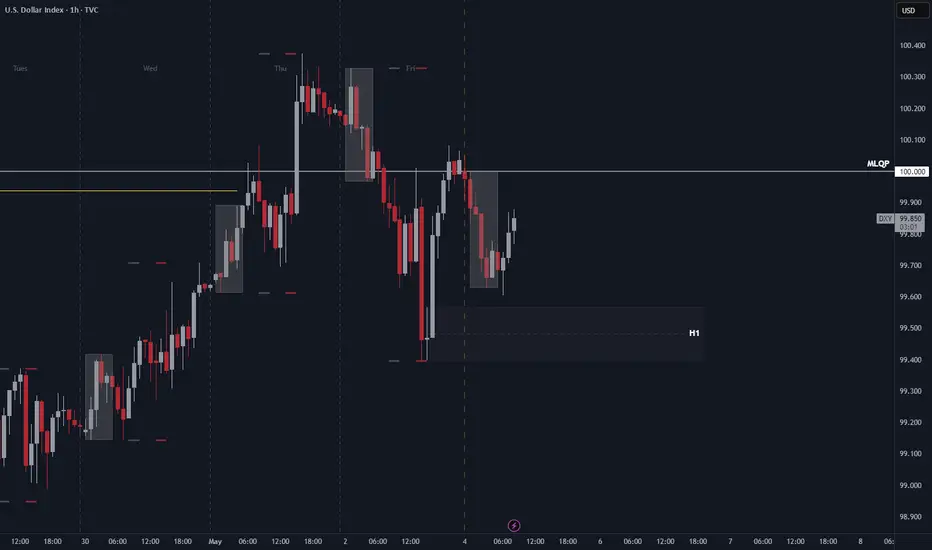
DXY (US Dollar): Bullish Order FlowA bullish order block has been identified on the H1 timeframe, situated below the Asian session range. With the US Dollar maintaining steady strength, there is potential for price to retrace into this order block for mitigation. Should this occur, a continuation of the bullish trend is anticipated, with price likely to rally and break above the recent structural high.
GOLD NEXT MOVE The current bearish outlook is valid only if price respects the selling zone and breaks below the weak low. If either of these fail — especially with fundamentals or a liquidity sweep — a bullish reversal or range scenario becomes likely

GBPCHF Breakout Eyes 1.1190–1.1290 as Bullish Momentum BuildsGBP/CHF has broken out of a descending wedge formation on the 4H chart, indicating a bullish shift in momentum. This move is supported by a recovering GBP, driven by better-than-expected UK GDP data and BoE easing expectations already priced in. Meanwhile, CHF is softening on safe-haven unwinding and a less aggressive SNB tone. Technicals point to a clean breakout with immediate upside targets at 1.1116 and 1.1190, with potential extension toward 1.1290.
🔍 Technical Analysis
Pattern: Descending wedge breakout on the 4H chart — a bullish continuation pattern.
Breakout Confirmation: Price is now trading above wedge resistance (~1.1045), showing follow-through buying.
Support zone: 1.1000–1.1040 (retest area if price pulls back)
Fibonacci Levels:
1.1116 → 50% Fib retracement + prior resistance
1.1190 → 61.8% Fib and historical reaction zone
1.1290 → 78.6% retracement and next key resistance
📈 Bullish Signals:
EUR/GBP overlay shows inverse correlation supporting GBP strength
Higher lows forming since April → structure is rising
Clean breakout with space to run before major resistance hits
🌍 Fundamental Context
🇬🇧 British Pound (GBP):
UK Q1 GDP: +0.6% q/q — solid beat vs expectations
BoE Positioning: Rate cut expected in H2 2025, but not imminent; GBP supported in the meantime
Trade Conditions: Signs of recovery, but BoE not overly dovish yet
Market Tone: GBP favored short-term due to economic resilience
🇨🇭 Swiss Franc (CHF):
SNB Stance: Recent tone shift toward caution amid deflation signals
Safe Haven Demand: Easing due to progress in U.S.–China trade talks
Macroeconomic Data: Mixed; CPI soft, and growth modest
CHF Outlook: Mildly bearish unless geopolitical risk reignites
🎯 Trade Setup
Entry: Breakout already underway at 1.1050
Upside Targets:
1.1116 (first TP)
1.1190 (major resistance zone)
1.1290 (extension zone)
Stop Loss: Below 1.1000 (below wedge retest zone)
Strategy: Buy-the-dip on pullback to 1.1040–1.1015, or hold breakout long
🧭 Conclusion
GBP/CHF shows a clean bullish breakout both technically and fundamentally. With the UK economy showing near-term resilience and the SNB expected to remain cautious, GBP strength may persist in the short run. Unless geopolitical risks resurface to revive CHF demand, the pair looks poised for a rally toward 1.1190 and possibly 1.1290 in the coming sessions.

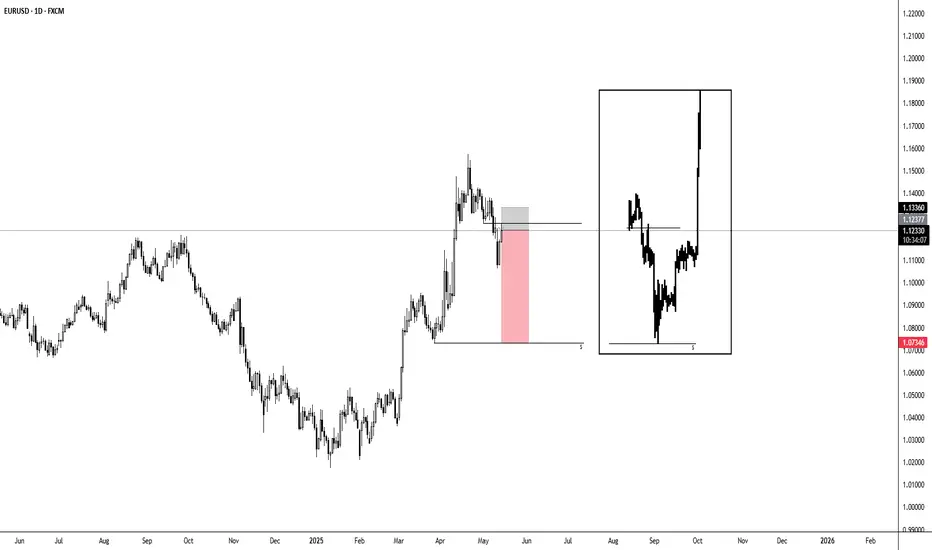
EUR/USD Daily Short SetupSetup: Retest of the former support zone (now supply) after the recent pullback from the mid-April highs
Entry: Short around 1.1336 (within the shaded resistance box)
Stop-Loss: Above the recent swing high at 1.1390
Take-Profit: Near the lower range support at 1.0735
Risk : Reward: ~1 : 5
Rationale:
Following a strong rally from early March to mid-April, EUR/USD has corrected sharply and is now back into the grey supply area that previously acted as support. This zone is likely to cap upside moves, making a short entry here attractive. The next major support lies around 1.0735, offering a high reward relative to risk. A break above 1.1390 would invalidate the setup.