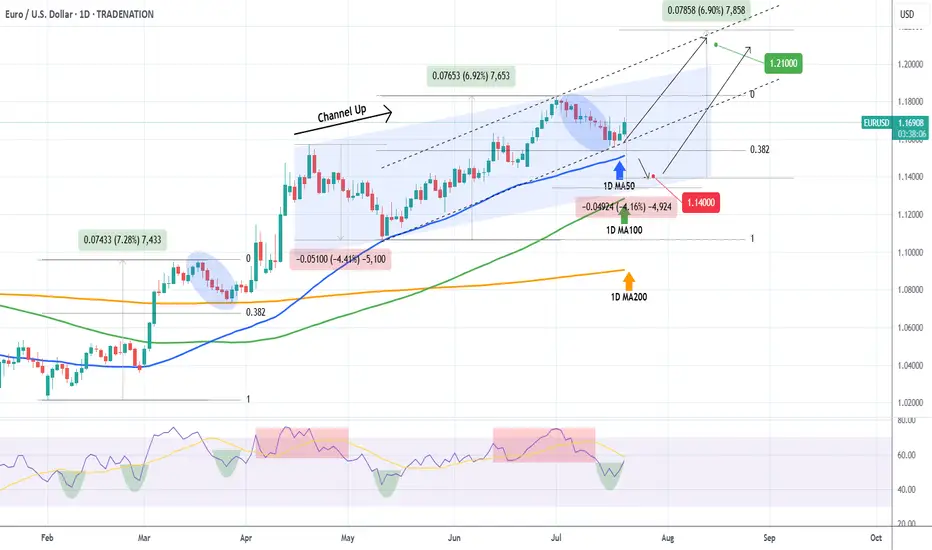
EURUSD Will the 1D MA50 hold?The EURUSD pair seems to be rebounding just before a 1D MA50 (blue trend-line) test, which is its short-term Support. At the same time it bounced off the 0.382 Fibonacci retracement level, which after a +6.92% rise, it resembles the March 27 rebound.
The 1D RSI is printing a standard bullish reversal setup, seen already 4 times since February, and a break above its MA will confirm it.
As long as the 1D MA50 holds, it may extend the uptrend to a new Channel Up (dashed), outside the blue one that may look for a new +6.92% rise. In that case our Target will be 1.21000.
If the 1D MA50 breaks, we will add one last buy at 1.14000, near the 1D MA100 (green trend-line).
-------------------------------------------------------------------------------
** Please LIKE 👍, FOLLOW ✅, SHARE 🙌 and COMMENT ✍ if you enjoy this idea! Also share your ideas and charts in the comments section below! This is best way to keep it relevant, support us, keep the content here free and allow the idea to reach as many people as possible. **
-------------------------------------------------------------------------------
Disclosure: I am part of Trade Nation's Influencer program and receive a monthly fee for using their TradingView charts in my analysis.
💸💸💸💸💸💸
👇 👇 👇 👇 👇 👇
Forexsignals
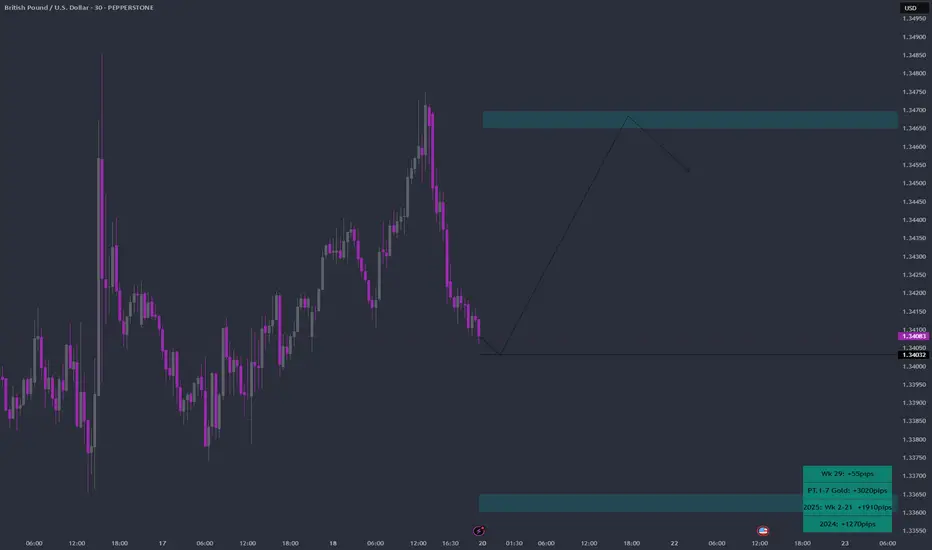
GBPUSD Week 30 Swing Zone/LevelsPEPPERSTONE:GBPUSD is expected to trend upward from the 1.34032 level towards the resistance zone. Whether it breaks through or reverses downward will ultimately depend on market players.
This projection is based on a forward-looking metric analysis, which explains why the zones are not derived from historical price action on the left side of the chart, as is common in traditional technical analysis. However, the daily candles from previous weeks still contribute meaningfully to this outlook.
XAUUSD Trade Idea - 30m Structure with 4H ConfluenceCurrently, price is trading below the 4H descending trendline, respecting bearish structure on lower timeframe (30m).
✅ 1H Order Block (OB) marked between 3335-3340 remains a strong demand zone where price can bounce break the trendline to sweep liquidity above around 3377 to form bullish continuation.
📌 Scenarios I'm Watching:
Short-term rejection from the 4H trendline.
Potential reversal towards 1H OB.
Bullish reaction from OB could trigger a breakout above the 4H trendline.
Final upside target remains at the liquidity pool around 3377 zone ($$$).
🟣 Overall Bias: Bullish after liquidity sweep. Watching for bullish confirmation at OB before executing buys.

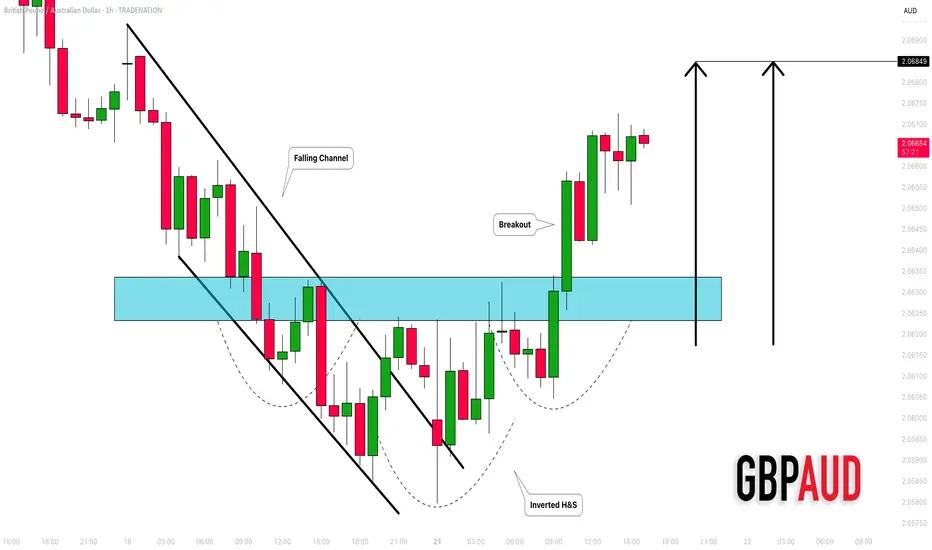
GBPAUD: Bullish Movement Continues 🇬🇧🇦🇺
GBPAUD is going to rise more, following a confirmed intraday bullish reversal:
first, the price violated a resistance line of a falling channel.
It started to consolidate within an inverted head & shoulders pattern then.
Its neckline violation is another strong bullish signal.
Next resistance - 2.0685
❤️Please, support my work with like, thank you!❤️
I am part of Trade Nation's Influencer program and receive a monthly fee for using their TradingView charts in my analysis.
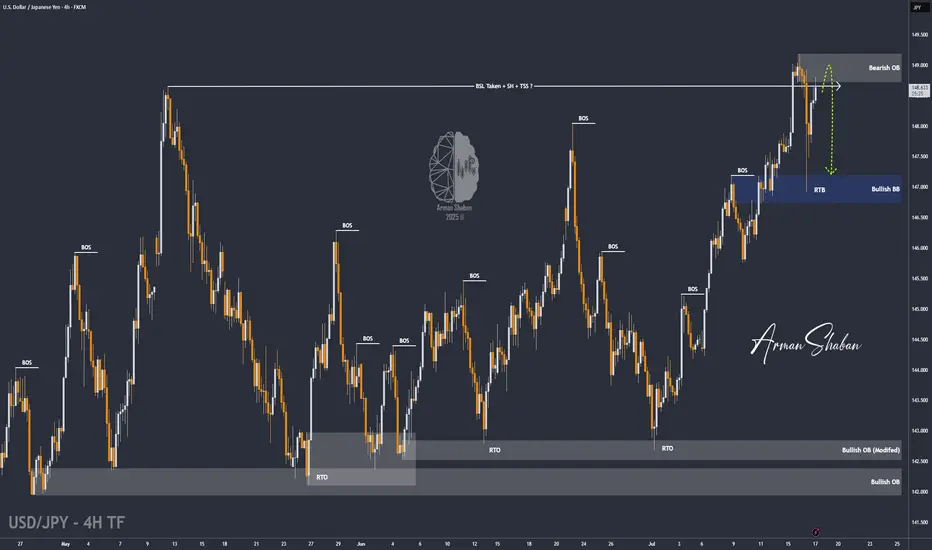
USD/JPY : Get Ready for another Fall ! (READ THE CAPTION)By analyzing the USDJPY chart on the 4-hour timeframe, we can see that after our last daily timeframe analysis, the price started its rally from the 144 zone and, as expected, hit all three targets at 145.5, 147.35, and 148.65, delivering over 500 pips in returns — even reaching as high as 149.2! Once the price broke above 148.65 and swept the liquidity above this level, it faced selling pressure and dropped to 146.9. Currently trading around 148.65, if USDJPY manages to hold below the supply zone between 148.65 and 149.2, we can expect further downside movement. This analysis will be updated with your support!
THE DAILY ANALYSIS :
Please support me with your likes and comments to motivate me to share more analysis with you and share your opinion about the possible trend of this chart with me !
Best Regards , Arman Shaban
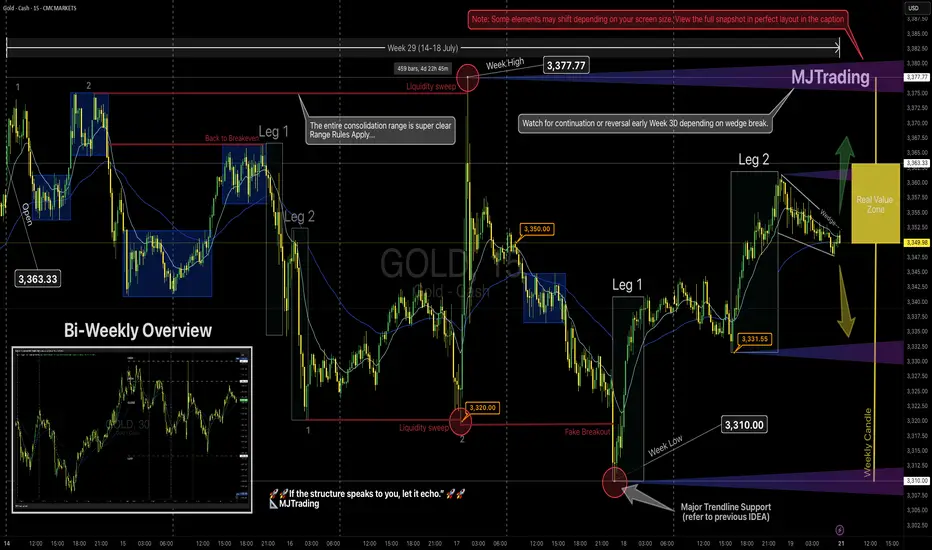
GOLD Weekly Recap (Week 29) – MJTrading View📸 Viewing Tip:
🛠️ Some layout elements may shift depending on your screen size.
🔗 View the fixed high-resolution chart here:
Now that you have got the perfect layout let's dive in...
📈 GOLD Weekly Recap (Week 29) – MJTrading View
🕰 Timeframe: 15min chart with bi-weekly perspective
📅 Period Covered: July 14–18 (Week 29)
🎯 Visual Framework: Leg structure, range boundaries, liquidity sweeps, trendline holds, and Real Value Zone.
🔹 Weekly Summary
Open: 3,363.33
High: 3,377.77 (🔴 sweep: trapped buyers)
Low: 3,310.00 (🔴 sweep into key demand + touching the main ascending trendline )
Close: 3,349.98~3350 (lovely round level)
Structure: Entire week played inside a broad consolidation range, with sharp but failed breakouts on both extremes.
Range rules applied: traps, sweeps, compression — everything aligned for responsive trading.
📌 Key Observations
Early Week:
A double-top structure led to rejection from ~3,375 → slid into 3,350.
Price returned to breakeven but then flushed hard toward 3,320 via a clean 2-leg drop.
Midweek:
After forming a double bottom, price created a tiny liquidity sweep, then exploded to the weekly high.
The move above 3,377.77 was a textbook liquidity grab, immediately rejected.
This led to a slide toward the weekly low, tagging both the trendline and consolidation floor — forming a false breakout + reversal.
Late Week:
The low at 3,310 was swept cleanly (🔴), followed by a leg-based reversal:
Leg 1: Up to 3,331
Leg 2: Extended to ~3,360 before fading back inside the range.
Compression:
Price closed inside the Real Value Zone (weekly candle body) — just under the open, forming a tight wedge, hinting at breakout conditions for Week 30.
🟨 Weekly Candle Body
Open → Close of weekly candle reflects Real Value Zone .
Highs and lows were swept, but real commitment stayed within the body.
🧭 Key Levels to Watch – Week 30
Level Role
3,377.77 Weekly High / Liquidity Sweep (🔴 rejection)
3,363.33 Weekly Open (break & hold = bullish bias) / Previous Weekly High
3,350.00 Micro resistance / Mid-structure cap / Round Level
3,331-3 Leg 2 low & first reaction zone / Round Level
3,320.00 Breakdown support / Flush origin
3,310.00 Weekly Low / Major Demand (🔴 sweep)
3,400.00 Next possible main target
3,282.00 Previous Weekly Low
Dynamics: Both Uptrend and Downtrend Lines...
🧠 MJTrading Notes
Bias remains neutral inside the range.
A break & acceptance above 3,363 could trigger a re-test of the sweep zone (3,377+).
A breakdown below 3,331 puts 3,320 → 3,310 back on the map then 3,282.
Don’t force direction — let expansion confirm itself.
🧭 “If the structure speaks to you, let it echo.”
– MJTrading 🚀
#MJTrading #ChartDesigner #GOLD #LiquiditySweep #PriceAction #StructureTrading #Weekly #Chart #Consolidation #2legs
🧠 Psychology always matters:
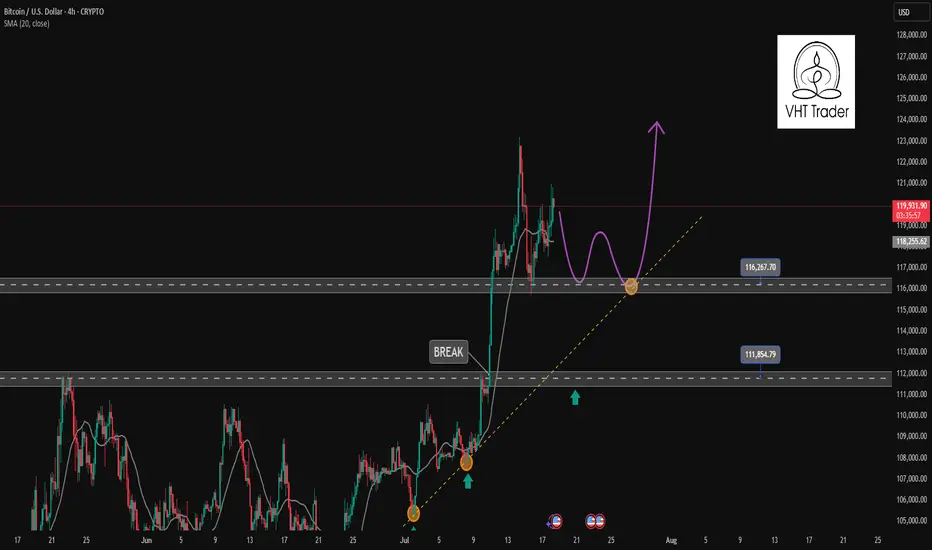
Find a recovery point to continue buying BTC✏️ CRYPTO:BTCUSD is trading near the all-time high. The trading strategy is to wait for some investors to take profit so that the price can return to the nearest support zones and continue to buy to the new all-time high zones.
📉 Key Levels
BUY Trigger: confirms the recovery from the support trend line 116000
BUY zone 112000 (Strong support zone)
Target 129000
Leave your comments on the idea. I am happy to read your views.
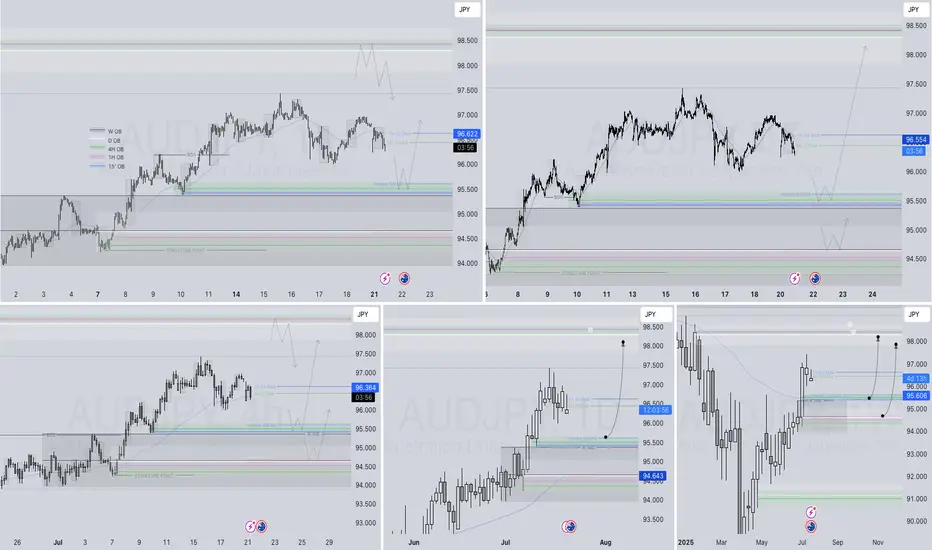
AUDJPY Q3 | D21 | W30 | Y25📊AUDJPY Q3 | D21 | W30 | Y25
Daily Forecast 🔍📅
Here’s a short diagnosis of the current chart setup 🧠📈
Higher time frame order blocks have been identified — these are our patient points of interest 🎯🧭.
It’s crucial to wait for a confirmed break of structure 🧱✅ before forming a directional bias.
This keeps us disciplined and aligned with what price action is truly telling us.
📈 Risk Management Protocols
🔑 Core principles:
Max 1% risk per trade
Only execute at pre-identified levels
Use alerts, not emotion
Stick to your RR plan — minimum 1:2
🧠 You’re not paid for how many trades you take, you’re paid for how well you manage risk.
🧠 Weekly FRGNT Insight
"Trade what the market gives, not what your ego wants."
Stay mechanical. Stay focused. Let the probabilities work.
FRGNT 📊
NASDAQ INDEX (US100): Bullish Continuation Confirmed
NASDAQ Index broke and closed above a resistance of a horizontal
parallel channel on a daily.
It confirms a bullish trend continuation and a highly probable growth
to the next strong resistance.
Goal - 23300
❤️Please, support my work with like, thank you!❤️

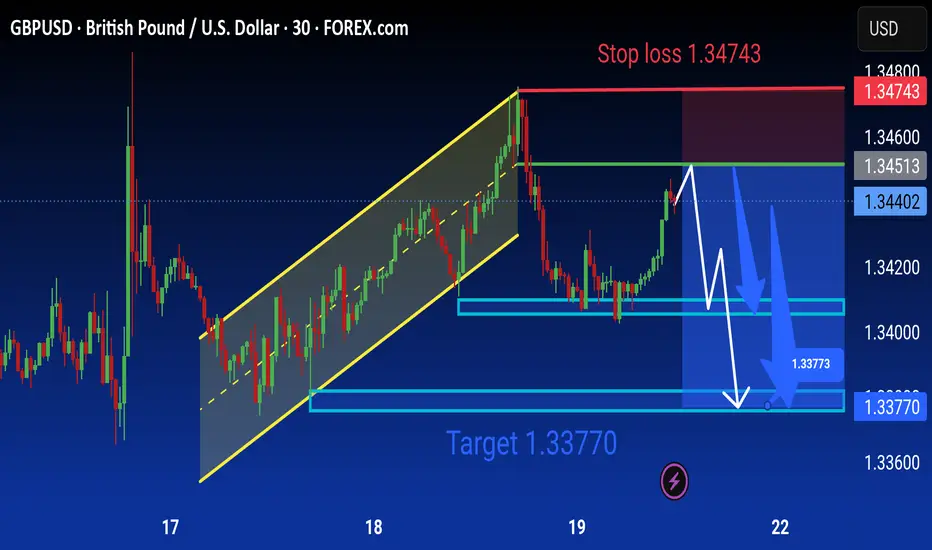
Gbpusd Analysis is Ready Move will be down technical analysis of the GBP/USD (British Pound/US Dollar) currency pair on the 30-minute timeframe using FOREX.com data. Here's a detailed breakdown of the analysis:
---
Chart Summary:
Current Price:
Sell: 1.34401
Buy: 1.34406
Timeframe: 30 minutes (M30)
Platform: TradingView with FOREX.com data
Technical Elements:
1. Ascending Channel (Yellow Parallel Lines):
Price was previously moving in an upward trend within this ascending channel.
The breakout to the downside indicates a potential trend reversal or correction.
2. Bearish Scenario (Blue Arrows):
The chart suggests a short (sell) setup.
Price is expected to face resistance around the 1.34513–1.34600 zone (marked by the green line).
A projected downward move is illustrated with blue arrows, targeting 1.33770.
3. Stop Loss:
Positioned at 1.34743 (highlighted in red), above the recent highs — managing risk for the sell position.
4. Support Zones (Blue Boxes):
First support area near 1.34000
Second, stronger support and main target at 1.33770
5. Target Label:
“Target 1.33770” is clearly marked in blue, showing the final expected move of the sell trade.
6. Forecast Path (White Lines):
Indicates potential short-term bullish pullback before continuing the bearish trend.
---
Trade Idea:
Sell GBP/USD near current resistance
Stop Loss: 1.34743
Take Profit (Target): 1.33770
Bias: Bearish short-term, following the channel breakout
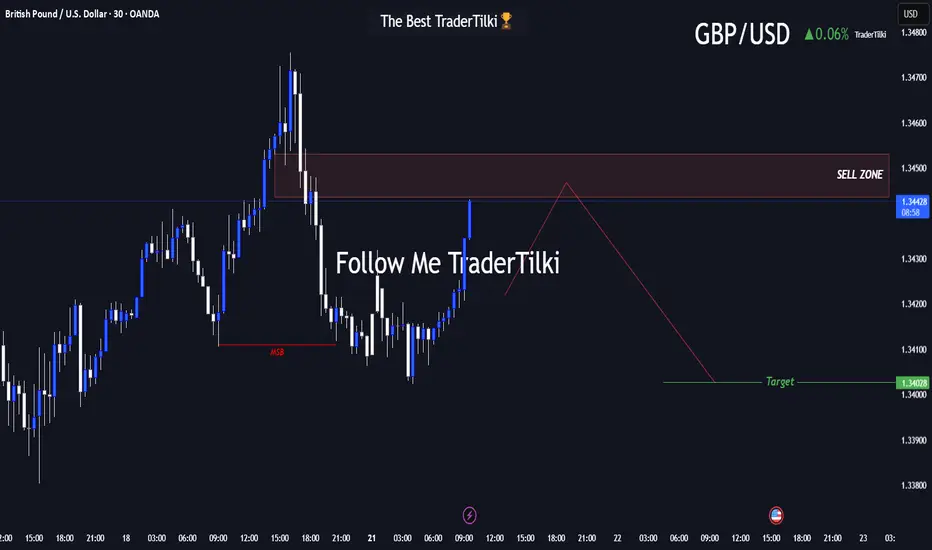
Major Levels Ahead: GBPUSD Trade Setup UnveiledHey friends, I’ve prepared a fresh GBPUSD analysis for you!
📍 Target level: 1.34028
🔻 SELL zone: Between 1.34532 and 1.34437
I expect the trade to reach its target during the London or New York session.
Every like and show of support fuels my motivation to share more analysis—thank you all for being part of this journey!
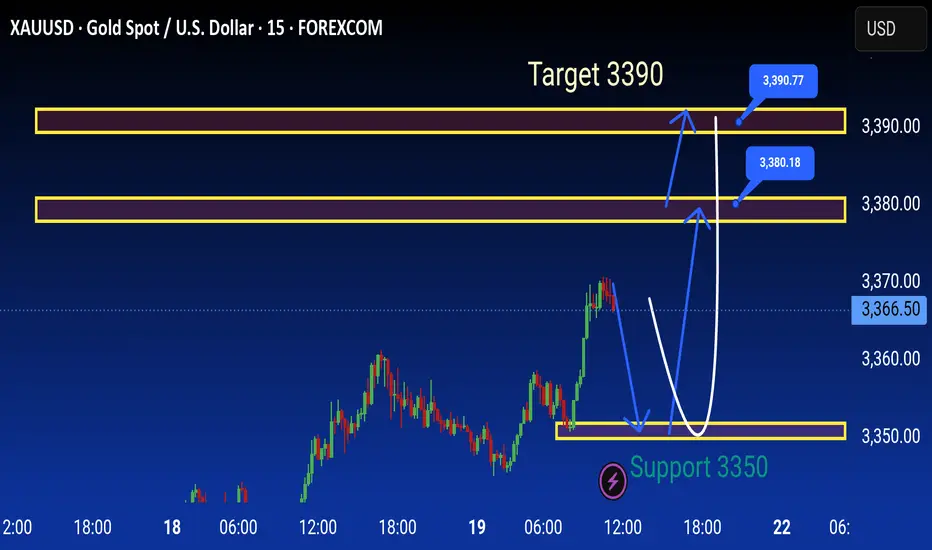
Xauusd Analysis is Ready technical analysis of XAUUSD (Gold Spot vs. US Dollar) on the 15-minute timeframe using support and resistance levels, with projected price movements annotated.
Key Levels:
Support Zone: Around 3350 USD (labeled as "Support 3350")
Resistance Zones:
Minor resistance: Around 3380.18 USD
Major resistance: Around 3390.77 USD
Target: 3390 USD, highlighted as the ultimate bullish goal.
Current Price:
Price at the time of analysis: ~3368.30 USD
Analysis Summary:
1. Support Retest Scenario:
Price may pull back to the 3350 support zone.
If this support holds, a bullish reversal is expected.
The anticipated move is a rebound back toward the resistance zone at 3380, and possibly to the target at 3390.
2. Immediate Bullish Continuation:
Alternatively, price could continue upwards from the current level without revisiting support.
Resistance around 3380 may act as a minor barrier.
If broken, the price could reach the target at 3390.
3. Bearish Risk:
If 3350 fails to hold as support, further downside may occur, invalidating the bullish setup.
Strategy Implication:
Buy positions could be considered on a successful retest and bounce at 3350.
Take-profits might be set near 3380 and 3390.
Traders should watch for price action confirmation at key levels before entering trades.
This is a classic support-resistance trading setup with short-term bullish bias aiming for a breakout toward higher resistance levels
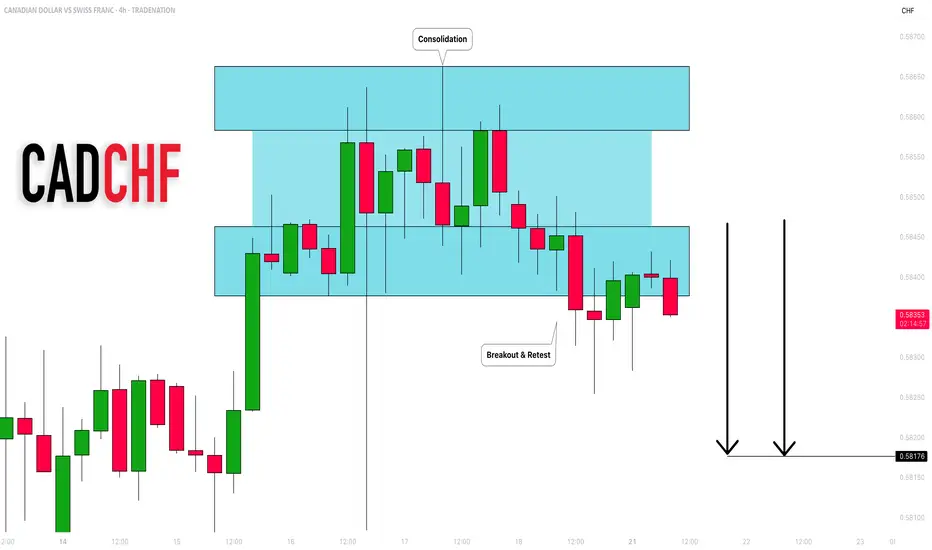
CADCHF: Bearish Outlook Explained 🇨🇦🇨🇭
CADCHF completed an intraday consolidation within a horizontal
parallel channel.
Its support was broken on Friday and we see a positive bearish
reaction to that after its retest.
With a high probability, the price will drop to 0.582 level soon.
❤️Please, support my work with like, thank you!❤️
I am part of Trade Nation's Influencer program and receive a monthly fee for using their TradingView charts in my analysis.
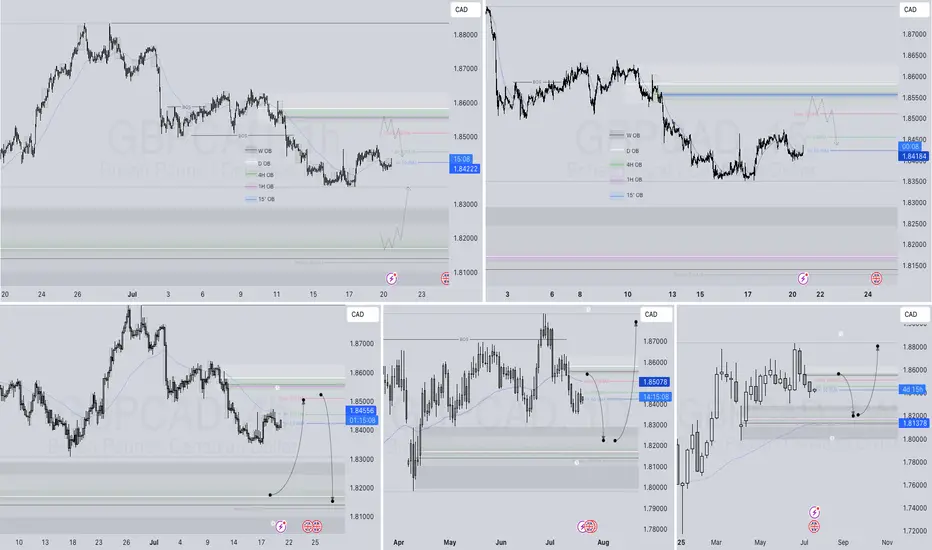
GBPCAD Q3 | D21 | W30 | Y25📊GBPCAD Q3 | D21 | W30 | Y25
Daily Forecast 🔍📅
Here’s a short diagnosis of the current chart setup 🧠📈
Higher time frame order blocks have been identified — these are our patient points of interest 🎯🧭.
It’s crucial to wait for a confirmed break of structure 🧱✅ before forming a directional bias.
This keeps us disciplined and aligned with what price action is truly telling us.
📈 Risk Management Protocols
🔑 Core principles:
Max 1% risk per trade
Only execute at pre-identified levels
Use alerts, not emotion
Stick to your RR plan — minimum 1:2
🧠 You’re not paid for how many trades you take, you’re paid for how well you manage risk.
🧠 Weekly FRGNT Insight
"Trade what the market gives, not what your ego wants."
Stay mechanical. Stay focused. Let the probabilities work.
FRGNT 📊
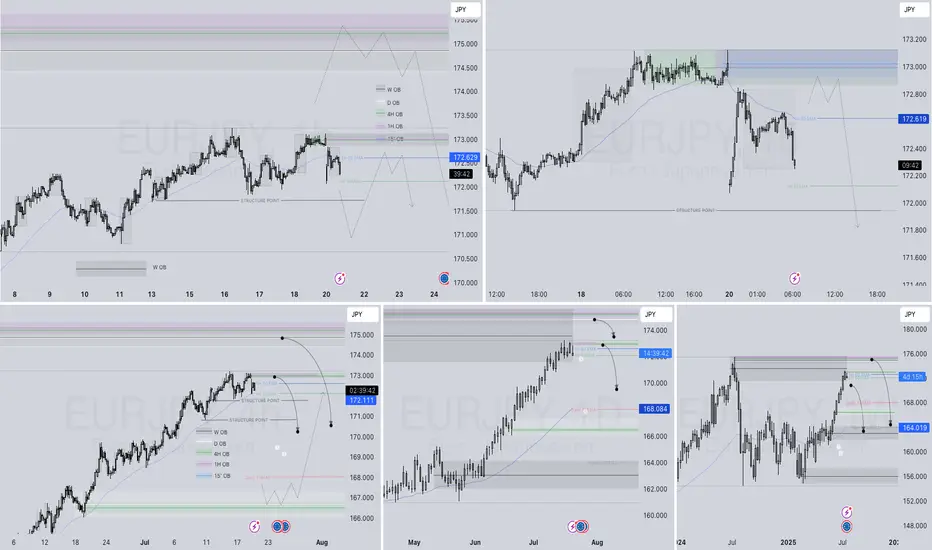
EURJPY Q3 | D21 | W30 | Y25📊EURJPY Q3 | D21 | W30 | Y25
Daily Forecast 🔍📅
Here’s a short diagnosis of the current chart setup 🧠📈
Higher time frame order blocks have been identified — these are our patient points of interest 🎯🧭.
It’s crucial to wait for a confirmed break of structure 🧱✅ before forming a directional bias.
This keeps us disciplined and aligned with what price action is truly telling us.
📈 Risk Management Protocols
🔑 Core principles:
Max 1% risk per trade
Only execute at pre-identified levels
Use alerts, not emotion
Stick to your RR plan — minimum 1:2
🧠 You’re not paid for how many trades you take, you’re paid for how well you manage risk.
🧠 Weekly FRGNT Insight
"Trade what the market gives, not what your ego wants."
Stay mechanical. Stay focused. Let the probabilities work.
FRGNT 📊
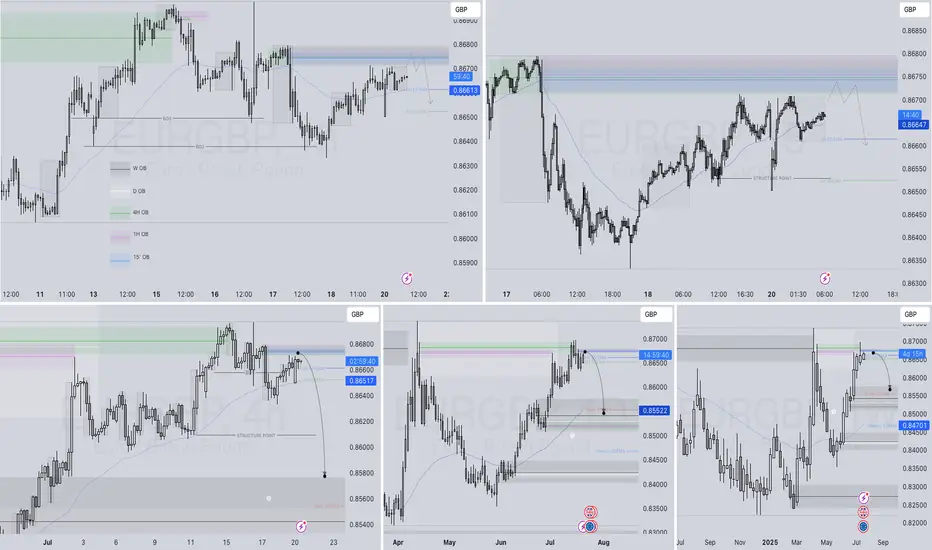
EURGBP Q3 | D21 | W30 | Y25📊EURGBP Q3 | D21 | W30 | Y25
Daily Forecast 🔍📅
Here’s a short diagnosis of the current chart setup 🧠📈
Higher time frame order blocks have been identified — these are our patient points of interest 🎯🧭.
It’s crucial to wait for a confirmed break of structure 🧱✅ before forming a directional bias.
This keeps us disciplined and aligned with what price action is truly telling us.
📈 Risk Management Protocols
🔑 Core principles:
Max 1% risk per trade
Only execute at pre-identified levels
Use alerts, not emotion
Stick to your RR plan — minimum 1:2
🧠 You’re not paid for how many trades you take, you’re paid for how well you manage risk.
🧠 Weekly FRGNT Insight
"Trade what the market gives, not what your ego wants."
Stay mechanical. Stay focused. Let the probabilities work.
FRGNT 📊
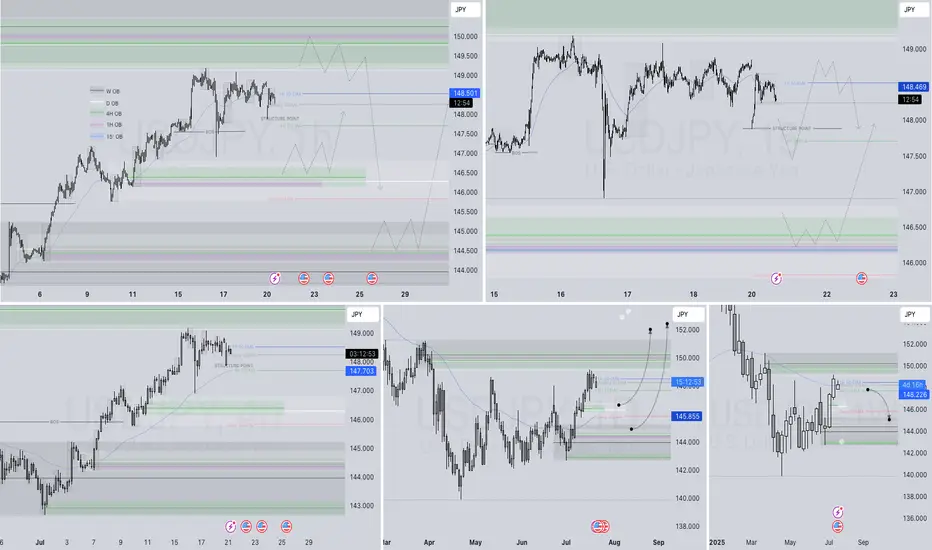
USDJPY Q3 | D21 | W30 | Y25📊USDJPY Q3 | D21 | W30 | Y25
Daily Forecast 🔍📅
Here’s a short diagnosis of the current chart setup 🧠📈
Higher time frame order blocks have been identified — these are our patient points of interest 🎯🧭.
It’s crucial to wait for a confirmed break of structure 🧱✅ before forming a directional bias.
This keeps us disciplined and aligned with what price action is truly telling us.
📈 Risk Management Protocols
🔑 Core principles:
Max 1% risk per trade
Only execute at pre-identified levels
Use alerts, not emotion
Stick to your RR plan — minimum 1:2
🧠 You’re not paid for how many trades you take, you’re paid for how well you manage risk.
🧠 Weekly FRGNT Insight
"Trade what the market gives, not what your ego wants."
Stay mechanical. Stay focused. Let the probabilities work.
FRGNT 📊
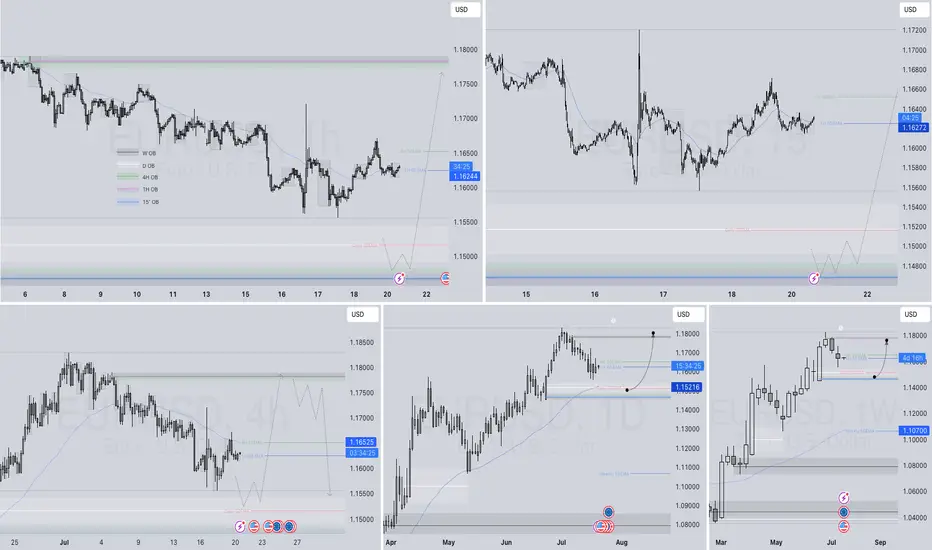
EURUSD Q3 | D21 | W30 | Y25 📊EURUSD Q3 | D21 | W30 | Y25
Daily Forecast 🔍📅
Here’s a short diagnosis of the current chart setup 🧠📈
Higher time frame order blocks have been identified — these are our patient points of interest 🎯🧭.
It’s crucial to wait for a confirmed break of structure 🧱✅ before forming a directional bias.
This keeps us disciplined and aligned with what price action is truly telling us.
📈 Risk Management Protocols
🔑 Core principles:
Max 1% risk per trade
Only execute at pre-identified levels
Use alerts, not emotion
Stick to your RR plan — minimum 1:2
🧠 You’re not paid for how many trades you take, you’re paid for how well you manage risk.
🧠 Weekly FRGNT Insight
"Trade what the market gives, not what your ego wants."
Stay mechanical. Stay focused. Let the probabilities work.
FRGNT 📊
Heading into overlap resistance?USD/JPY is rising towards the pivot and could reverse to the 1st support which has been identified as a pullback support.
Pivot: 151.42
1st Support: 146.67
1st Resistance: 154.34
Risk Warning:
Trading Forex and CFDs carries a high level of risk to your capital and you should only trade with money you can afford to lose. Trading Forex and CFDs may not be suitable for all investors, so please ensure that you fully understand the risks involved and seek independent advice if necessary.
Disclaimer:
The above opinions given constitute general market commentary, and do not constitute the opinion or advice of IC Markets or any form of personal or investment advice.
Any opinions, news, research, analyses, prices, other information, or links to third-party sites contained on this website are provided on an "as-is" basis, are intended only to be informative, is not an advice nor a recommendation, nor research, or a record of our trading prices, or an offer of, or solicitation for a transaction in any financial instrument and thus should not be treated as such. The information provided does not involve any specific investment objectives, financial situation and needs of any specific person who may receive it. Please be aware, that past performance is not a reliable indicator of future performance and/or results. Past Performance or Forward-looking scenarios based upon the reasonable beliefs of the third-party provider are not a guarantee of future performance. Actual results may differ materially from those anticipated in forward-looking or past performance statements. IC Markets makes no representation or warranty and assumes no liability as to the accuracy or completeness of the information provided, nor any loss arising from any investment based on a recommendation, forecast or any information supplied by any third-party.

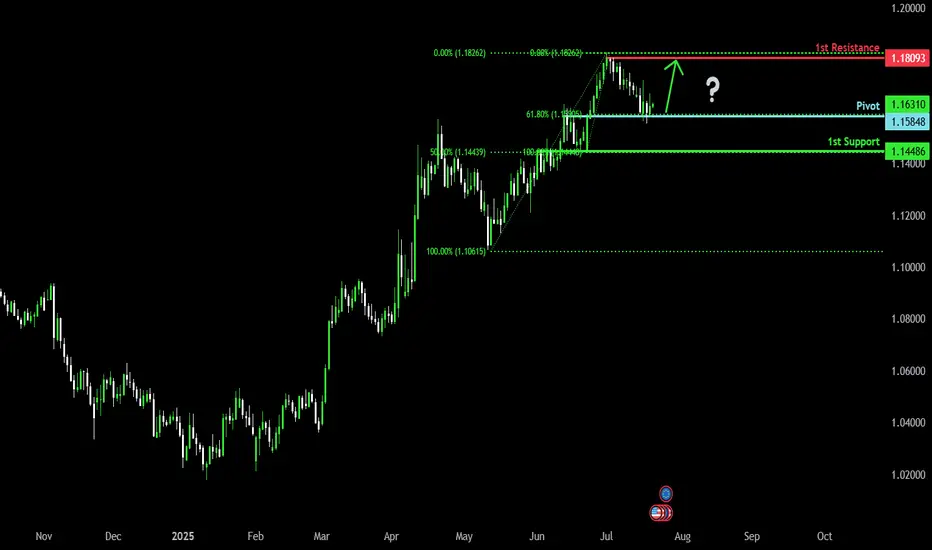
Bullish momentum to extend?The Fiber (EUR/USD) is reacting off the pivot which is a pullback support that aligns with the 61.8% Fibonacci retracement and could bounce to the 1st resistance.
Pivot: 1.1584
1st Support: 1.1448
1st Resistance: 1.1809
Risk Warning:
Trading Forex and CFDs carries a high level of risk to your capital and you should only trade with money you can afford to lose. Trading Forex and CFDs may not be suitable for all investors, so please ensure that you fully understand the risks involved and seek independent advice if necessary.
Disclaimer:
The above opinions given constitute general market commentary, and do not constitute the opinion or advice of IC Markets or any form of personal or investment advice.
Any opinions, news, research, analyses, prices, other information, or links to third-party sites contained on this website are provided on an "as-is" basis, are intended only to be informative, is not an advice nor a recommendation, nor research, or a record of our trading prices, or an offer of, or solicitation for a transaction in any financial instrument and thus should not be treated as such. The information provided does not involve any specific investment objectives, financial situation and needs of any specific person who may receive it. Please be aware, that past performance is not a reliable indicator of future performance and/or results. Past Performance or Forward-looking scenarios based upon the reasonable beliefs of the third-party provider are not a guarantee of future performance. Actual results may differ materially from those anticipated in forward-looking or past performance statements. IC Markets makes no representation or warranty and assumes no liability as to the accuracy or completeness of the information provided, nor any loss arising from any investment based on a recommendation, forecast or any information supplied by any third-party.
Bullish bounce?The Cable (GBP/USD) is falling towards the pivot and could bounce to the 1st resistance which is a pullback support.
Pivot: 1.3373
1st Support: 1.3116
1st Resistance: 1.3622
Risk Warning:
Trading Forex and CFDs carries a high level of risk to your capital and you should only trade with money you can afford to lose. Trading Forex and CFDs may not be suitable for all investors, so please ensure that you fully understand the risks involved and seek independent advice if necessary.
Disclaimer:
The above opinions given constitute general market commentary, and do not constitute the opinion or advice of IC Markets or any form of personal or investment advice.
Any opinions, news, research, analyses, prices, other information, or links to third-party sites contained on this website are provided on an "as-is" basis, are intended only to be informative, is not an advice nor a recommendation, nor research, or a record of our trading prices, or an offer of, or solicitation for a transaction in any financial instrument and thus should not be treated as such. The information provided does not involve any specific investment objectives, financial situation and needs of any specific person who may receive it. Please be aware, that past performance is not a reliable indicator of future performance and/or results. Past Performance or Forward-looking scenarios based upon the reasonable beliefs of the third-party provider are not a guarantee of future performance. Actual results may differ materially from those anticipated in forward-looking or past performance statements. IC Markets makes no representation or warranty and assumes no liability as to the accuracy or completeness of the information provided, nor any loss arising from any investment based on a recommendation, forecast or any information supplied by any third-party.

Bearish drop off 50% Fibonacci resistance?The US Dollar Index (DXY) is rising towards the pivot which acts as a pullback resistance and could drop to the 1st support.
Pivot: 99..15
1st Support: 96.54
1st Resistance: 100.57
Risk Warning:
Trading Forex and CFDs carries a high level of risk to your capital and you should only trade with money you can afford to lose. Trading Forex and CFDs may not be suitable for all investors, so please ensure that you fully understand the risks involved and seek independent advice if necessary.
Disclaimer:
The above opinions given constitute general market commentary, and do not constitute the opinion or advice of IC Markets or any form of personal or investment advice.
Any opinions, news, research, analyses, prices, other information, or links to third-party sites contained on this website are provided on an "as-is" basis, are intended only to be informative, is not an advice nor a recommendation, nor research, or a record of our trading prices, or an offer of, or solicitation for a transaction in any financial instrument and thus should not be treated as such. The information provided does not involve any specific investment objectives, financial situation and needs of any specific person who may receive it. Please be aware, that past performance is not a reliable indicator of future performance and/or results. Past Performance or Forward-looking scenarios based upon the reasonable beliefs of the third-party provider are not a guarantee of future performance. Actual results may differ materially from those anticipated in forward-looking or past performance statements. IC Markets makes no representation or warranty and assumes no liability as to the accuracy or completeness of the information provided, nor any loss arising from any investment based on a recommendation, forecast or any information supplied by any third-party.

Bullish bounce off pullback support?USD/CAD is falling towards the support level which is a pullback support that lines up with the 38.2% Fibonacci retracement and could bounce from this level to our take profit.
Entry: 1.3681
Why we like it:
There is a pullback support level that aligns with the 38.2% Fibonacci retracement.
Stop loss: 1.3645
Why we like it:
There is a pullback support that lines up with the 61.8% Fibonacci retracement.
Take profit: 1.3782
Why we like it:
There is a pullback resistance.
Enjoying your TradingView experience? Review us!
Please be advised that the information presented on TradingView is provided to Vantage (‘Vantage Global Limited’, ‘we’) by a third-party provider (‘Everest Fortune Group’). Please be reminded that you are solely responsible for the trading decisions on your account. There is a very high degree of risk involved in trading. Any information and/or content is intended entirely for research, educational and informational purposes only and does not constitute investment or consultation advice or investment strategy. The information is not tailored to the investment needs of any specific person and therefore does not involve a consideration of any of the investment objectives, financial situation or needs of any viewer that may receive it. Kindly also note that past performance is not a reliable indicator of future results. Actual results may differ materially from those anticipated in forward-looking or past performance statements. We assume no liability as to the accuracy or completeness of any of the information and/or content provided herein and the Company cannot be held responsible for any omission, mistake nor for any loss or damage including without limitation to any loss of profit which may arise from reliance on any information supplied by Everest Fortune Group.
