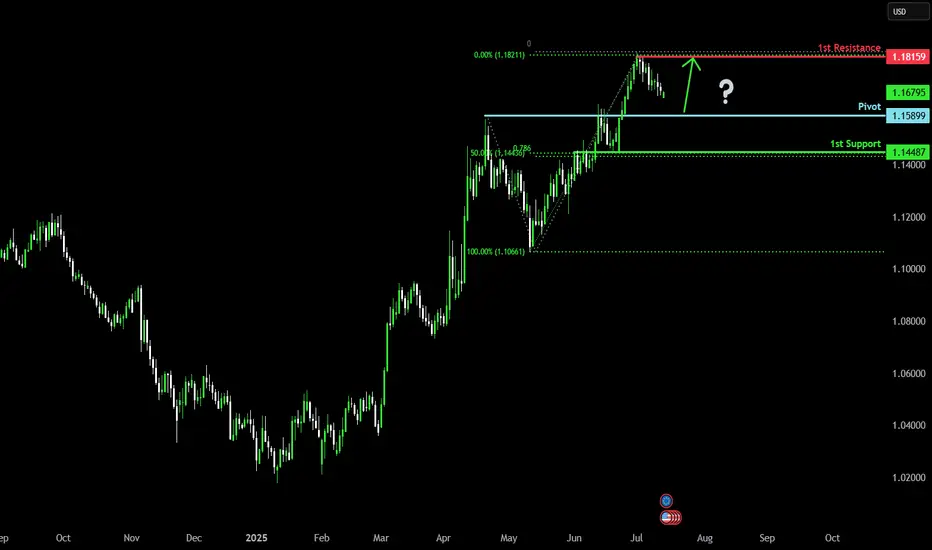
Bullish continuation?The Fiber (EUR/USD) is falling towards the pivot, which has been identified as a pullback support and could bounce to the 1st resistance.
Pivot: 1.1589
1st Support: 1.1448
1st Resistance: 1.1815
Risk Warning:
Trading Forex and CFDs carries a high level of risk to your capital and you should only trade with money you can afford to lose. Trading Forex and CFDs may not be suitable for all investors, so please ensure that you fully understand the risks involved and seek independent advice if necessary.
Disclaimer:
The above opinions given constitute general market commentary, and do not constitute the opinion or advice of IC Markets or any form of personal or investment advice.
Any opinions, news, research, analyses, prices, other information, or links to third-party sites contained on this website are provided on an "as-is" basis, are intended only to be informative, is not an advice nor a recommendation, nor research, or a record of our trading prices, or an offer of, or solicitation for a transaction in any financial instrument and thus should not be treated as such. The information provided does not involve any specific investment objectives, financial situation and needs of any specific person who may receive it. Please be aware, that past performance is not a reliable indicator of future performance and/or results. Past Performance or Forward-looking scenarios based upon the reasonable beliefs of the third-party provider are not a guarantee of future performance. Actual results may differ materially from those anticipated in forward-looking or past performance statements. IC Markets makes no representation or warranty and assumes no liability as to the accuracy or completeness of the information provided, nor any loss arising from any investment based on a recommendation, forecast or any information supplied by any third-party.
Forexsignals
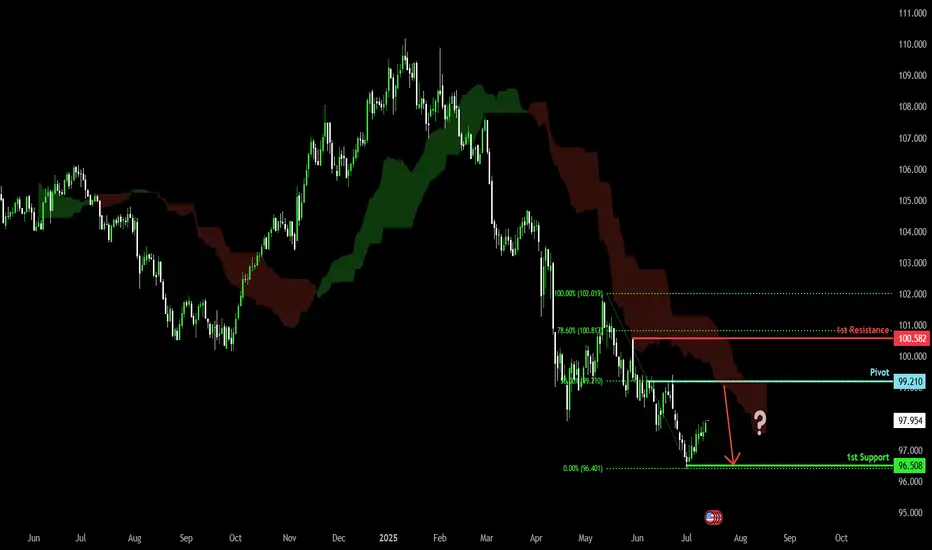
Bearish continuation?US Dollar Index (DXY) is risng towards the pivot which is a pullback resistance and could drop to the 1st support.
Pivot: 99.21
1st Support: 96.50
1st Resistance: 100.58
Risk Warning:
Trading Forex and CFDs carries a high level of risk to your capital and you should only trade with money you can afford to lose. Trading Forex and CFDs may not be suitable for all investors, so please ensure that you fully understand the risks involved and seek independent advice if necessary.
Disclaimer:
The above opinions given constitute general market commentary, and do not constitute the opinion or advice of IC Markets or any form of personal or investment advice.
Any opinions, news, research, analyses, prices, other information, or links to third-party sites contained on this website are provided on an "as-is" basis, are intended only to be informative, is not an advice nor a recommendation, nor research, or a record of our trading prices, or an offer of, or solicitation for a transaction in any financial instrument and thus should not be treated as such. The information provided does not involve any specific investment objectives, financial situation and needs of any specific person who may receive it. Please be aware, that past performance is not a reliable indicator of future performance and/or results. Past Performance or Forward-looking scenarios based upon the reasonable beliefs of the third-party provider are not a guarantee of future performance. Actual results may differ materially from those anticipated in forward-looking or past performance statements. IC Markets makes no representation or warranty and assumes no liability as to the accuracy or completeness of the information provided, nor any loss arising from any investment based on a recommendation, forecast or any information supplied by any third-party.
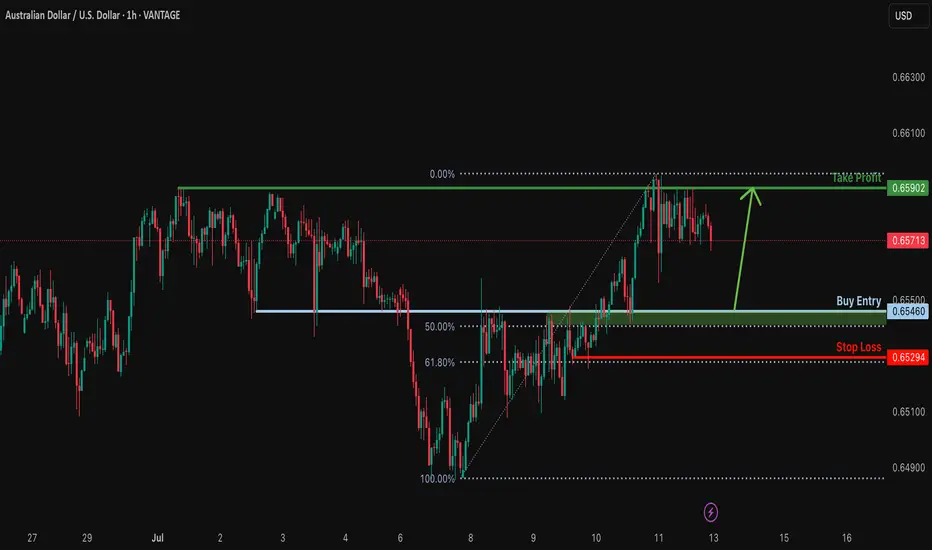
Bullish bounce off overlap support?AUD/USD is falling towards the support level which is an overlap support that is slightly above the 50% Fibonacci retracement and could bounce from this level too ur take profit.
Entry: 0.6546
Why we like it:
There is an overlap support that is slightly above the 50% Fibonacci retracement.
Stop loss: 0.6529
Why we like it:
There is a pullback support that aligns with the 61.8% Fibonacci retracement.
Take profit: 0.6590
Why we like it:
There is a pullback support.
Enjoying your TradingView experience? Review us!
Please be advised that the information presented on TradingView is provided to Vantage (‘Vantage Global Limited’, ‘we’) by a third-party provider (‘Everest Fortune Group’). Please be reminded that you are solely responsible for the trading decisions on your account. There is a very high degree of risk involved in trading. Any information and/or content is intended entirely for research, educational and informational purposes only and does not constitute investment or consultation advice or investment strategy. The information is not tailored to the investment needs of any specific person and therefore does not involve a consideration of any of the investment objectives, financial situation or needs of any viewer that may receive it. Kindly also note that past performance is not a reliable indicator of future results. Actual results may differ materially from those anticipated in forward-looking or past performance statements. We assume no liability as to the accuracy or completeness of any of the information and/or content provided herein and the Company cannot be held responsible for any omission, mistake nor for any loss or damage including without limitation to any loss of profit which may arise from reliance on any information supplied by Everest Fortune Group.
Falling towards major support?The Cable (GBP/USD) is falling towards the support which is an overlap support that lines up with the 78.6% Fibonacci projection and could bounce from this level to our take profit.
Entry: 1.3396
Why we like it:
There is an overlap support that lines up with the 78.6% Fibonacci projection.
Stop loss: 1.3318
Why we like it:
There is a pullback support.
Take profit: 1.3503
Why we like it:
There is a pullback support.
Enjoying your TradingView experience? Review us!
Please be advised that the information presented on TradingView is provided to Vantage (‘Vantage Global Limited’, ‘we’) by a third-party provider (‘Everest Fortune Group’). Please be reminded that you are solely responsible for the trading decisions on your account. There is a very high degree of risk involved in trading. Any information and/or content is intended entirely for research, educational and informational purposes only and does not constitute investment or consultation advice or investment strategy. The information is not tailored to the investment needs of any specific person and therefore does not involve a consideration of any of the investment objectives, financial situation or needs of any viewer that may receive it. Kindly also note that past performance is not a reliable indicator of future results. Actual results may differ materially from those anticipated in forward-looking or past performance statements. We assume no liability as to the accuracy or completeness of any of the information and/or content provided herein and the Company cannot be held responsible for any omission, mistake nor for any loss or damage including without limitation to any loss of profit which may arise from reliance on any information supplied by Everest Fortune Group.

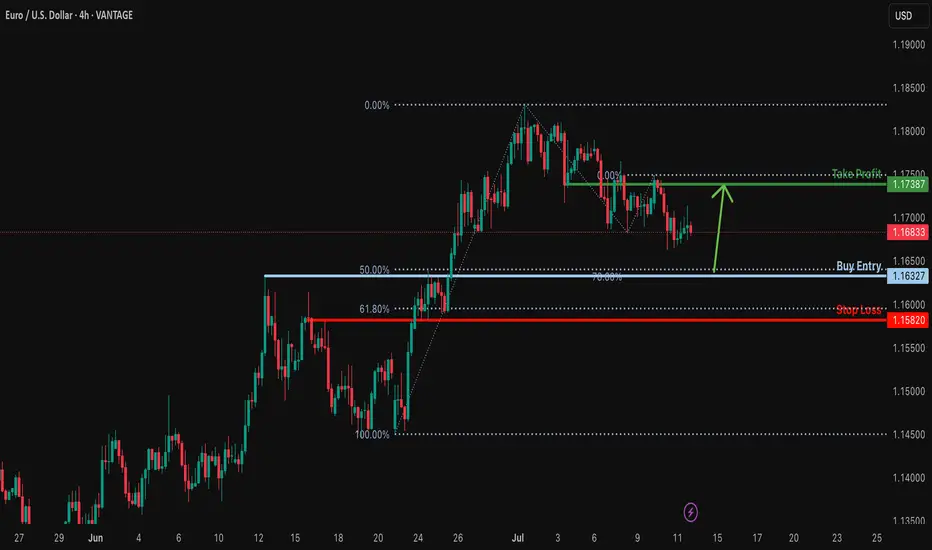
Bullish bounce off 50% Fibonacci support?EUR/USD is falling towards the support level which is a pullback support that lines up with the 50% Fibonacci support and could bounce from this level to our take profit.
Entry: 1.1632
Why we like it:
There is a pullback support that lines up with the 50% Fibonacci retracement.
Stop loss: 1.1582
Why we like it:
There is an overlap support that is slightly below the 61.8% Fibonacci retracement.
Take profit: 1.1738
Why we like it:
There is an overlap resistance.
Enjoying your TradingView experience? Review us!
Please be advised that the information presented on TradingView is provided to Vantage (‘Vantage Global Limited’, ‘we’) by a third-party provider (‘Everest Fortune Group’). Please be reminded that you are solely responsible for the trading decisions on your account. There is a very high degree of risk involved in trading. Any information and/or content is intended entirely for research, educational and informational purposes only and does not constitute investment or consultation advice or investment strategy. The information is not tailored to the investment needs of any specific person and therefore does not involve a consideration of any of the investment objectives, financial situation or needs of any viewer that may receive it. Kindly also note that past performance is not a reliable indicator of future results. Actual results may differ materially from those anticipated in forward-looking or past performance statements. We assume no liability as to the accuracy or completeness of any of the information and/or content provided herein and the Company cannot be held responsible for any omission, mistake nor for any loss or damage including without limitation to any loss of profit which may arise from reliance on any information supplied by Everest Fortune Group.
Week of 7/13/25: EURUSD AnalysisLast week's candle was a bearish engulfing meaning that most likely price will continue lower this week as a daily trend retracement. Waiting for LTF bearish price action before entering.
Major News:
Tuesday - CPI
Wednesday - PPI
Thursday - Unemployment

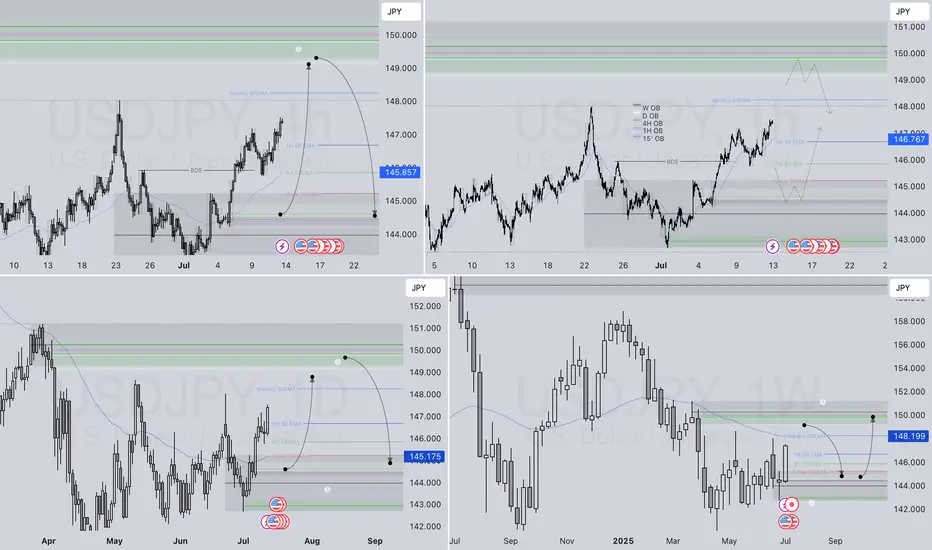
USDJPY LONG & SHORT – WEEKLY FORECAST Q3 | W29 | Y25
💼 USDJPY LONG & SHORT – WEEKLY FORECAST
Q3 | W29 | Y25
📊 MARKET STRUCTURE SNAPSHOT
USDJPY is currently reaching for a key higher time frame supply zone, looking for price action to show weakness at premium levels. Structure and momentum are now aligning for a short opportunity backed by multi-timeframe confluence.
🔍 Confluences to Watch 📝
✅ Daily Order Block (OB)
Looking for Strong reaction and early signs of distribution.
✅ 4H Order Block
Break of internal structure (iBoS) confirms a short-term bearish transition.
✅ 1H Order Block
📈 Risk Management Protocols
🔑 Core principles:
Max 1% risk per trade
Only execute at pre-identified levels
Use alerts, not emotion
Stick to your RR plan — minimum 1:2
🧠 You’re not paid for how many trades you take, you’re paid for how well you manage risk.
🧠 Weekly FRGNT Insight
"Trade what the market gives, not what your ego wants."
Stay mechanical. Stay focused. Let the probabilities work.
🏁 Final Thoughts from FRGNT
📌 The structure is clear.
The confluences are stacked.
Let execution follow discipline, not emotion.
Week of 7/13/25: AUDUSD AnalysisLast week pushed bullish and demand is still in control on all time frames, so we are going to follow bullish order flow.
Looking for bottom liquidity to be taken in the local range before getting in on a long.
Major News:
Tuesday - CPI
Wednesday - PPI
Thursday - Unemployment

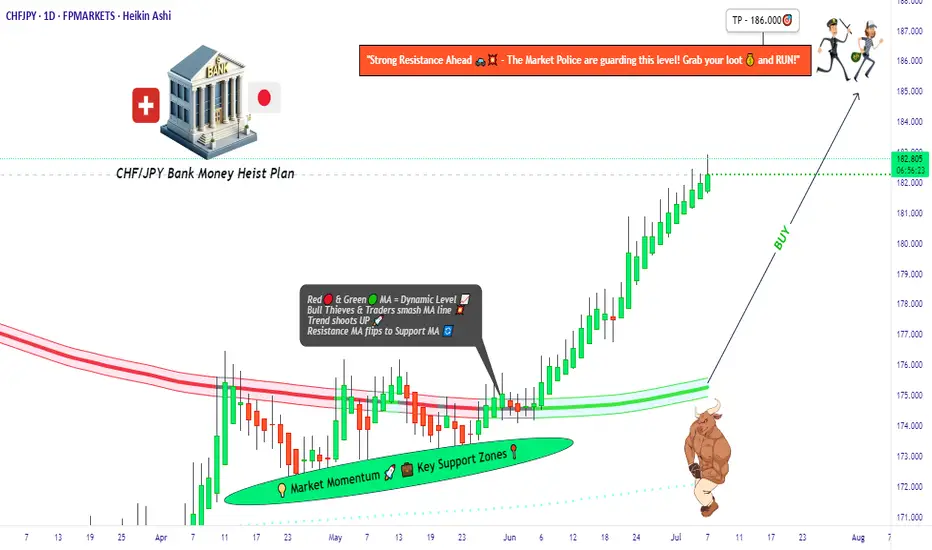
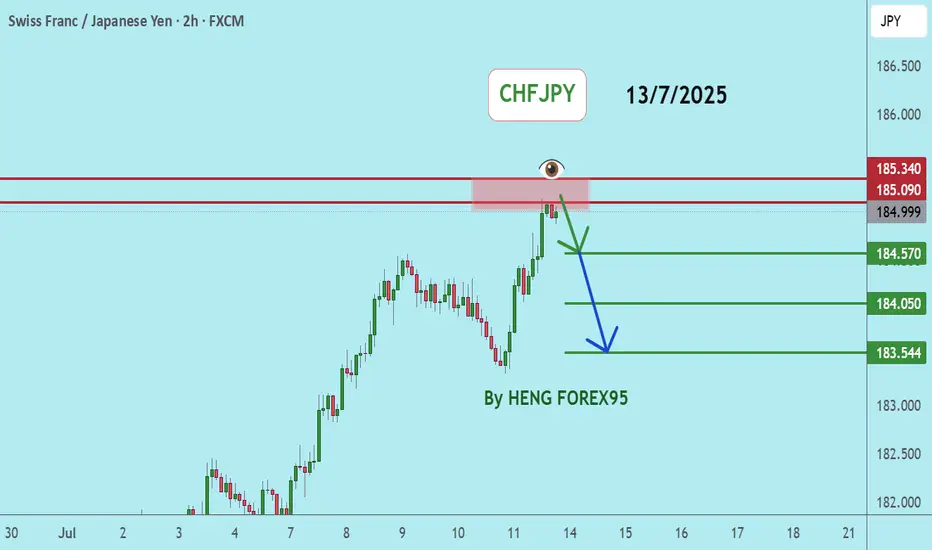
Bullish CHF/JPY Heist! Risk vs. Reward Setup💰 SWISS-YEN BANK HEIST! 🚨 CHF/JPY Bullish Raid Plan (Risk & Reward Setup)
🌟 Attention Market Pirates & Profit Raiders! 🌟
"The vault is unlocked—time to loot!"
🔎 THIEF TRADING ANALYSIS (CHF/JPY)
Entry (📈): "The Bullish Loot is LIVE!"
Buy limit orders within 15-30min pullbacks (recent swing lows/highs).
Aggressive? Enter anywhere—heist mode activated!
Stop Loss (🛑): Recent swing low (wick) – adjust based on your risk & lot size!
🎯 Target: 186.300 (High-risk Red Zone – Police Resistance!)
Overbought? Reversal risk? Bears lurking? Yes. But thieves play smart!
🏴☠️ SCALPERS & SWING RAIDERS:
Scalp ONLY Long (Use trailing SL to lock profits).
Low on ammo? Join swing traders for the big heist!
📡 FUNDAMENTAL BACKUP (Why This Heist?)
Bullish momentum in play (check COT, Macro, Sentiment).
News Alert (⚠️): Avoid new trades during high-impact news—trail your SL!
💥 BOOST THE HEIST!
Hit 👍 LIKE & 🔄 SHARE to strengthen our robbery squad!
More heists coming—stay tuned! 🚀
⚠️ DISCLAIMER:
Not financial advice. Risk = Reward. Adjust SL/targets based on your strategy. Market conditions change—adapt or get caught!
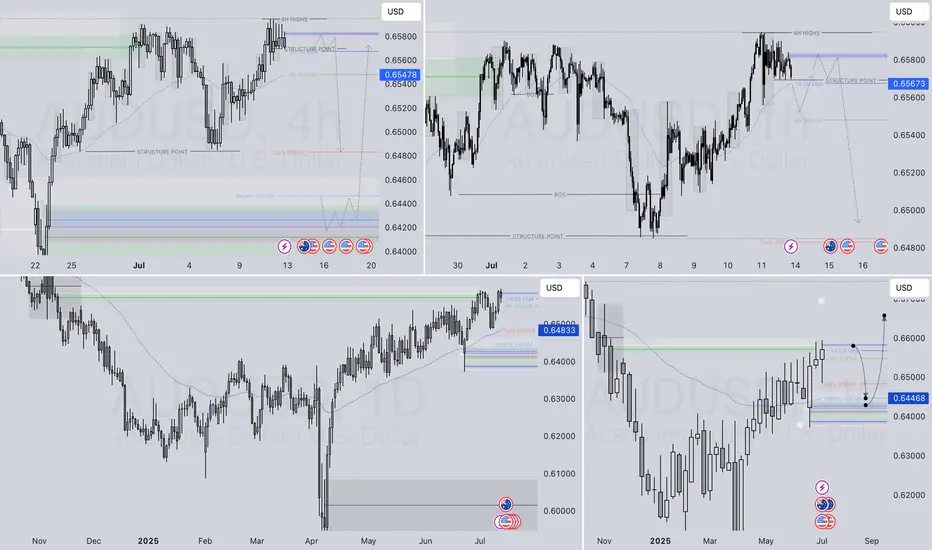
AUDUSD SHORT & LONG – WEEKLY FORECAST Q3 | W 29 | Y25💼 AUDUSD SHORT & LONG – WEEKLY FORECAST
Q3 | W 29 | Y25
📊 MARKET STRUCTURE OVERVIEW
AUDUSD is currently trading around a previously mitigated Daily and 4H Order Block zone.
Price has shown signs of short-term bearish momentum on lower timeframes (1H & 15m), but the broader structure still allows for bullish re-entries from deeper discounted levels.
We’re entering a key decision zone with potential for both short and long opportunities, depending on intraday confirmation.
🔍 Confluences to Watch 📝
✅ Daily OB – Previously Mitigated
Larger structure still holds room for bullish continuation if key internal supports hold.
✅ 4H OB – Mitigated with Initial Rejection
✅ 1H & 15m OBs – Valid for Intraday Shorts
Clean bearish structure on intraday timeframes.
Potential shorts available
📈 Risk Management Protocols
🔑 Core Principles
Risk per trade: Max 1%
Only act at planned levels — never chase
RR minimum: 1:2
Use scaling techniques on intraday shorts, and hold conviction for swings when structure confirms
🧠 Your risk plan is your protection. Without it, your strategy is meaningless.
🧠 Weekly FRGNT Insight
“Bias is flexible. Discipline is not.”
Adapt to what price gives — but never abandon your risk framework.
🏁 Final Thoughts from FRGNT
📌 Both short and long opportunities are valid this week.
📌 Choose your bias based on structure + confirmation.
📌 Let the order flow lead and risk management guide.
❤️ Stay sharp, stay structured. I’ll see you at the very top.
🎯 Trade consistent. FRGNT X
Stealing Pips Like a Pro – AUD/NZD Long Heist, MA Breakout Setup🎯 AUD/NZD Heist: Bullish Bank Robbery 🚀💰 (Thief Trading Style)
🌟 Hi! Hola! Ola! Bonjour! Hallo! Marhaba! 🌟
Dear Money Makers & Robbers, 🤑💸✈️
Based on 🔥Thief Trading Style🔥 (technical + fundamental analysis), here’s our master plan to loot the AUD/NZD "Aussie vs Kiwi" Forex Bank!
🔎 The Heist Setup (Long Entry Focus)
🐂 Bullish Breakout Strategy:
Entry: Wait for MA breakout (1.08150) then strike!
Alternative Entry: Place Buy Stop above MA OR Buy Limit near pullback zones (15-30min timeframe).
Pro Tip: Set an ALERT for breakout confirmation!
🛑 Stop Loss (Thief’s Safety Net):
"Yo, listen up! 🗣️ If you're entering via Buy Stop, don’t set SL until after breakout!
Thief’s SL Zone: Nearest swing low (1.07500 – 3H timeframe).
Adjust SL based on your risk, lot size, and trade plan.
🎯 Profit Targets:
1st Target: 1.08600 (or escape earlier if cops lurk!).
Scalpers: Only scalp LONG! Use trailing SL to protect gains.
⚠️ Critical Heist Rules:
Avoid news chaos! 🚨 No new trades during high-impact news.
Lock profits with trailing stops.
Cops (Bears) are strong near resistance – don’t get caught!
💥 Boost the Heist!
💖 Hit the "Boost" button to strengthen our robbery squad! More likes = more 💰easy money heists!
Stay tuned for the next big steal! 🏆🚀🐱👤

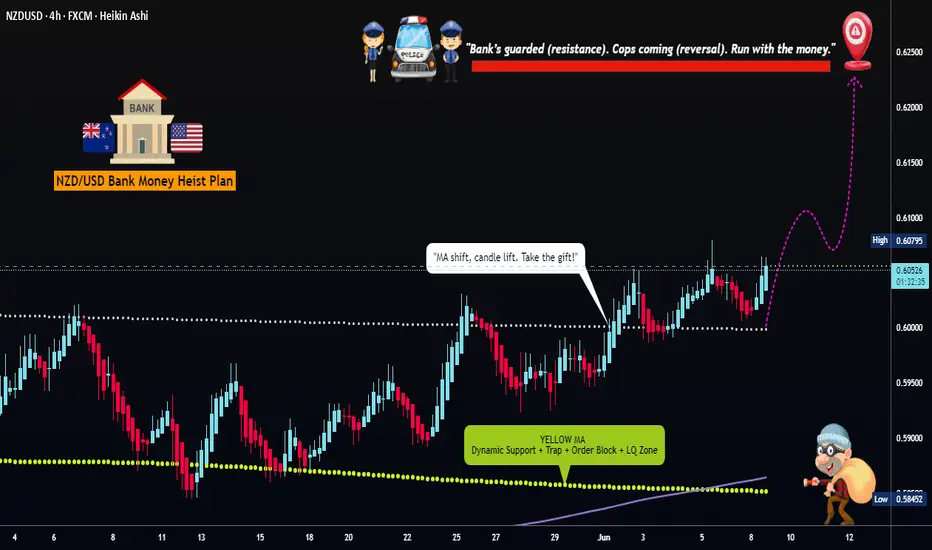
"Vault Breached! NZD/USD Bullish Loot (Live Heist)"🚨 "THE KIWI BANK HEIST" 🏦💰
NZD/USD Bullish Raid – Loot Fast Before the Cops Arrive!
🌟 Greetings, Money Bandits! 🌟 (Hola! Bonjour! Ciao! Konnichiwa!)
🔥 Thief Trading Intel:
The Vault is Open! 🏦➡️📈 – Price is bullish, but overbought.
Red Zone = Police Trap! 🚨 (Resistance/Reversal Risk)
Escape Plan: Take profits near 0.62400 (or bail early if traps trigger).
🔐 ENTRY: "BREAK IN NOW!"
"Buy the dip!" – Use 15M/30M swing lows for stealthy entries.
Set Alerts! ⏰ (Don’t miss the heist!)
🛑 STOP-LOSS: "THIEF’S SAFETY NET"
"Hide at 0.59500 (4H Swing Low)" – Adjust based on your loot size!
🎯 TARGET: "GRAB & VANISH!"
"0.62400 or escape earlier!" – Don’t get greedy; cops (bears) are lurking.
⚡ SCALPERS’ NOTE:
"Only steal LONG!" – Use trailing SL to protect your bag.
"Rich? Charge in! Poor? Wait for swings!"
📡 FUNDAMENTAL BACKUP:
"Kiwi is bullish… but check the news!" 📰 (COT, Macro Data, Sentiment)
⚠️ ALERT: Avoid trading during high-impact news – cops (volatility) love chaos!
💥 BOOST THIS HEIST! (Like & Share = More Loot!)
🚀 "Support the crew! Hit 👍, and let’s rob this market blind!" 💸🤝
Next heist coming soon… Stay tuned, bandits! 🏴☠️🎭
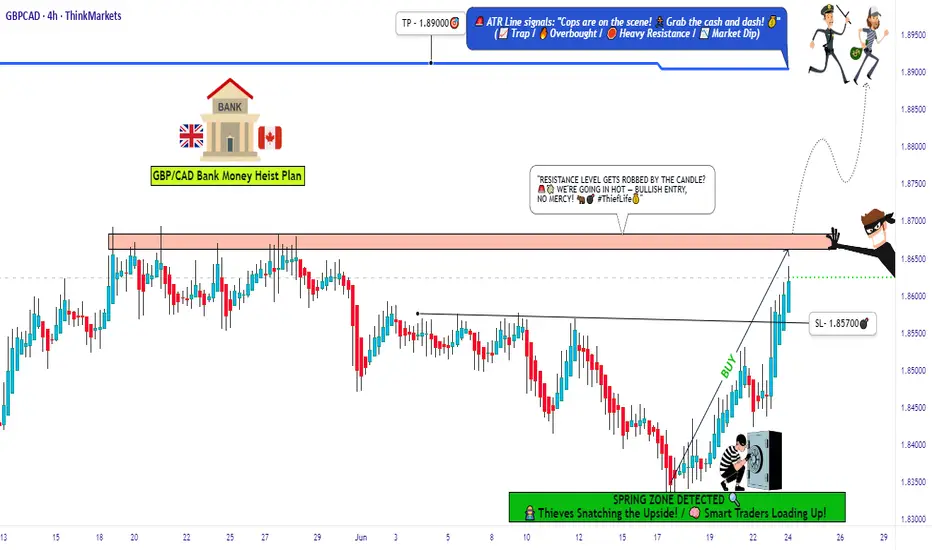
GBP/CAD: Smart Money Heist Strategy – Ready for the Breakout?💼💣 GBP/CAD Forex Bank Heist Plan 🚨 | "Thief Trading Style" 💹💰
🌟 Hi! Hola! Ola! Bonjour! Hallo! Marhaba! 🌟
Welcome to all strategic traders, market tacticians & opportunity seekers! 🧠💸
Here’s our latest Forex blueprint based on the exclusive “Thief Trading Style” – a blend of tactical technicals, smart fundamentals, and stealthy price action moves. We’re preparing for a potential breakout heist on the GBP/CAD a.k.a “The Pound vs Loonie”.
🗺️ Heist Strategy Overview:
The market is forming a bullish setup with signs of consolidation, breakout potential, and trend reversal dynamics. We're eyeing a long entry, but timing is everything. This setup seeks to "enter the vault" just as resistance is breached and ride the move until the ATR High-Risk Zone—where many market players may exit.
🎯 Entry Plan:
📈 Primary Trigger Zone: Watch for a break and close above 1.87000.
🛎️ Set an alert! You’ll want to be ready when the opportunity knocks.
📍Entry Tips:
Place Buy Stop orders above the moving average or
Use Buy Limit entries on pullbacks near recent 15/30min swing lows.
(Perfect for both scalpers and swing traders!)
🛑 Stop Loss Placement:
Thief Trading Style uses a flexible SL system:
Recommended SL at the nearest 4H swing low (~1.85700)
Adjust SL based on your lot size, risk appetite & number of orders
🎤 Reminder: Set SL after breakout confirmation for buy-stop entries. No fixed rule—adapt to your style but manage risk wisely.
🎯 Target Zone:
🎯 Primary TP: 1.89000
🏃♂️ Or exit earlier if price enters a high-risk reversal area
🧲 Scalpers: Stick to long-side trades only and protect your profits with a trailing SL.
🔍 Why GBP/CAD? (Fundamental Notes):
Current momentum is bullish, supported by:
📊 Quant & Sentiment Analysis
📰 Macro Fundamentals & COT Data
📈 Intermarket Trends & Technical Scoring
Get the full data klick it 🔗
⚠️ Caution During News:
To avoid volatility spikes:
Refrain from entering new positions during high-impact news
Use trailing SLs to protect running profits
❤️ Show Support & Stay Tuned:
Smash the 🔥Boost Button🔥 if you love this kind of analysis!
Support the strategy, strengthen our community, and let’s continue this journey of smart, stylish trading.
Stay tuned for the next “heist plan” update—trade smart, stay alert, and manage your risk like a pro. 🏆📈🤝
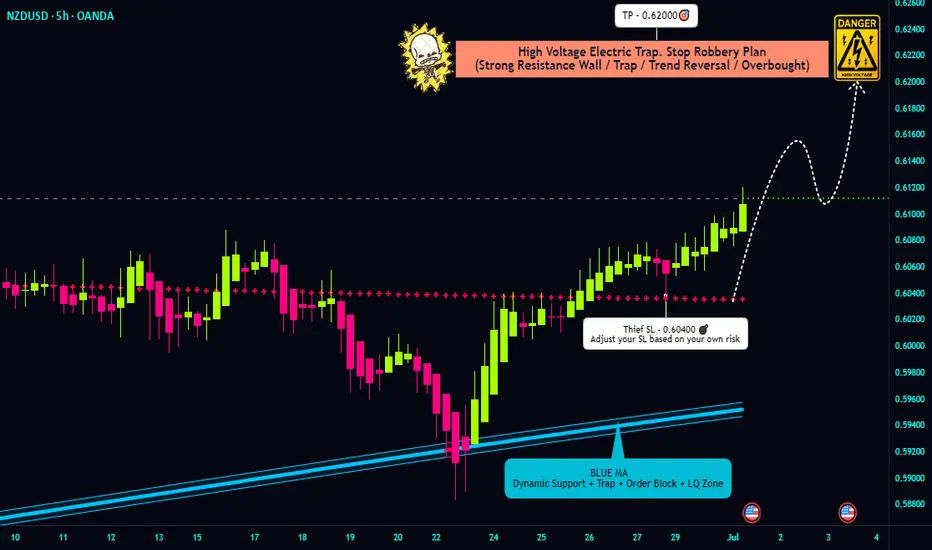
"NZD/USD Bullish Heist! Steal Pips Before the Reversal Trap! 🏴☠️ NZD/USD Kiwi Heist Masterplan – Steal the Bull Run! 💰
🌟 Hola, Money Makers & Market Marauders! 🌟
Welcome to the Thief Trading Style raid on the NZD/USD "The Kiwi" Forex vault. Follow the blueprint sketched in the chart for a bold long takeover — escape the high‑risk Yellow MA Zone before guards tighten!
🎯 Heist Blueprint
1. Entry 🚀
"The vault swings wide—yank that Bull loot at any price!"
Drop your buy-limit orders within the next 15–30 min (or at the latest swing low/high). Don’t sleep—set chart alerts for the perfect breach.
2. Stop‑Loss 🛑
Thief-style SL lurks at the nearest 5h swing‑low wick (≈ 0.60400) for intra‑day.
Adjust your SL based on your risk appetite, position size, and combo of orders.
3. Target 🎯
Aim to escape by 0.62000, or bail early for safety.
4. Scalpers’ Edge 🔍
Only rob on the long side. Big bankroll? Go all‑in. Prefer safety? Slide into the swing crew with a trailing SL to lock in your spoils.
🔍 Market Intel
Why the Kiwi Loot is Ripe:
Bullish momentum marches on, fueled by macroeconomic clues, COT data, sentiment shifts, inter-market moves — all pointing upward.
📚 For Full Recon:
Dive into the fundamental, macro, COT, quant, sentiment & intermarket intel — plus trend targets and scorecards. Check the data here 👉🔗🔗
⚠️ Caution Zone
News Watch & Position Safety:
Major news = guarded vault. Don't open new trades during release windows.
If you're in already, use trailing stops to shield your haul and lock in gains.
💪 Support the Crew
Smash that “Boost” to fuel our team and keep the raid running smooth. With Thief Trading Style, every day’s a payday.
🗓️ Stay tuned for the next Kiwi Heist – we’re just getting started. Happy robbing, legends! 🐱👤💥
CHFJPYCHFJPY price is in a very bullish trend. At the current price, there may be short-term selling. Therefore, if the price cannot break through 185.34, it is expected that the price will drop. Consider selling the red zone.
🔥Trading futures, forex, CFDs and stocks carries a risk of loss.
Please consider carefully whether such trading is suitable for you.
>>GooD Luck 😊
❤️ Like and subscribe to never miss a new idea!
Gold just played an interesting game on the 4-hour chart!🚨 GOLD Technical Outlook – 4H Chart Insight! 🕵️♂️✨
📉 First, we spotted a Bearish Engulfing pattern that created a strong Sell Zone, signaling downward pressure. But guess what? The market wasn't ready to give up just yet…
📈 From the lower end, a powerful Bullish Engulfing stepped in like a hero, offering solid support and pushing the market back up!
Now here's where it gets exciting:
🔥 Gold has formed another bullish engulfing pattern, and the price is once again knocking on the door of that Sell Zone.
🤔 What's next?
A rejection from this sell zone could trigger another drop 📉
But keep an eye on the overlapping support zone below — if price revisits and holds there, we could see a bullish bounce toward the upside again! 🚀
📌 Key takeaway: We’re at a decision point. The next move could be explosive — up or down. Stay sharp! 🔍
⚠️ DYOR – Do Your Own Research! 🚫 This is not financial advice — just a trader's perspective.

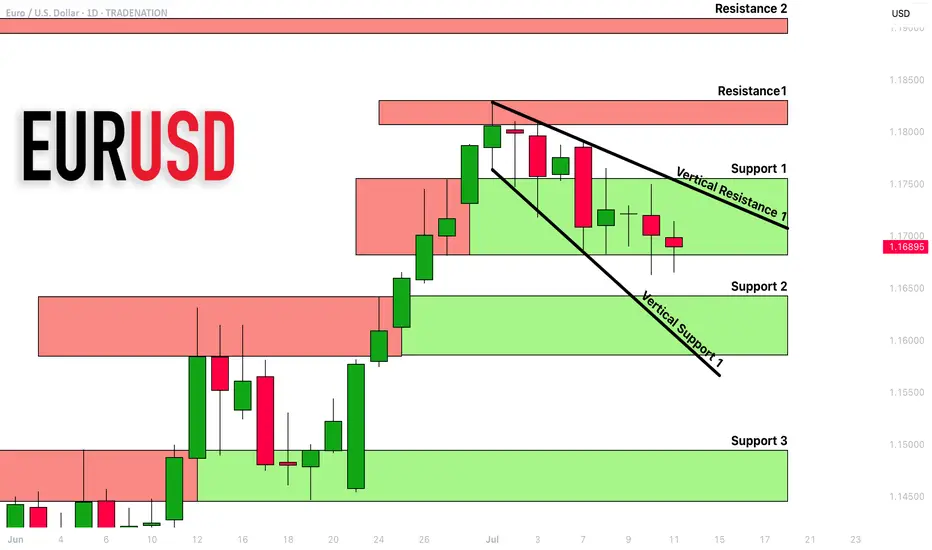
EURUSD: Detailed Support & Resistance Analysis 🇪🇺🇺🇸
Here is my latest structure analysis and important
supports and resistances for EURUSD for next week.
Consider these structures for pullback/breakout trading.
❤️Please, support my work with like, thank you!❤️
I am part of Trade Nation's Influencer program and receive a monthly fee for using their TradingView charts in my analysis.
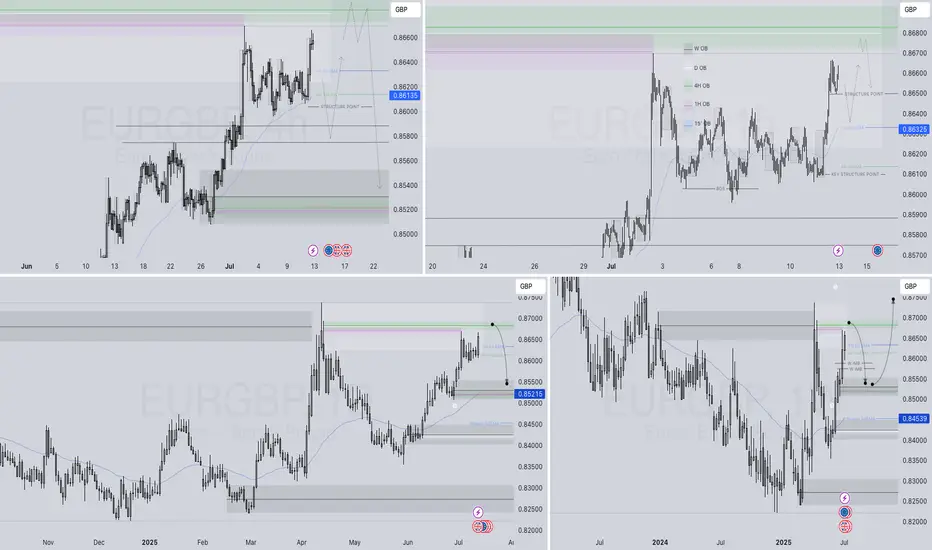
EURGBP SHORT – WEEKLY FORECAST Q3 | W29 | Y25💼 EURGBP SHORT – WEEKLY FORECAST
Q3 | W29 | Y25
📊 MARKET STRUCTURE SNAPSHOT
EURGBP is currently reacting from a key higher time frame supply zone, with price action showing weakness at premium levels. Momentum has slowed, and early signs of distribution are appearing. With structure aligning bearishly across multiple timeframes, the pair presents a short bias opportunity.
🔍 Confluences to Watch 📝
✅ Daily Order Block (OB)
Price reacted from a high-probability bearish OB.
Rejection wicks and a shift in candle body control point to supply dominance.
Momentum is fading, confirming the presence of smart money sellers.
✅ 4H Order Block
Clear mitigation of 4H OB followed by an internal break of structure (iBoS).
Price is respecting the OB zone, printing lower highs beneath key supply.
Perfect mid-timeframe confirmation of trend transition.
✅ 1H Order Block
1H structure shifted bearish, validating LTF trend alignment.
Price building supply chain with continued lower highs and bearish engulfing patterns.
Ideal zone for entry on pullback or liquidity sweep.
📈 Risk Management Protocols
🔑 Core Principles:
💰 Max 1% risk per trade
📍 Only execute at pre-identified zones
⏰ Set alerts — avoid impulsive trades
📉 Respect RR — minimum 1:2 per position
🧠 You're not paid for frequency. You're paid for discipline and execution quality.
🧠 Weekly FRGNT Insight
“Trade what the market gives, not what your ego wants.”
Stay mechanical, stay focused, and allow the probabilities to play out. Your job is to control risk — not the outcome.
🏁 Final Thoughts from FRGNT
📌 The structure is clear.
📌 The confluences are stacked.
📌 The bias is confirmed.
Let your execution reflect your discipline, not your emotions.
❤️ Good luck this week, and as always – I’ll see you at the very top.
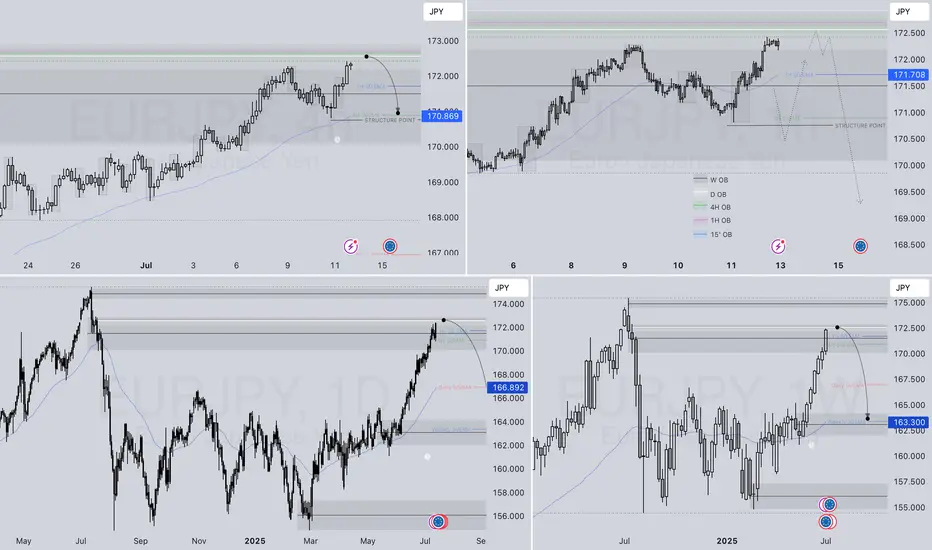
EURJPY SHORT – WEEKLY FORECAST Q3 | W29 | Y25💼 EURJPY SHORT – WEEKLY FORECAST
Q3 | W29 | Y25
📊 MARKET STRUCTURE SNAPSHOT
EURJPY is currently reacting from a key higher time frame supply zone, with price action showing weakness at premium levels. Structure and momentum are now aligning for a short opportunity backed by multi-timeframe confluence.
🔍 Confluences to Watch 📝
✅ Daily Order Block (OB)
Strong reaction and early signs of distribution.
Previous bullish momentum is losing steam; structure is flattening with rejection wicks forming.
✅ 4H Order Block
Break of internal structure (iBoS) confirms a short-term bearish transition.
✅ 1H Order Block
1H structure shift bearish
📈 Risk Management Protocols
🔑 Core principles:
Max 1% risk per trade
Only execute at pre-identified levels
Use alerts, not emotion
Stick to your RR plan — minimum 1:2
🧠 You’re not paid for how many trades you take, you’re paid for how well you manage risk.
🧠 Weekly FRGNT Insight
"Trade what the market gives, not what your ego wants."
Stay mechanical. Stay focused. Let the probabilities work.
🏁 Final Thoughts from FRGNT
📌 The structure is clear.
The confluences are stacked.
Let execution follow discipline, not emotion.
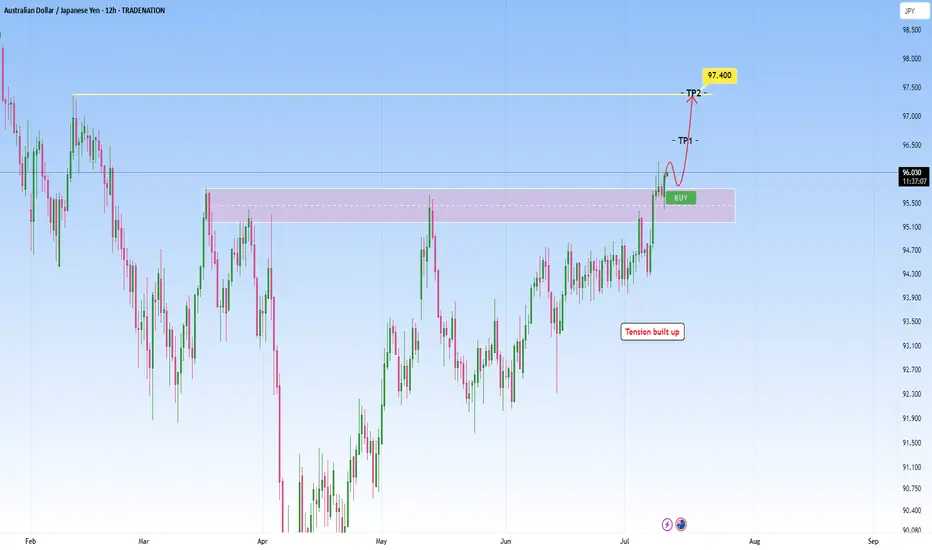
AUDJPY Technical Breakout - Targeting 97.400 Next?TRADENATION:AUDJPY has recently broken decisively above a key resistance zone that had previously capped price for several months. This breakout was preceded by a period of compression and range-bound price action, where bullish momentum steadily built up, indicated by higher lows pressing against the resistance level. This type of structure typically leads to an explosive breakout, which we are now seeing unfold.
After the breakout, price came back for a clean retest of the broken resistance zone, which has now flipped into support. The retest held firmly, suggesting strong buyer interest at this level and confirming the validity of the breakout.
With this structure in place, the bullish momentum is likely to extend further toward the next target zone around 97.400, provided price remains above the current support.
As long as the price holds above the retested zone, the bullish outlook remains intact. A breakdown back below this area, however, would be a warning sign and could open the door to a deeper pullback.
Remember, always wait for confirmation before entering trades, and maintain disciplined risk management.
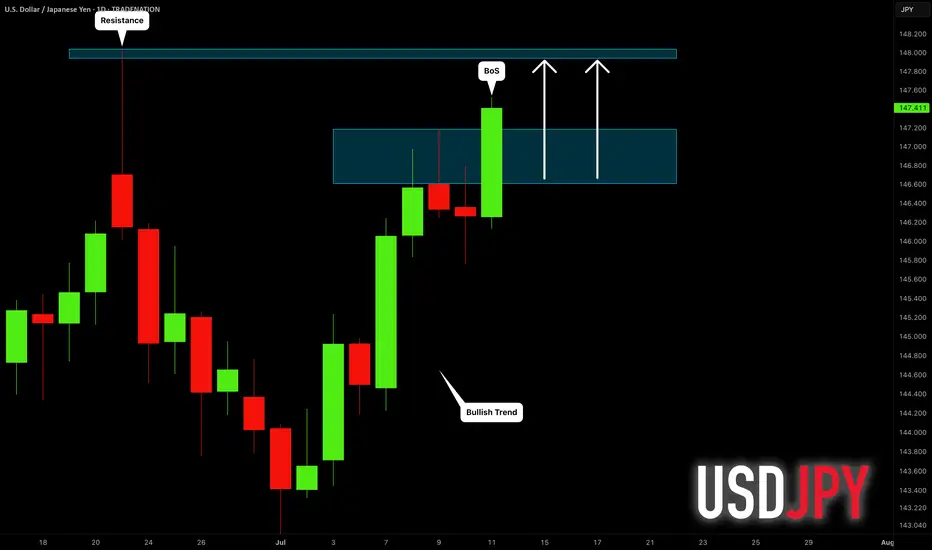
USDJPY: More Growth Ahead! 🇺🇸🇯🇵
USDJPY broke and closed above a minor daily resistance
with a confirmed BoS.
The next strong resistance is 148.0
It is going to be the next goal for bulls.
❤️Please, support my work with like, thank you!❤️
I am part of Trade Nation's Influencer program and receive a monthly fee for using their TradingView charts in my analysis.
GBPCHF - Continuation Setup towards 1.0770GBPCHF recently descended with strength, and I’ve been watching to see how price reacts here.
Price now hovers above and this is a great indication for us to use for possible continuation move, that could send price into the 1.0770 level.
But if price breaks above with momentum, then I’ll back off the bearish bias and reassess, and I’d consider the continuation idea invalidated, with potential for further upside.
Just sharing my thoughts for the charts, this isn’t financial advice. Always confirm your setups and manage your risk properly.
Disclosure: I am part of Trade Nation's Influencer program and receive a monthly fee for using their TradingView charts in my analysis.

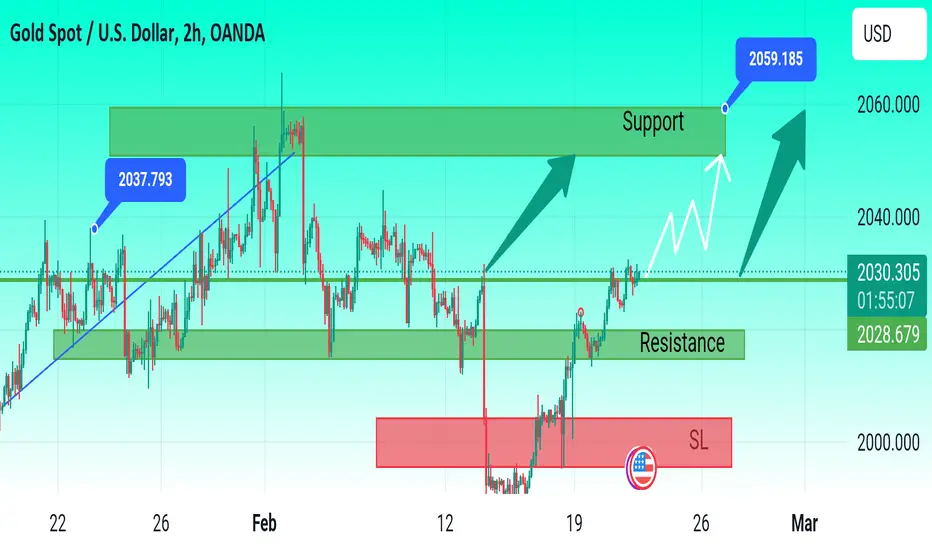
Xauusd Up Gold stabilizes near $2,030, eyes on FOMC Minutes
Gold clings to marginal daily gains at around $2,030 on Wednesday after closing the first two days of the week in positive territory. The benchmark 10-year US Treasury bond yield edges lower ahead of FOMC Minutes, helping XAU/USD hold its ground.
From a technical perspective, sustained strength and acceptance above the 50-day SMA will set the stage for an extension of the recent recovery from the $1,984 region, or a two-month low touched last week. Given that oscillators on the daily chart have been gaining positive traction, the Gold price might then accelerate the positive move towards an intermediate hurdle near the $2,044-2,045 region en route to the $2,065 supply zone.
Gold now 2028
Target 2032
Target 2036
Target 2050
Target 2059
SL 2015
FOMC signal confirm