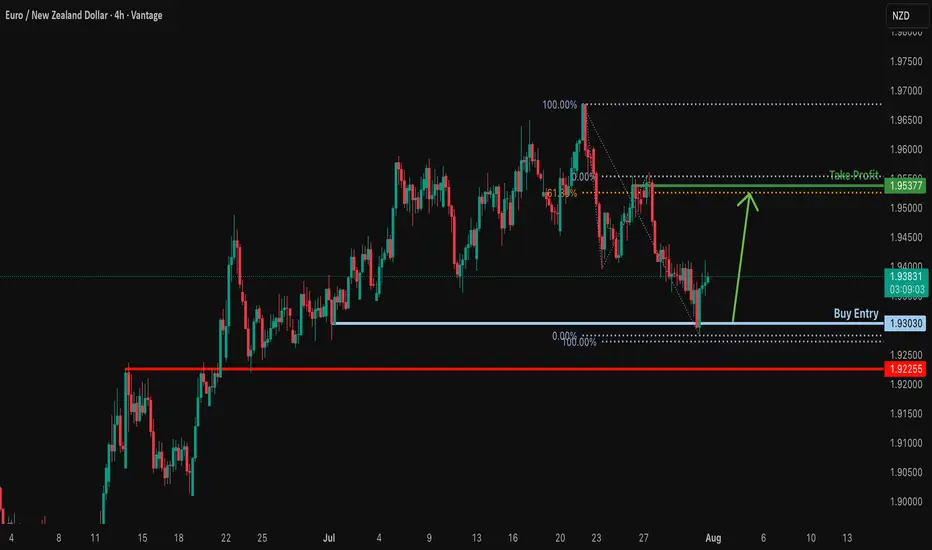
Bullish bounce off pullback support?EUR/NZD has bounced off the support level, which is a pullback support and could rise from this level to our take profit.
Entry: 1.93030
Why we like it:
There is a pullback support.
Stop loss: 1.92255
Why we like it:
There is an overlap support
Take profit: 1.95377
Why we like it:
There is a swing high resistance that lines up with the 61.8% Fibonacci retracement.
Enjoying your TradingView experience? Review us!
Please be advised that the information presented on TradingView is provided to Vantage (‘Vantage Global Limited’, ‘we’) by a third-party provider (‘Everest Fortune Group’). Please be reminded that you are solely responsible for the trading decisions on your account. There is a very high degree of risk involved in trading. Any information and/or content is intended entirely for research, educational and informational purposes only and does not constitute investment or consultation advice or investment strategy. The information is not tailored to the investment needs of any specific person and therefore does not involve a consideration of any of the investment objectives, financial situation or needs of any viewer that may receive it. Kindly also note that past performance is not a reliable indicator of future results. Actual results may differ materially from those anticipated in forward-looking or past performance statements. We assume no liability as to the accuracy or completeness of any of the information and/or content provided herein and the Company cannot be held responsible for any omission, mistake nor for any loss or damage including without limitation to any loss of profit which may arise from reliance on any information supplied by Everest Fortune Group.
Forexsignals
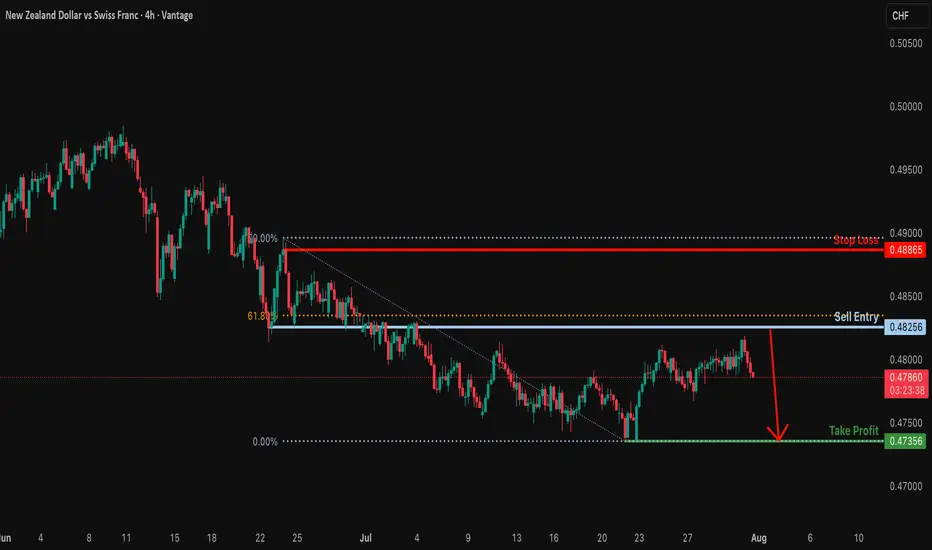
Bearish drop?The NZD/CHF is rising towards the resistance level, which is a pullback resistance that is slightly below the 61.8% Fibonacci retracement. It could drop from this level to our take-profit.
Entry: 0.48256
Why we like it:
There is a pullback resistance that is slightly below the 61.8% Fibonacci retracement.
Stop loss: 0.48865
Why we like it:
There is a pullback resistance.
Take profit: 0.47356
Why we like it:
There is a swing low support.
Enjoying your TradingView experience? Review us!
Please be advised that the information presented on TradingView is provided to Vantage (‘Vantage Global Limited’, ‘we’) by a third-party provider (‘Everest Fortune Group’). Please be reminded that you are solely responsible for the trading decisions on your account. There is a very high degree of risk involved in trading. Any information and/or content is intended entirely for research, educational and informational purposes only and does not constitute investment or consultation advice or investment strategy. The information is not tailored to the investment needs of any specific person and therefore does not involve a consideration of any of the investment objectives, financial situation or needs of any viewer that may receive it. Kindly also note that past performance is not a reliable indicator of future results. Actual results may differ materially from those anticipated in forward-looking or past performance statements. We assume no liability as to the accuracy or completeness of any of the information and/or content provided herein and the Company cannot be held responsible for any omission, mistake nor for any loss or damage including without limitation to any loss of profit which may arise from reliance on any information supplied by Everest Fortune Group.
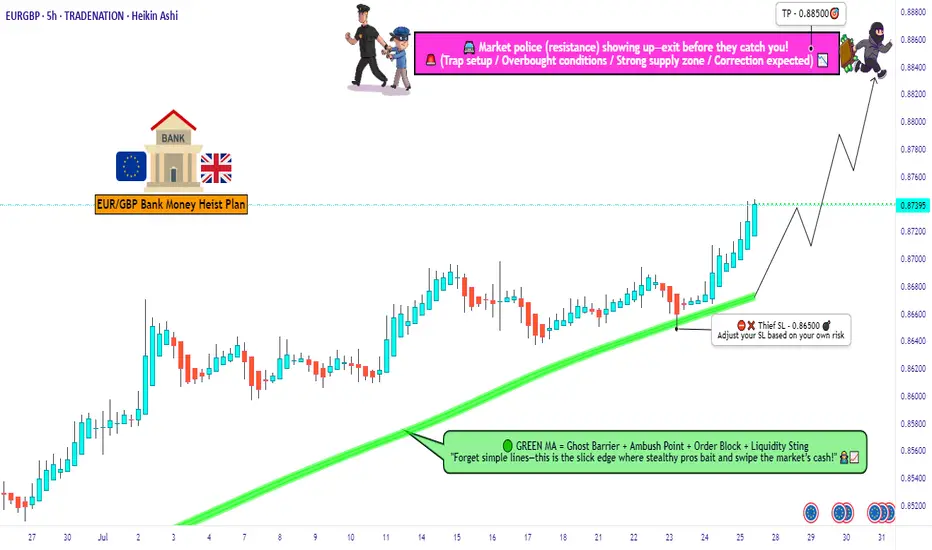
EUR/GBP Thief Trade: Swipe Profits Before Overbought Trap!🦹♂️ EUR/GBP "THE CHUNNEL HEIST" – BULLISH LOOT IN PROGRESS! 🚨💰
(Thief Trading Strategy – Escape Before the Cops Arrive!)
🎯 DEAR MARKET PIRATES & PROFIT SNATCHERS,
Based on our 🔥Thief Trading Style Analysis🔥, we’re executing a bullish heist on EUR/GBP ("The Chunnel"). The vault is wide open—time to swipe the loot before the high-risk resistance police barricade (aka overbought trap) shuts us down!
📜 THE MASTER PLAN:
✔ Entry (📈): "The Bullish Vault is Unlocked!"
Buy Limit Orders (15-30min TF) near recent swing lows/highs.
Thief’s DCA Trick: Layer entries like a pro robber—multiple limit orders for max loot.
✔ Stop Loss (🛑): "Hide Your Stash Wisely!"
SL at nearest 4H candle wick (0.86500)—adjust based on your risk appetite & lot size.
Remember: A good thief always has an escape route!
✔ Target (🎯): 0.88500 (or escape earlier if the cops get suspicious!)
🔎 SCALPERS & SWING BANDITS – LISTEN UP!
Scalpers: Stick to LONG-ONLY heists! Use trailing SL to protect profits.
Swing Thieves: If you’re low on cash, join the slow robbery—DCA & hold!
📡 WHY THIS HEIST IS HOT:
Bullish momentum in play (but BEWARE of overbought traps!).
Fundamental Drivers: Check COT Reports, Macro Data, & Sentiment.
🚨 TRADING ALERT: NEWS = POLICE RAID RISK!
Avoid new trades during high-impact news.
Trailing SL = Your Getaway Car! Lock profits before volatility strikes.
💥 BOOST THIS HEIST – STRENGTHEN THE GANG!
👉 Smash the LIKE & BOOST button to fuel our next market robbery!
👉 Follow for more heists—profit awaits! 🚀💰
🦹♂️ Stay Sharp, Stay Ruthless… See You on the Next Heist!

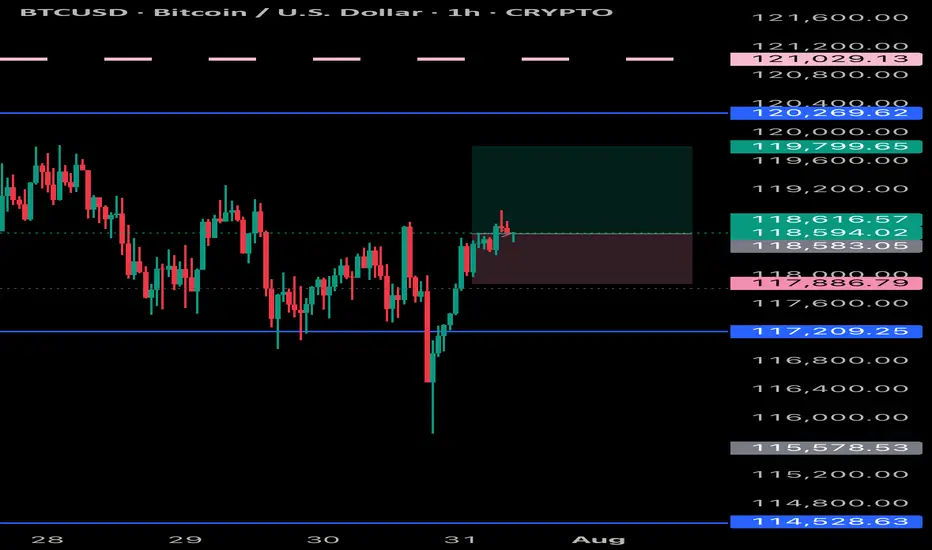
BTCUSD INCREASES Bitcoin looking to be targeting new highs and I’m simply following the trend and keeping trading simple
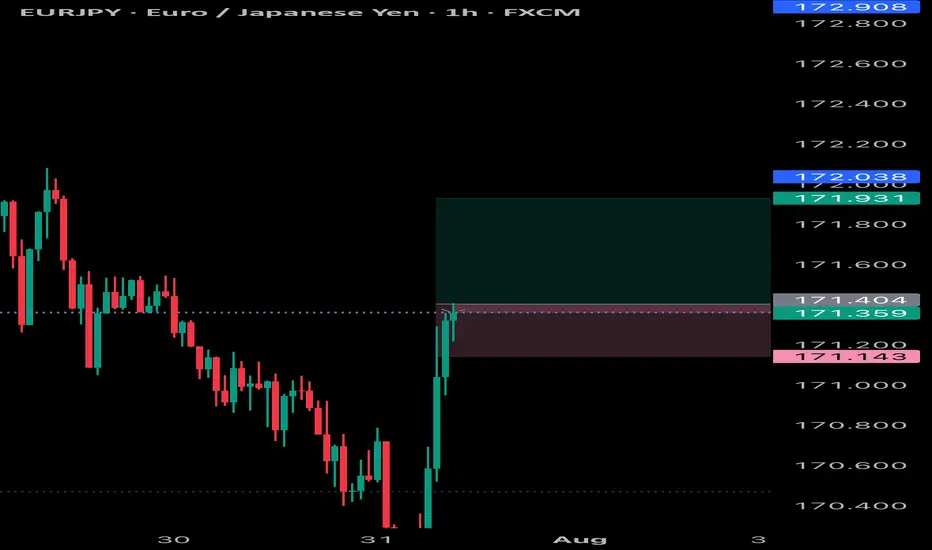
UP TREND EURJPYEurjpy will be buying and scalping will be moving my SL to BE or swing with it all the way to the top as it cannot sell forever
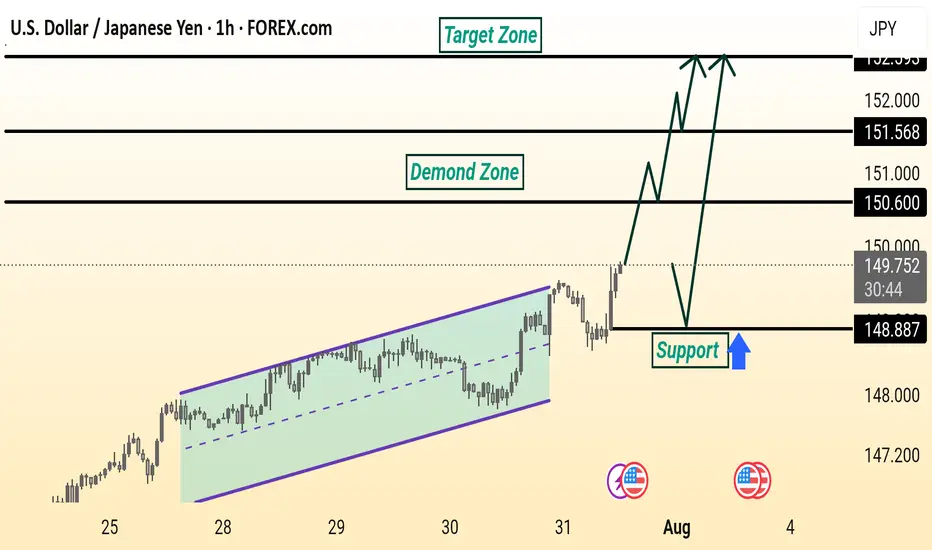
USD/JPY Analysis is Ready USD/JPY is showing a bullish setup. Price broke out of a rising channel and is expected to retest the 148.887 support level before moving higher toward the 150.600 and 151.568 resistance zones, targeting the 152.000 area. The demand zone adds strength to the potential upside.
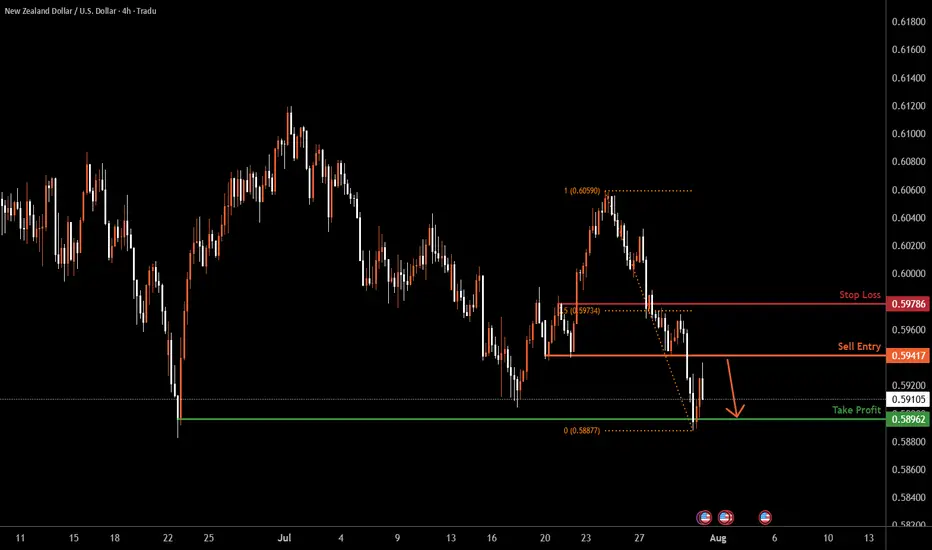
NZDUSD H4 | Bearish drop off 50% Fibonacci resistanceNZD/USD is rising towards the sell entry, which serves as a pullback resistance and could potentially reverse lower.
Sell entry is at 0.5941, which is a pullback resistance.
Stop loss is at 0.5978, which is a pullback resistance that lines up with the 50% Fibonacci retracement.
Take profit is at 0.5896, which is a swing low support.
High Risk Investment Warning
Trading Forex/CFDs on margin carries a high level of risk and may not be suitable for all investors. Leverage can work against you.
Stratos Markets Limited (tradu.com ):
CFDs are complex instruments and come with a high risk of losing money rapidly due to leverage. 65% of retail investor accounts lose money when trading CFDs with this provider. You should consider whether you understand how CFDs work and whether you can afford to take the high risk of losing your money.
Stratos Europe Ltd (tradu.com ):
CFDs are complex instruments and come with a high risk of losing money rapidly due to leverage. 66% of retail investor accounts lose money when trading CFDs with this provider. You should consider whether you understand how CFDs work and whether you can afford to take the high risk of losing your money.
Stratos Global LLC (tradu.com ):
Losses can exceed deposits.
Please be advised that the information presented on TradingView is provided to Tradu (‘Company’, ‘we’) by a third-party provider (‘TFA Global Pte Ltd’). Please be reminded that you are solely responsible for the trading decisions on your account. There is a very high degree of risk involved in trading. Any information and/or content is intended entirely for research, educational and informational purposes only and does not constitute investment or consultation advice or investment strategy. The information is not tailored to the investment needs of any specific person and therefore does not involve a consideration of any of the investment objectives, financial situation or needs of any viewer that may receive it. Kindly also note that past performance is not a reliable indicator of future results. Actual results may differ materially from those anticipated in forward-looking or past performance statements. We assume no liability as to the accuracy or completeness of any of the information and/or content provided herein and the Company cannot be held responsible for any omission, mistake nor for any loss or damage including without limitation to any loss of profit which may arise from reliance on any information supplied by TFA Global Pte Ltd.
The speaker(s) is neither an employee, agent nor representative of Tradu and is therefore acting independently. The opinions given are their own, constitute general market commentary, and do not constitute the opinion or advice of Tradu or any form of personal or investment advice. Tradu neither endorses nor guarantees offerings of third-party speakers, nor is Tradu responsible for the content, veracity or opinions of third-party speakers, presenters or participants.
Aussie H4 | Bearish reversal off pullback resistanceBased on the H4 chart analysis, we can see that the price is reacting off the sell entry, which acts as a pullback resistance that aligns with the 23.6% Fibonacci retracement and could drop lower from this level.
Sell entry is at 0.6467, which is a pullback resistance that lines up with the 23.6% Fibonacci retracement.
Stop loss is at 0.6525, which is a pullback resistance that aligns with the 50% Fibonacci retracement.
Take profit is at 0.6389, which is a swing low support that aligns with the 138.2% Fibonacci extension.
High Risk Investment Warning
Trading Forex/CFDs on margin carries a high level of risk and may not be suitable for all investors. Leverage can work against you.
Stratos Markets Limited (tradu.com ):
CFDs are complex instruments and come with a high risk of losing money rapidly due to leverage. 65% of retail investor accounts lose money when trading CFDs with this provider. You should consider whether you understand how CFDs work and whether you can afford to take the high risk of losing your money.
Stratos Europe Ltd (tradu.com ):
CFDs are complex instruments and come with a high risk of losing money rapidly due to leverage. 66% of retail investor accounts lose money when trading CFDs with this provider. You should consider whether you understand how CFDs work and whether you can afford to take the high risk of losing your money.
Stratos Global LLC (tradu.com ):
Losses can exceed deposits.
Please be advised that the information presented on TradingView is provided to Tradu (‘Company’, ‘we’) by a third-party provider (‘TFA Global Pte Ltd’). Please be reminded that you are solely responsible for the trading decisions on your account. There is a very high degree of risk involved in trading. Any information and/or content is intended entirely for research, educational and informational purposes only and does not constitute investment or consultation advice or investment strategy. The information is not tailored to the investment needs of any specific person and therefore does not involve a consideration of any of the investment objectives, financial situation or needs of any viewer that may receive it. Kindly also note that past performance is not a reliable indicator of future results. Actual results may differ materially from those anticipated in forward-looking or past performance statements. We assume no liability as to the accuracy or completeness of any of the information and/or content provided herein and the Company cannot be held responsible for any omission, mistake nor for any loss or damage including without limitation to any loss of profit which may arise from reliance on any information supplied by TFA Global Pte Ltd.
The speaker(s) is neither an employee, agent nor representative of Tradu and is therefore acting independently. The opinions given are their own, constitute general market commentary, and do not constitute the opinion or advice of Tradu or any form of personal or investment advice. Tradu neither endorses nor guarantees offerings of third-party speakers, nor is Tradu responsible for the content, veracity or opinions of third-party speakers, presenters or participants.

USDCHF H4 | Bearish reversalBased on the H4 chart analysis, we can see that the price has rejected off the sell entry and could drop from this level towards the take profit.
Sell entry is at 0.8153. which is a pullback resistance that lines up with the 161.8% Fibonacci extension.
Stop loss is at 0.8243, which is a swing high resistance.
Take profit is at 0.8067, which is an overlap support that lines up with the 38.2% Fibonacci retracement.
High Risk Investment Warning
Trading Forex/CFDs on margin carries a high level of risk and may not be suitable for all investors. Leverage can work against you.
Stratos Markets Limited (tradu.com ):
CFDs are complex instruments and come with a high risk of losing money rapidly due to leverage. 65% of retail investor accounts lose money when trading CFDs with this provider. You should consider whether you understand how CFDs work and whether you can afford to take the high risk of losing your money.
Stratos Europe Ltd (tradu.com ):
CFDs are complex instruments and come with a high risk of losing money rapidly due to leverage. 66% of retail investor accounts lose money when trading CFDs with this provider. You should consider whether you understand how CFDs work and whether you can afford to take the high risk of losing your money.
Stratos Global LLC (tradu.com ):
Losses can exceed deposits.
Please be advised that the information presented on TradingView is provided to Tradu (‘Company’, ‘we’) by a third-party provider (‘TFA Global Pte Ltd’). Please be reminded that you are solely responsible for the trading decisions on your account. There is a very high degree of risk involved in trading. Any information and/or content is intended entirely for research, educational and informational purposes only and does not constitute investment or consultation advice or investment strategy. The information is not tailored to the investment needs of any specific person and therefore does not involve a consideration of any of the investment objectives, financial situation or needs of any viewer that may receive it. Kindly also note that past performance is not a reliable indicator of future results. Actual results may differ materially from those anticipated in forward-looking or past performance statements. We assume no liability as to the accuracy or completeness of any of the information and/or content provided herein and the Company cannot be held responsible for any omission, mistake nor for any loss or damage including without limitation to any loss of profit which may arise from reliance on any information supplied by TFA Global Pte Ltd.
The speaker(s) is neither an employee, agent nor representative of Tradu and is therefore acting independently. The opinions given are their own, constitute general market commentary, and do not constitute the opinion or advice of Tradu or any form of personal or investment advice. Tradu neither endorses nor guarantees offerings of third-party speakers, nor is Tradu responsible for the content, veracity or opinions of third-party speakers, presenters or participants.

GBPUSD H4 | Bearish continuationThe Cable (GBP/USD) is rising towards the sell entry, which is a pullback resistance that aligns with the 23.6% Fibonacci retracement and could drop lower from this level.
Sell entry is at 1.3317, which is a pullback resistance that lines up with the 23.6% Fibonacci retracement.
Stop loss at 1.3392, which is a pullback resistance that is slightly below the 50% Fibonacci retracement.
Take profit is at 1.3172, which is a swing low support that aligns with the 100% Fibonacci projection.
High Risk Investment Warning
Trading Forex/CFDs on margin carries a high level of risk and may not be suitable for all investors. Leverage can work against you.
Stratos Markets Limited (tradu.com ):
CFDs are complex instruments and come with a high risk of losing money rapidly due to leverage. 65% of retail investor accounts lose money when trading CFDs with this provider. You should consider whether you understand how CFDs work and whether you can afford to take the high risk of losing your money.
Stratos Europe Ltd (tradu.com ):
CFDs are complex instruments and come with a high risk of losing money rapidly due to leverage. 66% of retail investor accounts lose money when trading CFDs with this provider. You should consider whether you understand how CFDs work and whether you can afford to take the high risk of losing your money.
Stratos Global LLC (tradu.com ):
Losses can exceed deposits.
Please be advised that the information presented on TradingView is provided to Tradu (‘Company’, ‘we’) by a third-party provider (‘TFA Global Pte Ltd’). Please be reminded that you are solely responsible for the trading decisions on your account. There is a very high degree of risk involved in trading. Any information and/or content is intended entirely for research, educational and informational purposes only and does not constitute investment or consultation advice or investment strategy. The information is not tailored to the investment needs of any specific person and therefore does not involve a consideration of any of the investment objectives, financial situation or needs of any viewer that may receive it. Kindly also note that past performance is not a reliable indicator of future results. Actual results may differ materially from those anticipated in forward-looking or past performance statements. We assume no liability as to the accuracy or completeness of any of the information and/or content provided herein and the Company cannot be held responsible for any omission, mistake nor for any loss or damage including without limitation to any loss of profit which may arise from reliance on any information supplied by TFA Global Pte Ltd.
The speaker(s) is neither an employee, agent nor representative of Tradu and is therefore acting independently. The opinions given are their own, constitute general market commentary, and do not constitute the opinion or advice of Tradu or any form of personal or investment advice. Tradu neither endorses nor guarantees offerings of third-party speakers, nor is Tradu responsible for the content, veracity or opinions of third-party speakers, presenters or participants.

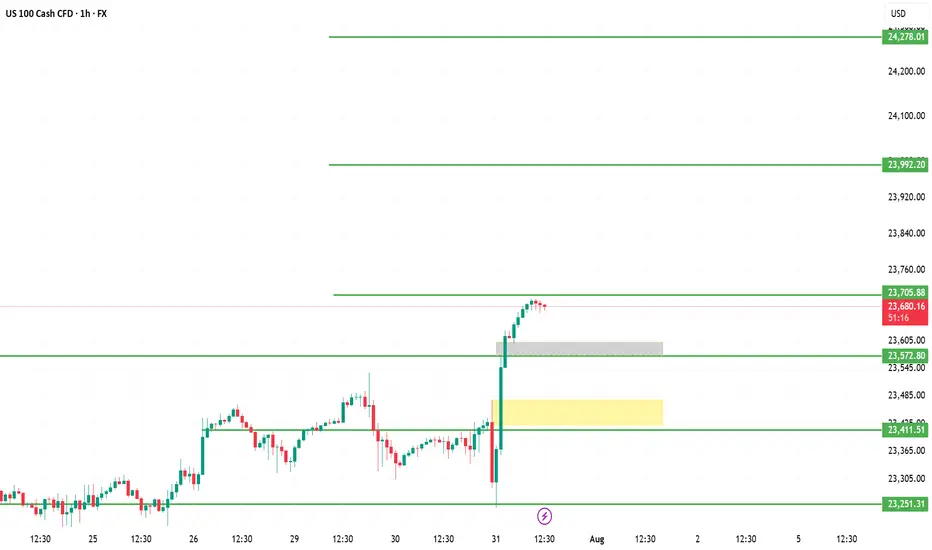
US100 (NASDAQ) Analysis – 1H Chart | July 31, 20251. Vertical Bullish Rally
Price exploded upward from 23,251 to 23,705 with strong bullish momentum and no meaningful retracement, indicating a short-term overbought scenario.
2. Fresh Supply at 23,705
The current candle shows hesitation just below 23,705.88 — forming a possible short-term top or reaction zone where sellers might step in.
3. Imbalance Zone Below
A visible Fair Value Gap (FVG) is left between 23,572–23,600 and the yellow highlighted demand zone (23,411) is untested. Price may revisit to fill that imbalance.
4. Projection: Pullback Possible
If price fails to break and hold above 23,705, we may see a pullback toward 23,600 → 23,411 before the next move.
5. Key Levels
Resistance: 23,705 → 23,992 → 24,278
Support: 23,572 → 23,411 → 23,251
Structure remains bullish unless 23,411 breaks.
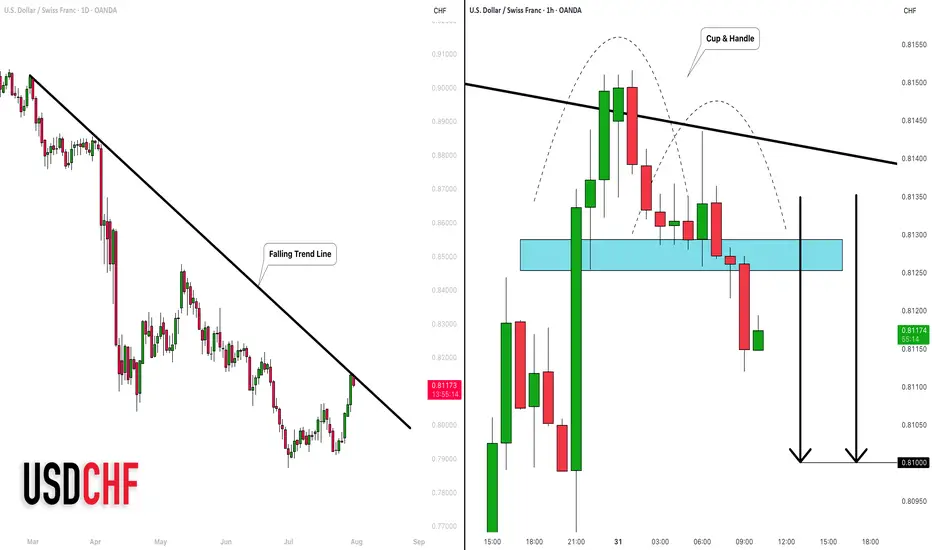
USDCHF: Correction Ahead! 🇺🇸🇨🇭
I think that USDCHF is going to retrace after a test
of a major falling trend line on a daily.
As a confirmation, I found an inverted cup & handle pattern
on an hourly time frame.
Closest support - 0.81
❤️Please, support my work with like, thank you!❤️
XAUUSD (Gold) Analysis – 1H Chart | July 31, 20251. Fakeout & Rejection from Supply
Price faced sharp rejection near the 3,332 resistance. The strong red candle indicates aggressive selling and liquidity grab.
2. Retest of Broken Demand Zone
Gold is now retesting the **3,298–3,305** yellow zone, which previously acted as demand but may now flip to resistance (supply).
3. Bearish Market Structure
The price formed a **lower high and lower low** pattern — a clear sign of downtrend resumption. Current bounce looks corrective.
4. Projection: Potential Drop Ahead
As per the drawn path, if price fails to reclaim above 3,305, a likely drop toward 3,282, then 3,268 is expected.
5. Key Levels to Watch
Resistance: 3,305 → 3,332
Support: 3,282 → 3,268 → 3,246
Bearish bias remains valid below 3,305.

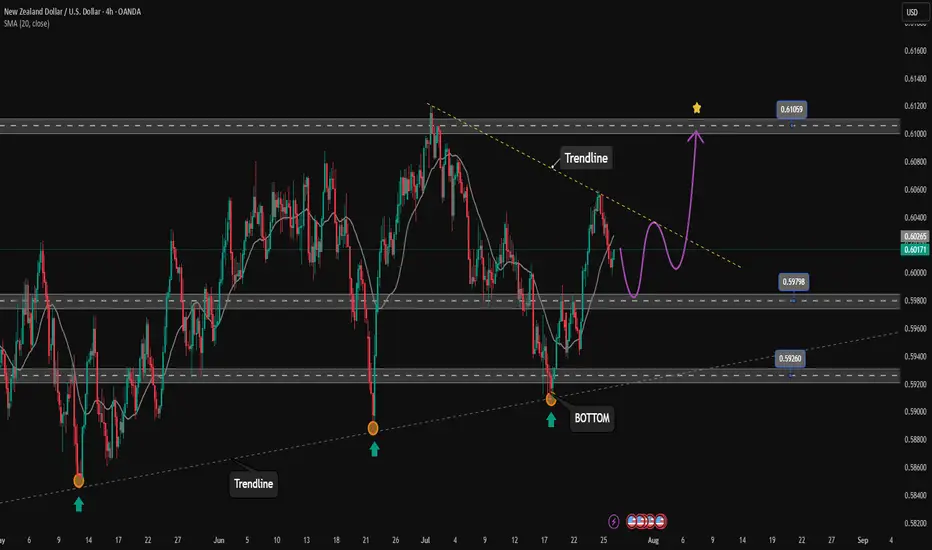
Price is heading towards the upper boundary of the price channel✏️ OANDA:NZDUSD is trading in a bullish wave on H4 chart towards the upper boundary of the ascending price channel. The trendline reaction to the support zone of 0.598 will form a nice corrective wave for the uptrend. If the nearest trendline is broken, the price will soon reach our take profit zone.
📉 Key Levels
Buy trigger: Reject and Trading above 0.598
BUY zone 0.592 ( vùng hỗ trợ biên dưới)
Target: 0.610
Leave your comments on the idea. I am happy to read your views.
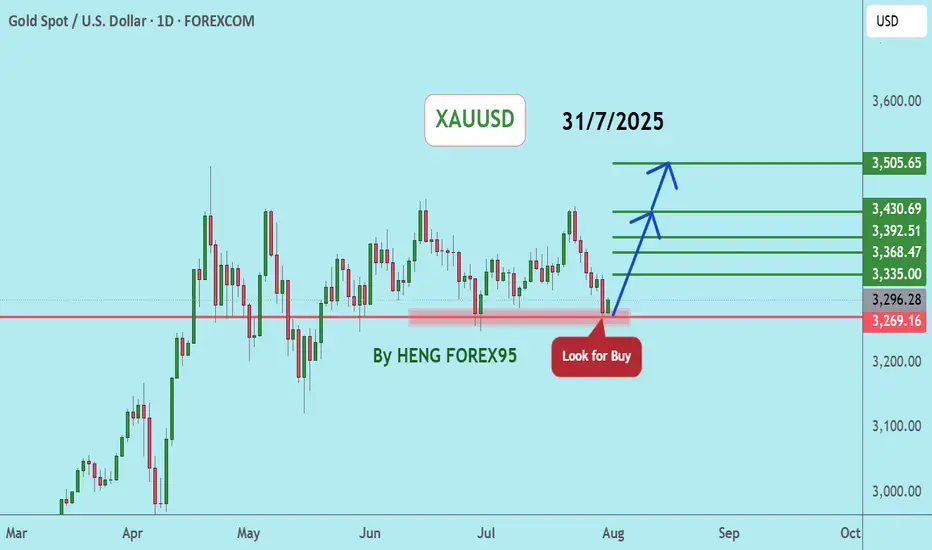
XAUUSDUpdate:
Gold Price Trend: As per our previous analysis on July 28, 2025, the price has now tested the support at 3,269. We expect that if the gold price can hold above 3,249, the gold price trend will remain bullish. We recommend considering buying in the red zone.
🔥Trading futures, forex, CFDs and stocks carries a risk of loss.
Please consider carefully whether such trading is suitable for you.
>>GooD Luck 😊
❤️ Like and subscribe to never miss a new idea!
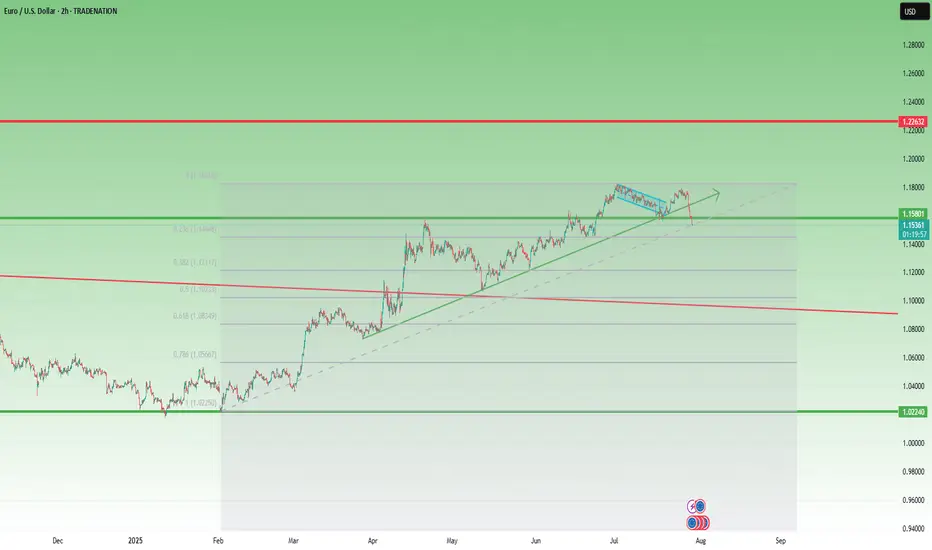
Closed Longs, Now Selling Rallies on EURUSD ReversalAs mentioned in my previous posts, I’m been bullish on EURUSD in the medium term, targeting 1.20 and even beyond.
But no pair—especially not EURUSD, which tends to move more steadily and rationally—goes up in a straight line.
________________________________________
🔹 Last week, the pair stalled just below 1.18, and I decided to close my long trade with a +150 pip gain. That proved to be a wise call, as price dropped hard shortly after.
________________________________________
📉 What’s happening now?
• EURUSD has broken below the rising trendline
• More importantly, it’s broken below the neckline of a double top pattern
• Now trading around 1.1535
This opens the door for a deeper correction, and I expect we could see a test of the 1.1150–1.1100 zone by the end of summer.
________________________________________
📌 Trading Plan:
• I’m now in sell-the-rally mode
• Ideal short entry: around 1.1650, where we also get a favorable 1:3+ risk-reward
• Watch also for interim support around 1.1400
________________________________________
Conclusion:
The bigger picture remains bullish— but this correction looks healthy and isn’t done yet.
Selling rallies makes more sense now, until the structure tells us otherwise.
Disclosure: I am part of TradeNation's Influencer program and receive a monthly fee for using their TradingView charts in my analyses and educational articles.
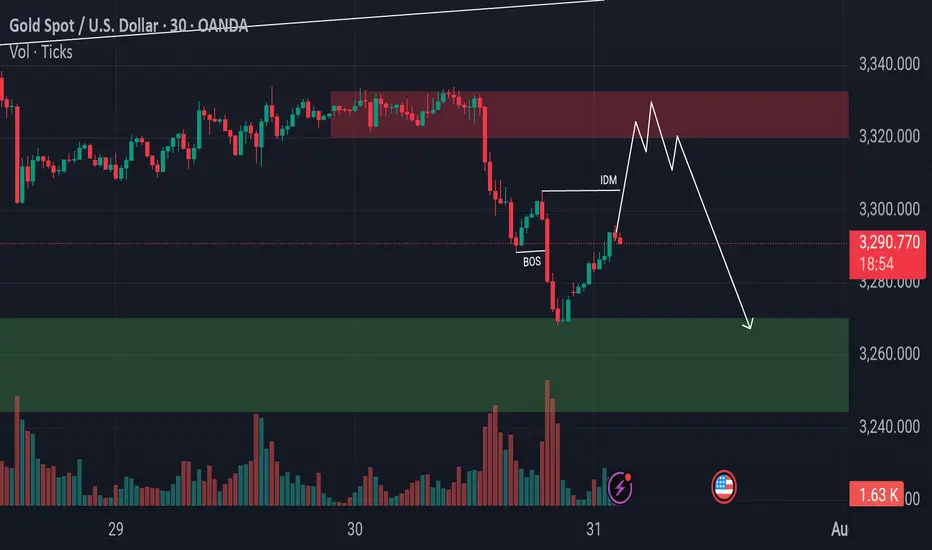
Gold Bulls Charging to 3305 But What’s Waiting There?Gold has recently taken support from the lower levels and has also shown a Break of Structure (BoS) to the downside. Currently, there is Imbalance and Internal Draw on Liquidity (IDM) resting around the 3305 level. The market appears to be moving upward to mitigate that imbalance. It's important to closely monitor this zone, as once the market reaches and fills this area, there is a high probability of a potential rejection or bearish move from that level
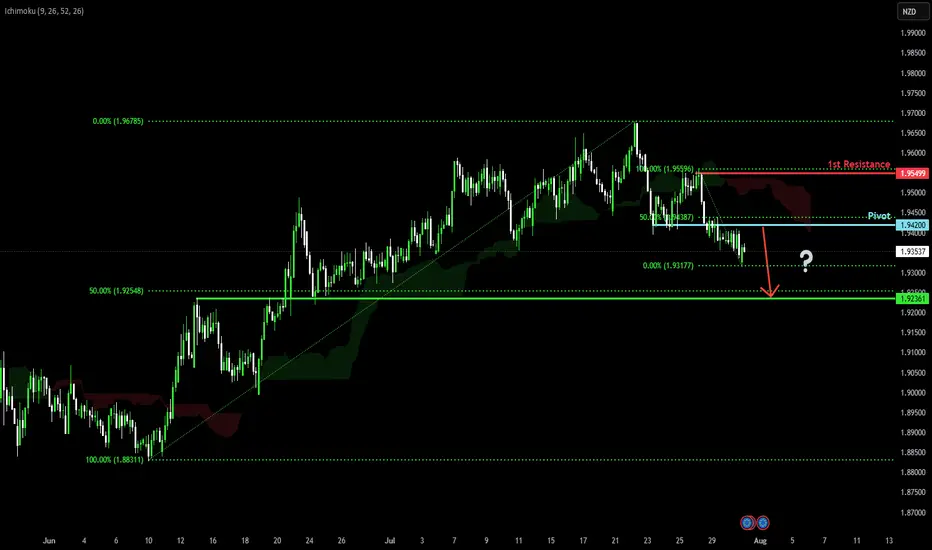
Potential bearish drop?EUR/NZD has rejected off the pivot and could drop to the overlap support.
Pivot: 1.94200
1st Support: 1.92361
1st Resistance: 1.95499
Risk Warning:
Trading Forex and CFDs carries a high level of risk to your capital and you should only trade with money you can afford to lose. Trading Forex and CFDs may not be suitable for all investors, so please ensure that you fully understand the risks involved and seek independent advice if necessary.
Disclaimer:
The above opinions given constitute general market commentary, and do not constitute the opinion or advice of IC Markets or any form of personal or investment advice.
Any opinions, news, research, analyses, prices, other information, or links to third-party sites contained on this website are provided on an "as-is" basis, are intended only to be informative, is not an advice nor a recommendation, nor research, or a record of our trading prices, or an offer of, or solicitation for a transaction in any financial instrument and thus should not be treated as such. The information provided does not involve any specific investment objectives, financial situation and needs of any specific person who may receive it. Please be aware, that past performance is not a reliable indicator of future performance and/or results. Past Performance or Forward-looking scenarios based upon the reasonable beliefs of the third-party provider are not a guarantee of future performance. Actual results may differ materially from those anticipated in forward-looking or past performance statements. IC Markets makes no representation or warranty and assumes no liability as to the accuracy or completeness of the information provided, nor any loss arising from any investment based on a recommendation, forecast or any information supplied by any third-party.
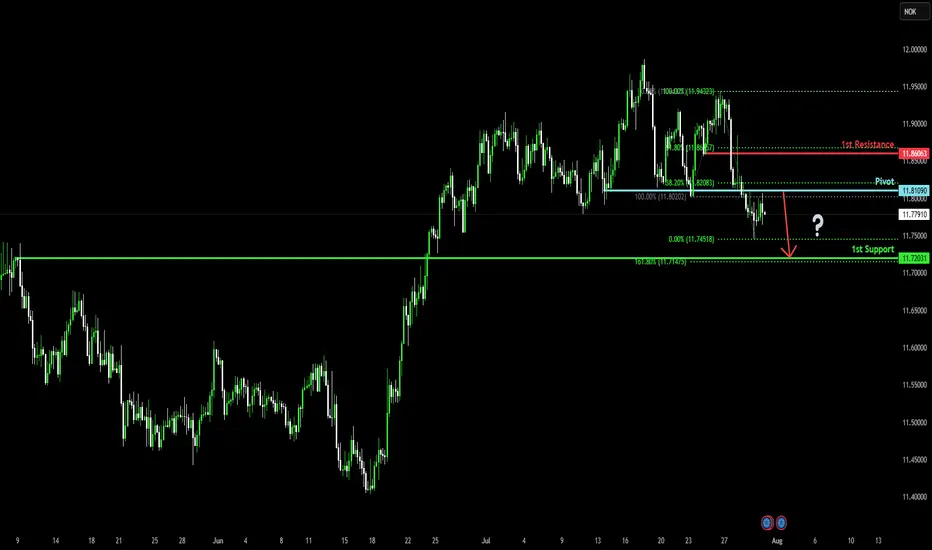
Bearish drop?EUR/NOK has rejected off the pivot, which acts as a pullback resistance, and could drop to the 1st support, which is a pullback support that lines up with the 161.8% Fibonacci extension.
Pivot: 11.81090
1st Support: 11.72031
1st Resistance: 11.86063
Risk Warning:
Trading Forex and CFDs carries a high level of risk to your capital and you should only trade with money you can afford to lose. Trading Forex and CFDs may not be suitable for all investors, so please ensure that you fully understand the risks involved and seek independent advice if necessary.
Disclaimer:
The above opinions given constitute general market commentary, and do not constitute the opinion or advice of IC Markets or any form of personal or investment advice.
Any opinions, news, research, analyses, prices, other information, or links to third-party sites contained on this website are provided on an "as-is" basis, are intended only to be informative, is not an advice nor a recommendation, nor research, or a record of our trading prices, or an offer of, or solicitation for a transaction in any financial instrument and thus should not be treated as such. The information provided does not involve any specific investment objectives, financial situation and needs of any specific person who may receive it. Please be aware, that past performance is not a reliable indicator of future performance and/or results. Past Performance or Forward-looking scenarios based upon the reasonable beliefs of the third-party provider are not a guarantee of future performance. Actual results may differ materially from those anticipated in forward-looking or past performance statements. IC Markets makes no representation or warranty and assumes no liability as to the accuracy or completeness of the information provided, nor any loss arising from any investment based on a recommendation, forecast or any information supplied by any third-party.
EURUSD H4 | Bearish reversal off overlap resistanceThe Fiber (EUR/USD) is rising towards the sell entry, which is an overlap resistance and could drop lower.
Sell entry is at 1.1452, which is an overlap resistance.
Stop loss is at 1.1536, which is a pullback resistance that lines up with the 38.2% Fibonacci retracement.
Take profit is at 1.1323, which is a pullback support that is slightly below the 78.6% Fibonacci retracement.
High Risk Investment Warning
Trading Forex/CFDs on margin carries a high level of risk and may not be suitable for all investors. Leverage can work against you.
Stratos Markets Limited (tradu.com ):
CFDs are complex instruments and come with a high risk of losing money rapidly due to leverage. 65% of retail investor accounts lose money when trading CFDs with this provider. You should consider whether you understand how CFDs work and whether you can afford to take the high risk of losing your money.
Stratos Europe Ltd (tradu.com ):
CFDs are complex instruments and come with a high risk of losing money rapidly due to leverage. 66% of retail investor accounts lose money when trading CFDs with this provider. You should consider whether you understand how CFDs work and whether you can afford to take the high risk of losing your money.
Stratos Global LLC (tradu.com ):
Losses can exceed deposits.
Please be advised that the information presented on TradingView is provided to Tradu (‘Company’, ‘we’) by a third-party provider (‘TFA Global Pte Ltd’). Please be reminded that you are solely responsible for the trading decisions on your account. There is a very high degree of risk involved in trading. Any information and/or content is intended entirely for research, educational and informational purposes only and does not constitute investment or consultation advice or investment strategy. The information is not tailored to the investment needs of any specific person and therefore does not involve a consideration of any of the investment objectives, financial situation or needs of any viewer that may receive it. Kindly also note that past performance is not a reliable indicator of future results. Actual results may differ materially from those anticipated in forward-looking or past performance statements. We assume no liability as to the accuracy or completeness of any of the information and/or content provided herein and the Company cannot be held responsible for any omission, mistake nor for any loss or damage including without limitation to any loss of profit which may arise from reliance on any information supplied by TFA Global Pte Ltd.
The speaker(s) is neither an employee, agent nor representative of Tradu and is therefore acting independently. The opinions given are their own, constitute general market commentary, and do not constitute the opinion or advice of Tradu or any form of personal or investment advice. Tradu neither endorses nor guarantees offerings of third-party speakers, nor is Tradu responsible for the content, veracity or opinions of third-party speakers, presenters or participants.

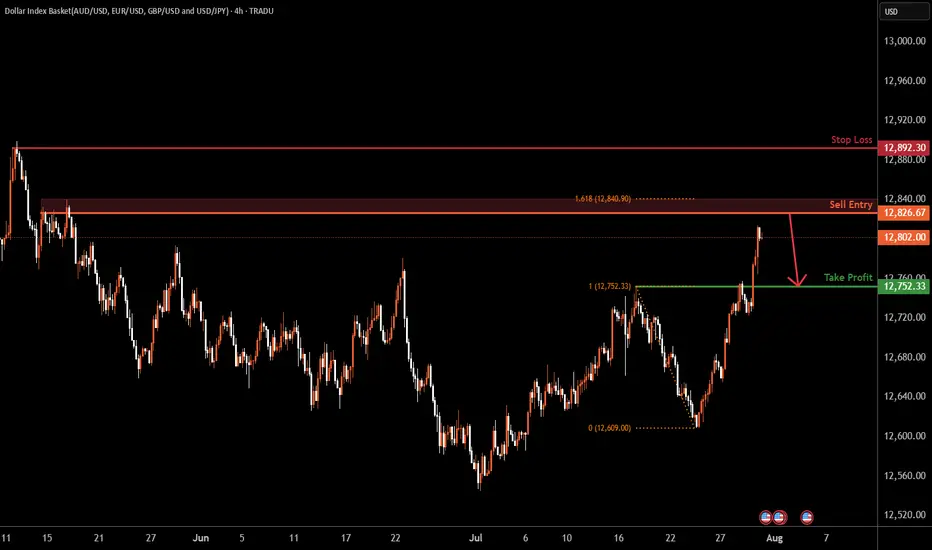
USDOLLAR H4 | Bearish reversalBased on H4 chart analysis, we can see the price rising towards the sell entry at 12,826.67, which is a swing high resistance.
Stop loss is at 12,892.30, which is a swing high resistance.
Our take profit will be at 12,752.33, which is a pullback support.
High Risk Investment Warning
Trading Forex/CFDs on margin carries a high level of risk and may not be suitable for all investors. Leverage can work against you.
Stratos Markets Limited (tradu.com ):
CFDs are complex instruments and come with a high risk of losing money rapidly due to leverage. 65% of retail investor accounts lose money when trading CFDs with this provider. You should consider whether you understand how CFDs work and whether you can afford to take the high risk of losing your money.
Stratos Europe Ltd (tradu.com ):
CFDs are complex instruments and come with a high risk of losing money rapidly due to leverage. 66% of retail investor accounts lose money when trading CFDs with this provider. You should consider whether you understand how CFDs work and whether you can afford to take the high risk of losing your money.
Stratos Global LLC (tradu.com ):
Losses can exceed deposits.
Please be advised that the information presented on TradingView is provided to Tradu (‘Company’, ‘we’) by a third-party provider (‘TFA Global Pte Ltd’). Please be reminded that you are solely responsible for the trading decisions on your account. There is a very high degree of risk involved in trading. Any information and/or content is intended entirely for research, educational and informational purposes only and does not constitute investment or consultation advice or investment strategy. The information is not tailored to the investment needs of any specific person and therefore does not involve a consideration of any of the investment objectives, financial situation or needs of any viewer that may receive it. Kindly also note that past performance is not a reliable indicator of future results. Actual results may differ materially from those anticipated in forward-looking or past performance statements. We assume no liability as to the accuracy or completeness of any of the information and/or content provided herein and the Company cannot be held responsible for any omission, mistake nor for any loss or damage including without limitation to any loss of profit which may arise from reliance on any information supplied by TFA Global Pte Ltd.
The speaker(s) is neither an employee, agent nor representative of Tradu and is therefore acting independently. The opinions given are their own, constitute general market commentary, and do not constitute the opinion or advice of Tradu or any form of personal or investment advice. Tradu neither endorses nor guarantees offerings of third-party speakers, nor is Tradu responsible for the content, veracity or opinions of third-party speakers, presenters or participants.
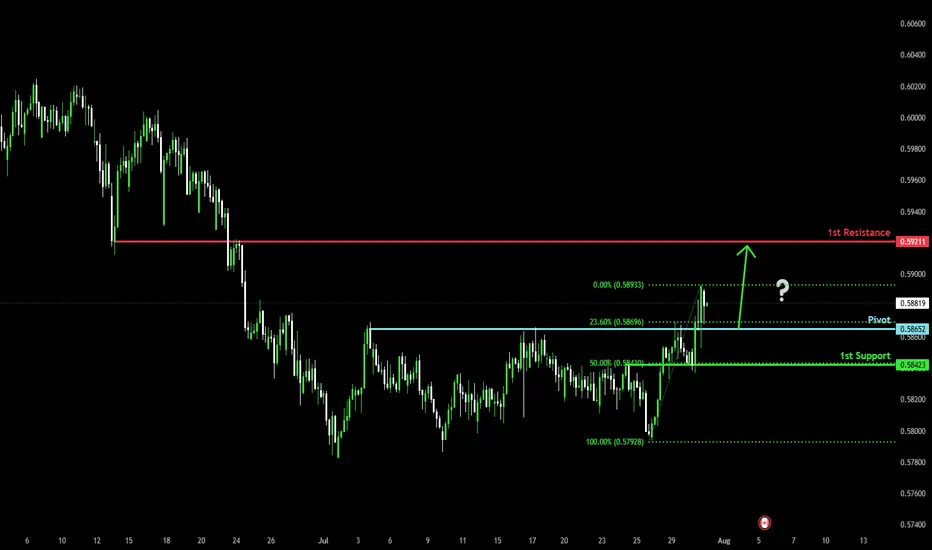
Bullish bounce off pullback support?CAD/CHF is falling towards the pivot, which acts as a pullback support and could bounce to the 1st resistance, which is also a pullback resistance.
Pivot: 0.58652
1st Support: 0.58423
1st Resistance: 0.59211
Risk Warning:
Trading Forex and CFDs carries a high level of risk to your capital and you should only trade with money you can afford to lose. Trading Forex and CFDs may not be suitable for all investors, so please ensure that you fully understand the risks involved and seek independent advice if necessary.
Disclaimer:
The above opinions given constitute general market commentary, and do not constitute the opinion or advice of IC Markets or any form of personal or investment advice.
Any opinions, news, research, analyses, prices, other information, or links to third-party sites contained on this website are provided on an "as-is" basis, are intended only to be informative, is not an advice nor a recommendation, nor research, or a record of our trading prices, or an offer of, or solicitation for a transaction in any financial instrument and thus should not be treated as such. The information provided does not involve any specific investment objectives, financial situation and needs of any specific person who may receive it. Please be aware, that past performance is not a reliable indicator of future performance and/or results. Past Performance or Forward-looking scenarios based upon the reasonable beliefs of the third-party provider are not a guarantee of future performance. Actual results may differ materially from those anticipated in forward-looking or past performance statements. IC Markets makes no representation or warranty and assumes no liability as to the accuracy or completeness of the information provided, nor any loss arising from any investment based on a recommendation, forecast or any information supplied by any third-party.