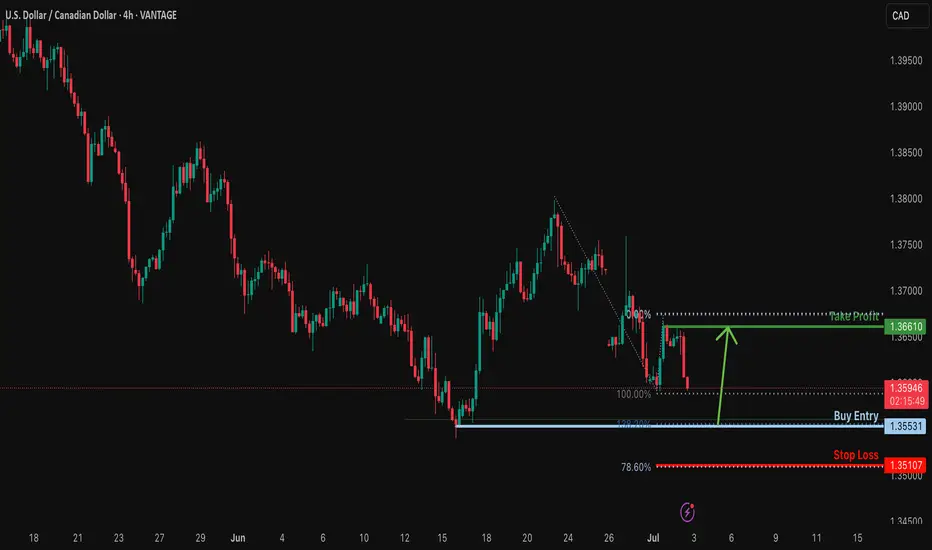
Bullish bounce?USD/CAD is falling towards the support level which is a pullback support that aligns with the 138.2% Fibonacci extension and could bounce from this level to our take profit.
Entry: 1.3553
Why we like it:
There is a pullback support level that lines up with the 138.2% Fibonacci extension.
Stop loss: 1.3510
Why we like it:
There is a support level at the 78.6% Fibonacci projection.
Take profit: 1.3661
Why we like it:
There is a pullback resistance level.
Enjoying your TradingView experience? Review us!
Please be advised that the information presented on TradingView is provided to Vantage (‘Vantage Global Limited’, ‘we’) by a third-party provider (‘Everest Fortune Group’). Please be reminded that you are solely responsible for the trading decisions on your account. There is a very high degree of risk involved in trading. Any information and/or content is intended entirely for research, educational and informational purposes only and does not constitute investment or consultation advice or investment strategy. The information is not tailored to the investment needs of any specific person and therefore does not involve a consideration of any of the investment objectives, financial situation or needs of any viewer that may receive it. Kindly also note that past performance is not a reliable indicator of future results. Actual results may differ materially from those anticipated in forward-looking or past performance statements. We assume no liability as to the accuracy or completeness of any of the information and/or content provided herein and the Company cannot be held responsible for any omission, mistake nor for any loss or damage including without limitation to any loss of profit which may arise from reliance on any information supplied by Everest Fortune Group.
Forexsignals
Bullish bouce off major support?GBP/USD has bounced off the support level which is an overlap support that lines up with the 38.2% Fibonacci retracement and could rise from this level to our take profit.
Pivot: 1.3609
Why we like it:
There is an overlap support level which lines up with the 38.2% Fibonacci retracement.
Stop loss: 1.3534
Why we like it:
There is a pullback support that is slightly above the 61.8% Fibonacci retracement.
Take profit: 1.3750
Why we like it:
There is a pullback resistance.
Enjoying your TradingView experience? Review us!
Please be advised that the information presented on TradingView is provided to Vantage (‘Vantage Global Limited’, ‘we’) by a third-party provider (‘Everest Fortune Group’). Please be reminded that you are solely responsible for the trading decisions on your account. There is a very high degree of risk involved in trading. Any information and/or content is intended entirely for research, educational and informational purposes only and does not constitute investment or consultation advice or investment strategy. The information is not tailored to the investment needs of any specific person and therefore does not involve a consideration of any of the investment objectives, financial situation or needs of any viewer that may receive it. Kindly also note that past performance is not a reliable indicator of future results. Actual results may differ materially from those anticipated in forward-looking or past performance statements. We assume no liability as to the accuracy or completeness of any of the information and/or content provided herein and the Company cannot be held responsible for any omission, mistake nor for any loss or damage including without limitation to any loss of profit which may arise from reliance on any information supplied by Everest Fortune Group.

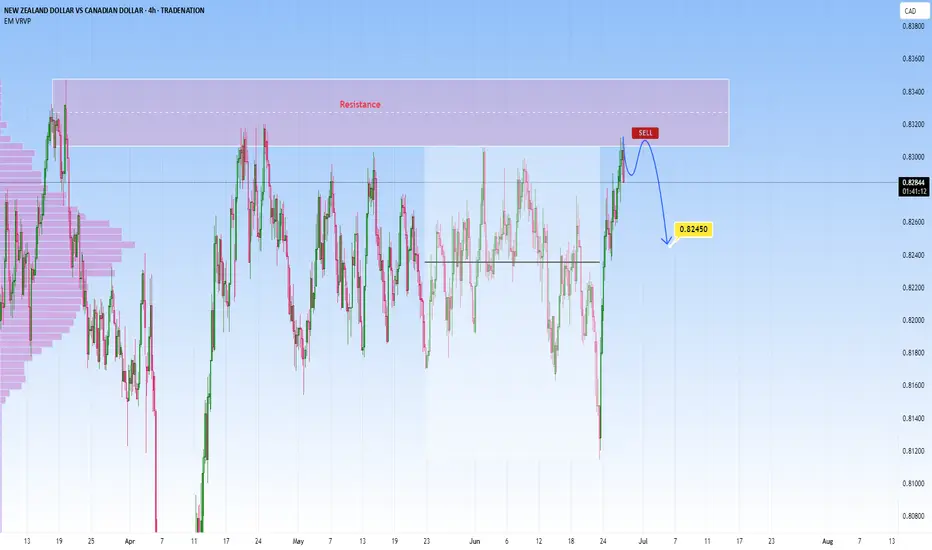
NZDCAD reached key resistance: Rebound to 0.82450 likelyPrice on NZDCAD has reached a pretty significant resistance level, that has been a key turning point in the past, with several strong reversals from the area. So naturally, I’ve been watching to see how price reacts here again.
We can already see early signs of rejection, so I will monitor this pair and I’ll be looking for short setups from the zone again.
🟥 My sell idea is based on the expectation that this resistance will hold. I would be targeting a move down toward the 0.82450 level , which I feel is a realistic target before any reversal could take from the gains, especially if price respects this structure continuously.
But if price breaks above and starts holding strong above the zone, then I’ll back off the bearish bias and reassess, and I’d consider the bearish idea invalidated, with potential for further upside.
Just sharing how I see the chart right now, not financial advice
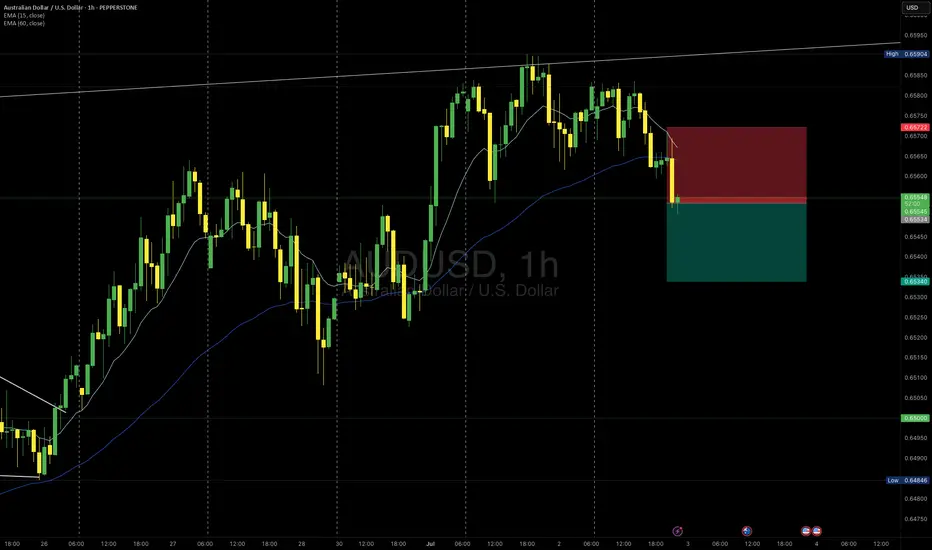
AUDUSD – Bearish Breakdown Below EMA Support🚀👆 Boost it if you like it...👆🚀
Price has broken decisively below the EMA cluster after consolidating in a tight range. The strong bearish candle suggests momentum toward lower support levels.
Trade Plan:
✅ Entry:
Current price ~0.65545
✅ Stop Loss:
Above 0.657722 (last minor swing high)
✅ Target:
0.65340 – 0.6500 area (previous demand and round number support)
Context:
• EMA confluence failure
• Clear bearish momentum candle
• Clean risk-to-reward setup
Risk Management:
Risk per trade: 1%
Hashtags:
#AUDUSD #ForexSignals #PriceAction #Breakdown #MJTrading #TradingIdea #Forex
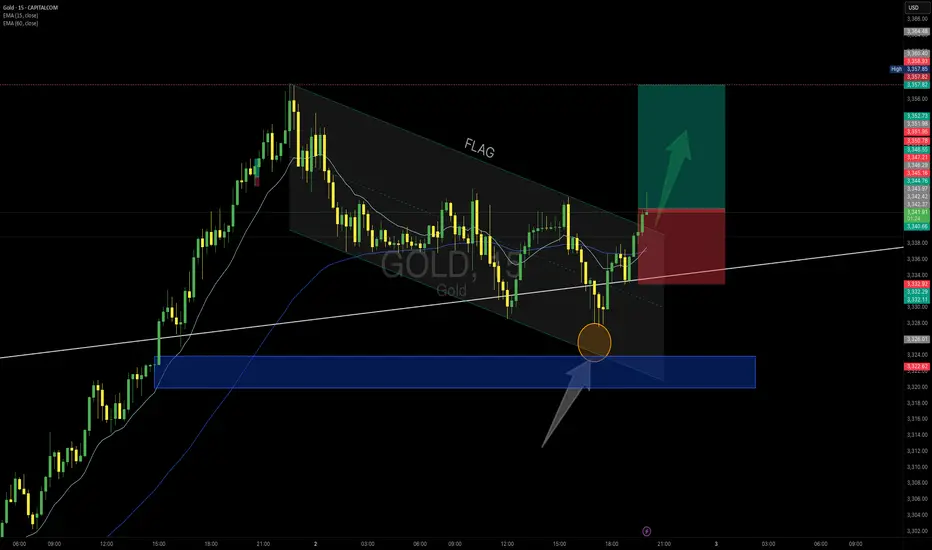
GOLD – Bullish Flag Breakout After Demand Zone Test
Price pulled back into the major demand zone (blue area), rejected with a strong wick, and formed a bullish flag structure. The breakout above the flag channel suggests continuation toward recent highs.
Trade Plan:
✅ Entry:
Above 3344 (breakout confirmation)
✅ Stop Loss:
Below 3332 (last swing low)
✅ Target:
3357–3360 (previous resistance zone)
Context:
• Demand zone respected
• EMA support aligning
• Clear breakout candle with volume
Risk Management:
Max risk per trade: 1%
Zoom in M5:
#Gold #XAUUSD #PriceAction #BreakoutTrading #MJTrading #ForexSignals #CommodityTrading
GBPUSD - Trade Idea for Today ! Hurry Up !Details on chart. There some important levels here and we might see a downward move here.
CMCMARKETS:GBPUSD FX:GBPUSD OANDA:GBPUSD FX_IDC:GBPUSD

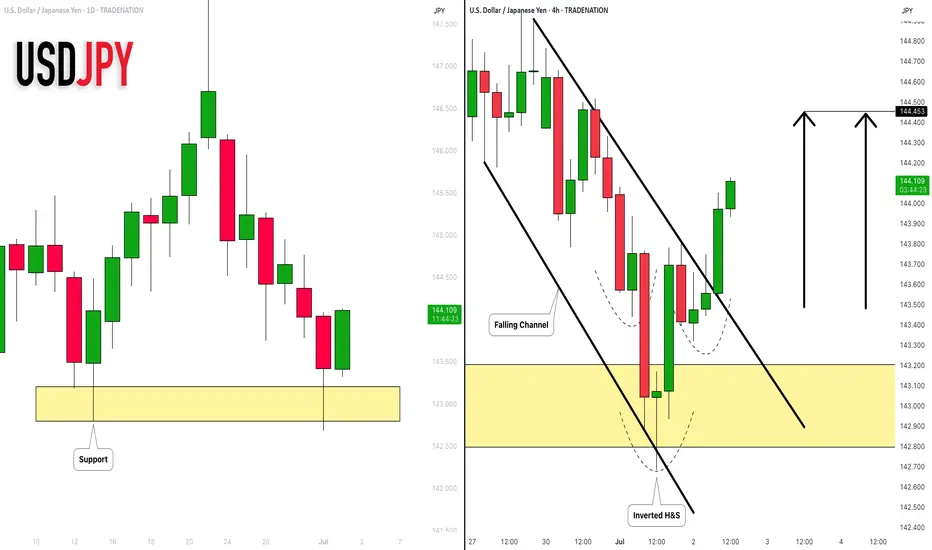
USDJPY: Strong Bullish Price Action 🇺🇸🇯🇵
I see 2 strong bullish confirmation on USDJPY after a test of a key daily
support cluster.
The price violated a trend line of a falling channel and a neckline of
an inverted head & shoulders pattern with one single strong bullish candle.
The pair may rise more and reach 144.45 level soon.
❤️Please, support my work with like, thank you!❤️
I am part of Trade Nation's Influencer program and receive a monthly fee for using their TradingView charts in my analysis.
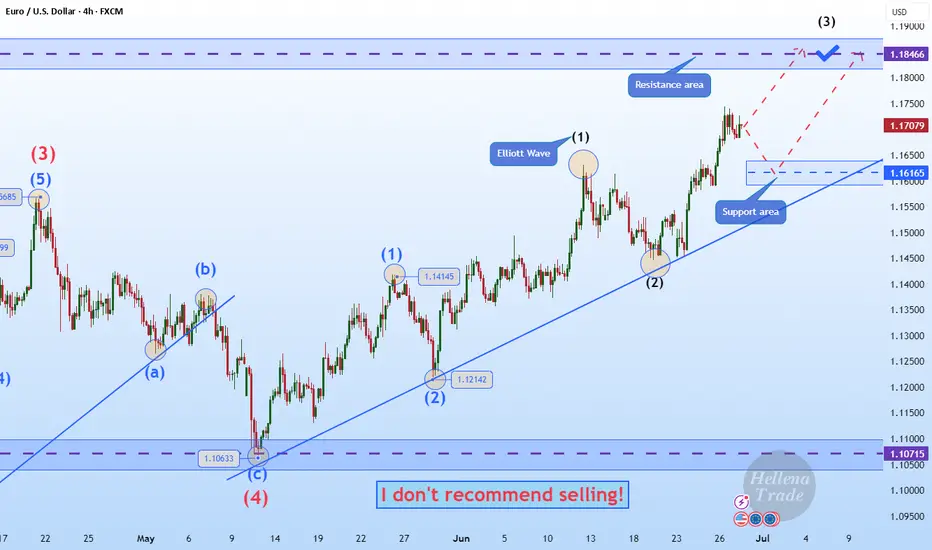
Hellena | EUR/USD (4H): LONG to the resistance area 1.18466.Dear colleagues, I believe that the upward movement continues. The five-wave impulse is not over yet, and I see that the price is now in the upward wave “3” of the higher order and in the upward wave “3” of the lower order.
Therefore, I expect a small correction to the 1.16165 area, after which I expect the price to reach at least the 1.18466 resistance area.
Manage your capital correctly and competently! Only enter trades based on reliable patterns!
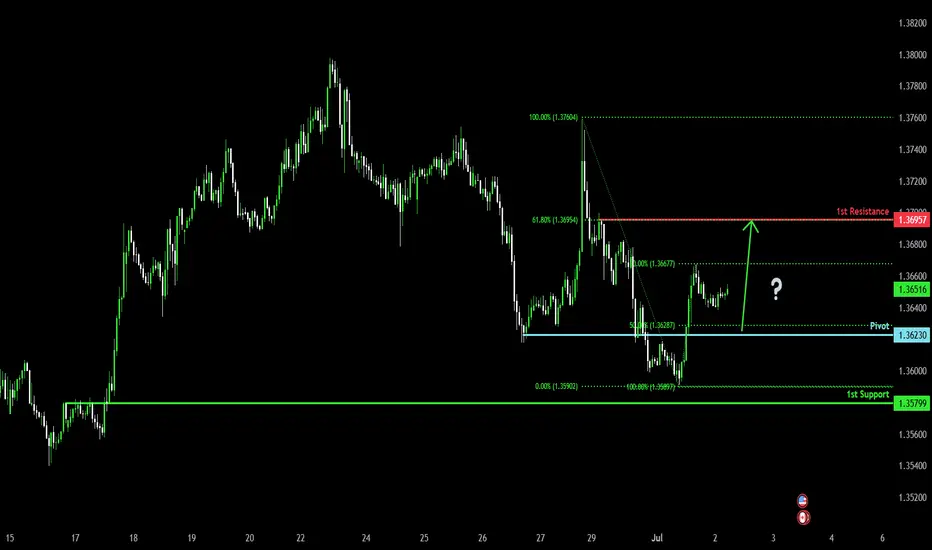
Falling towards 50% Fibonacci support?The Loonie (USD/CAD) is falling towards, the pivot which acts as a pullback support and could bounce to the 61.8% Fibonacci resistance.
Pivot: 1.3623
1st Support: 1.3579
1st Resistance: 1.3695
Risk Warning:
Trading Forex and CFDs carries a high level of risk to your capital and you should only trade with money you can afford to lose. Trading Forex and CFDs may not be suitable for all investors, so please ensure that you fully understand the risks involved and seek independent advice if necessary.
Disclaimer:
The above opinions given constitute general market commentary, and do not constitute the opinion or advice of IC Markets or any form of personal or investment advice.
Any opinions, news, research, analyses, prices, other information, or links to third-party sites contained on this website are provided on an "as-is" basis, are intended only to be informative, is not an advice nor a recommendation, nor research, or a record of our trading prices, or an offer of, or solicitation for a transaction in any financial instrument and thus should not be treated as such. The information provided does not involve any specific investment objectives, financial situation and needs of any specific person who may receive it. Please be aware, that past performance is not a reliable indicator of future performance and/or results. Past Performance or Forward-looking scenarios based upon the reasonable beliefs of the third-party provider are not a guarantee of future performance. Actual results may differ materially from those anticipated in forward-looking or past performance statements. IC Markets makes no representation or warranty and assumes no liability as to the accuracy or completeness of the information provided, nor any loss arising from any investment based on a recommendation, forecast or any information supplied by any third-party.
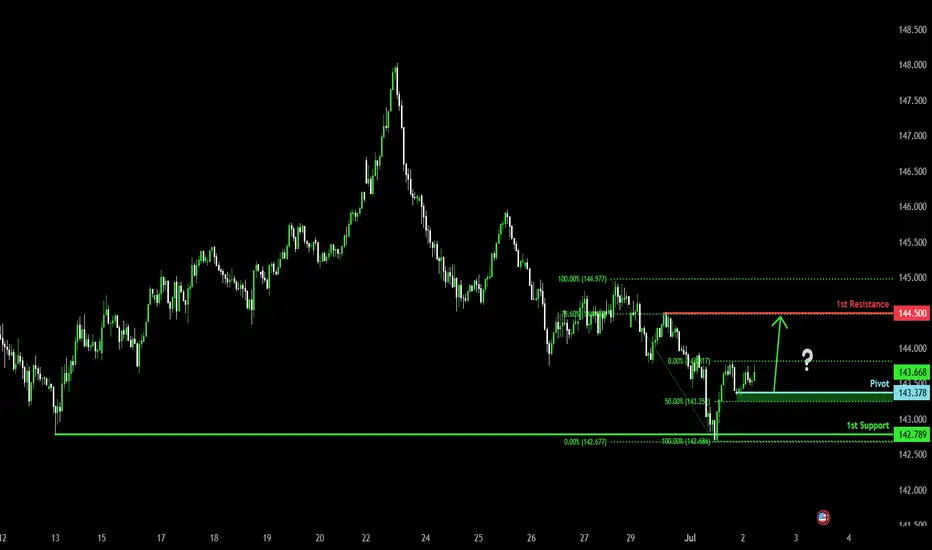
Potential bullish continuation?USD/JPY has bounced off the pivot and could rise to the 1st resistance, which aligns with the 78.6% Fibonacci retracement.
Pivot: 143.37
1st Support: 142.78
1st Resistance: 144.50
Risk Warning:
Trading Forex and CFDs carries a high level of risk to your capital and you should only trade with money you can afford to lose. Trading Forex and CFDs may not be suitable for all investors, so please ensure that you fully understand the risks involved and seek independent advice if necessary.
Disclaimer:
The above opinions given constitute general market commentary, and do not constitute the opinion or advice of IC Markets or any form of personal or investment advice.
Any opinions, news, research, analyses, prices, other information, or links to third-party sites contained on this website are provided on an "as-is" basis, are intended only to be informative, is not an advice nor a recommendation, nor research, or a record of our trading prices, or an offer of, or solicitation for a transaction in any financial instrument and thus should not be treated as such. The information provided does not involve any specific investment objectives, financial situation and needs of any specific person who may receive it. Please be aware, that past performance is not a reliable indicator of future performance and/or results. Past Performance or Forward-looking scenarios based upon the reasonable beliefs of the third-party provider are not a guarantee of future performance. Actual results may differ materially from those anticipated in forward-looking or past performance statements. IC Markets makes no representation or warranty and assumes no liability as to the accuracy or completeness of the information provided, nor any loss arising from any investment based on a recommendation, forecast or any information supplied by any third-party.
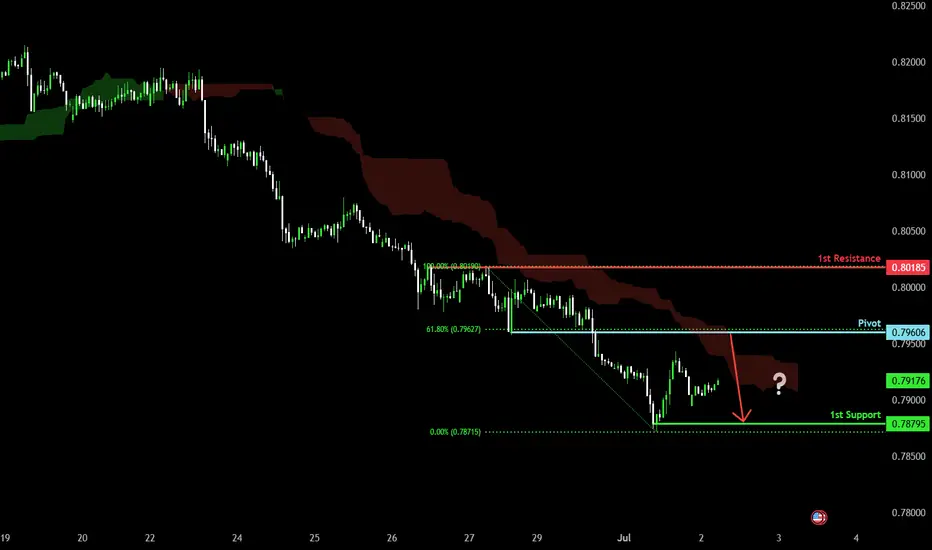
Bearish continuation?The Swissie (USD/CHF) is rising towards the pivot, which has been identified as a pullback resistance and could reverse to the 1st support.
Pivot: 0.7960
1st Support: 0.7879
1st Resistance: 0.8018
Risk Warning:
Trading Forex and CFDs carries a high level of risk to your capital and you should only trade with money you can afford to lose. Trading Forex and CFDs may not be suitable for all investors, so please ensure that you fully understand the risks involved and seek independent advice if necessary.
Disclaimer:
The above opinions given constitute general market commentary, and do not constitute the opinion or advice of IC Markets or any form of personal or investment advice.
Any opinions, news, research, analyses, prices, other information, or links to third-party sites contained on this website are provided on an "as-is" basis, are intended only to be informative, is not an advice nor a recommendation, nor research, or a record of our trading prices, or an offer of, or solicitation for a transaction in any financial instrument and thus should not be treated as such. The information provided does not involve any specific investment objectives, financial situation and needs of any specific person who may receive it. Please be aware, that past performance is not a reliable indicator of future performance and/or results. Past Performance or Forward-looking scenarios based upon the reasonable beliefs of the third-party provider are not a guarantee of future performance. Actual results may differ materially from those anticipated in forward-looking or past performance statements. IC Markets makes no representation or warranty and assumes no liability as to the accuracy or completeness of the information provided, nor any loss arising from any investment based on a recommendation, forecast or any information supplied by any third-party.
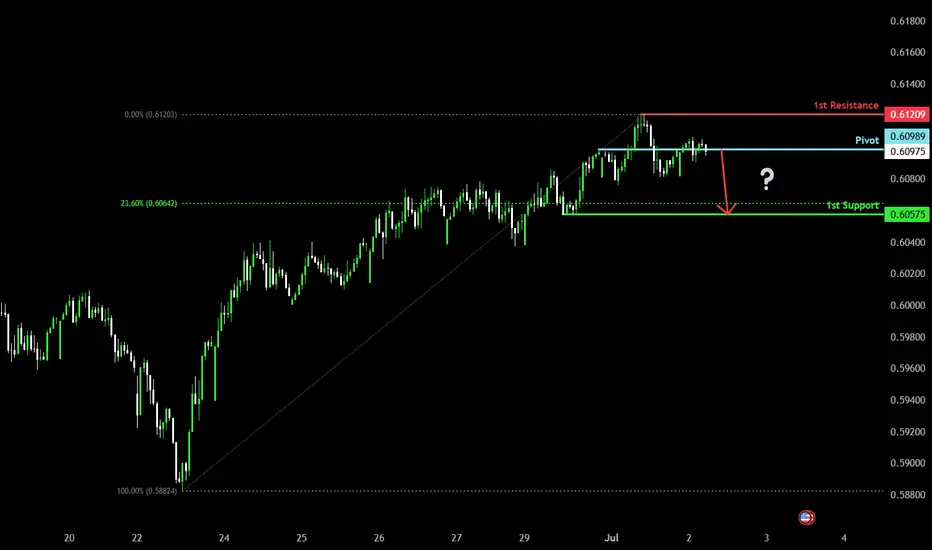
Potential bearish drop?The Kiwi (NZD/USD) is reacting off the pivot which is a pullback resistance and could drop to the 1st support.
Pivot: 0.6098
1st Support: 0.6057
1st Resistance: 0.6120
Risk Warning:
Trading Forex and CFDs carries a high level of risk to your capital and you should only trade with money you can afford to lose. Trading Forex and CFDs may not be suitable for all investors, so please ensure that you fully understand the risks involved and seek independent advice if necessary.
Disclaimer:
The above opinions given constitute general market commentary, and do not constitute the opinion or advice of IC Markets or any form of personal or investment advice.
Any opinions, news, research, analyses, prices, other information, or links to third-party sites contained on this website are provided on an "as-is" basis, are intended only to be informative, is not an advice nor a recommendation, nor research, or a record of our trading prices, or an offer of, or solicitation for a transaction in any financial instrument and thus should not be treated as such. The information provided does not involve any specific investment objectives, financial situation and needs of any specific person who may receive it. Please be aware, that past performance is not a reliable indicator of future performance and/or results. Past Performance or Forward-looking scenarios based upon the reasonable beliefs of the third-party provider are not a guarantee of future performance. Actual results may differ materially from those anticipated in forward-looking or past performance statements. IC Markets makes no representation or warranty and assumes no liability as to the accuracy or completeness of the information provided, nor any loss arising from any investment based on a recommendation, forecast or any information supplied by any third-party.
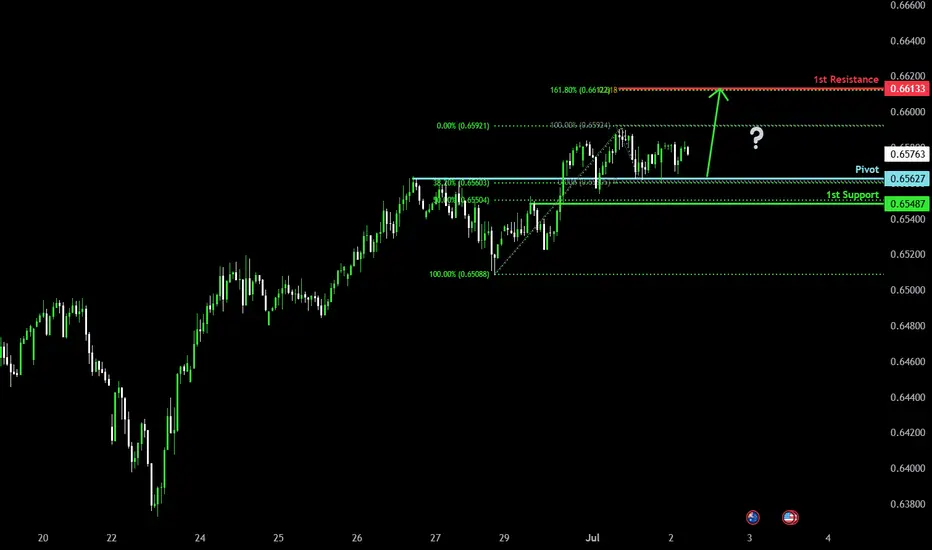
Bullish bounce?The Aussie (AUD/USD) is falling towards the pivot and could bounce to the 1st resistance that aligns with the 161.8% Fibonacci extension and the 61.8% Fibonacci projection.
Pivot: 0.6562
1st Support: 0.6548
1st Resistance: 0.6613
Risk Warning:
Trading Forex and CFDs carries a high level of risk to your capital and you should only trade with money you can afford to lose. Trading Forex and CFDs may not be suitable for all investors, so please ensure that you fully understand the risks involved and seek independent advice if necessary.
Disclaimer:
The above opinions given constitute general market commentary, and do not constitute the opinion or advice of IC Markets or any form of personal or investment advice.
Any opinions, news, research, analyses, prices, other information, or links to third-party sites contained on this website are provided on an "as-is" basis, are intended only to be informative, is not an advice nor a recommendation, nor research, or a record of our trading prices, or an offer of, or solicitation for a transaction in any financial instrument and thus should not be treated as such. The information provided does not involve any specific investment objectives, financial situation and needs of any specific person who may receive it. Please be aware, that past performance is not a reliable indicator of future performance and/or results. Past Performance or Forward-looking scenarios based upon the reasonable beliefs of the third-party provider are not a guarantee of future performance. Actual results may differ materially from those anticipated in forward-looking or past performance statements. IC Markets makes no representation or warranty and assumes no liability as to the accuracy or completeness of the information provided, nor any loss arising from any investment based on a recommendation, forecast or any information supplied by any third-party.
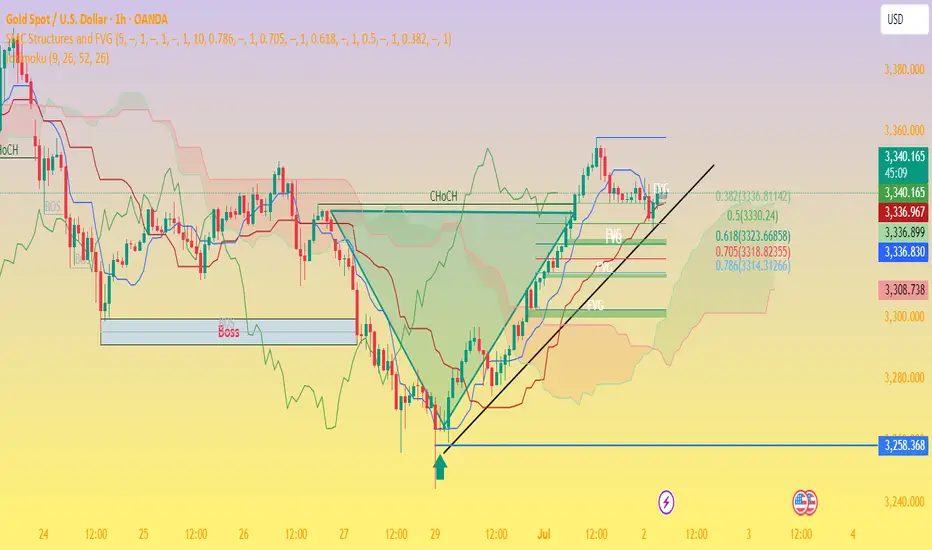
Gold Price Analysis – Bullish Momentum Holds Above FVGs🧠 Chart Breakdown:
Instrument: Gold Spot (XAU/USD)
Timeframe: 1H
Current Price: $3,340
Trend: Short-term uptrend intact
🔑 Key Observations:
Ch.o.Ch Confirmed (Change of Character):
The break above the previous structure high confirmed a bullish market structure shift.
Fair Value Gaps (FVG):
Multiple FVGs exist between $3,320 – $3,335, acting as potential demand zones and support levels.
Fibonacci Retracement:
Price is respecting the 0.382–0.5 levels ($3,336 – $3,330) well so far.
Below this, the 0.618 level at $3,325 is the next strong confluence zone.
Trendline Support:
The price is testing a rising trendline, adding dynamic support around the current level.
Ichimoku Cloud:
Price is above the cloud, which supports the bullish bias.
Conversion line (blue) and base line (red) are bullishly aligned.
📉 Possible Next Moves:
✅ Bullish Scenario:
Price bounces from current levels or slightly lower ($3,336–$3,330) and retests the recent high (~$3,355).
Breakout above $3,355 could open the door to $3,370+.
⚠️ Bearish Scenario:
If price breaks below $3,330 and the trendline, expect deeper pullbacks to:
$3,325 (0.618 Fib)
Then possibly $3,308 FVG support or $3,258 major demand zone.
📌 Conclusion:
Gold is still respecting bullish market structure with healthy pullbacks into support zones. As long as the price stays above $3,325, the bullish outlook remains valid. Watch for bullish reaction near the FVGs or a break above $3,355 to confirm upside continuation.
Bearish drop?The Cable (GBP/USD) is reacting off the pivot and could drop to the 1st support.
Pivot: 1.3749
1st Support: 1.3684
1st Resistance: 1.3788
Risk Warning:
Trading Forex and CFDs carries a high level of risk to your capital and you should only trade with money you can afford to lose. Trading Forex and CFDs may not be suitable for all investors, so please ensure that you fully understand the risks involved and seek independent advice if necessary.
Disclaimer:
The above opinions given constitute general market commentary, and do not constitute the opinion or advice of IC Markets or any form of personal or investment advice.
Any opinions, news, research, analyses, prices, other information, or links to third-party sites contained on this website are provided on an "as-is" basis, are intended only to be informative, is not an advice nor a recommendation, nor research, or a record of our trading prices, or an offer of, or solicitation for a transaction in any financial instrument and thus should not be treated as such. The information provided does not involve any specific investment objectives, financial situation and needs of any specific person who may receive it. Please be aware, that past performance is not a reliable indicator of future performance and/or results. Past Performance or Forward-looking scenarios based upon the reasonable beliefs of the third-party provider are not a guarantee of future performance. Actual results may differ materially from those anticipated in forward-looking or past performance statements. IC Markets makes no representation or warranty and assumes no liability as to the accuracy or completeness of the information provided, nor any loss arising from any investment based on a recommendation, forecast or any information supplied by any third-party.

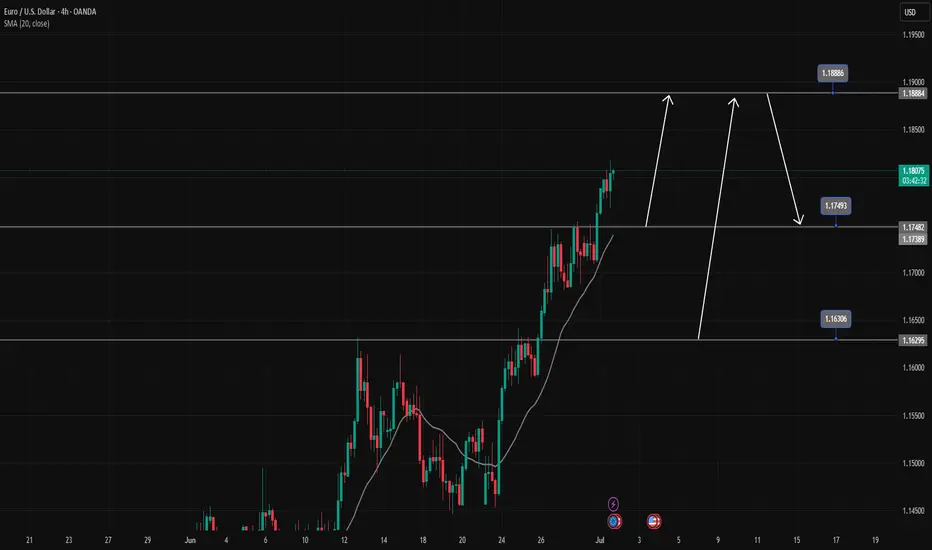
EURUSD is in a strong uptrendEURUSD is in a strong uptrend, Price just broke the resistance zone of 1.175.
All the bullish momentum is heading towards the resistance zone of 1.188.
If there is a close of the h4 candle below the resistance zone of 1.175, there will likely be a Pullback to 1.163 to find more buying momentum towards the target at the resistance zone of 1.188
📈 Key Levels
Support: 1.175-1.163
Resistance: 1.188
📊 Recommended Trade Setups
BUY EURUSD 1.175-1.173 Stoploss 1.170
BUY EURUSD 1.163-1.161 Stoploss 1.158
SELL EURUSD 1.188-1.190 Stoploss 1.1930
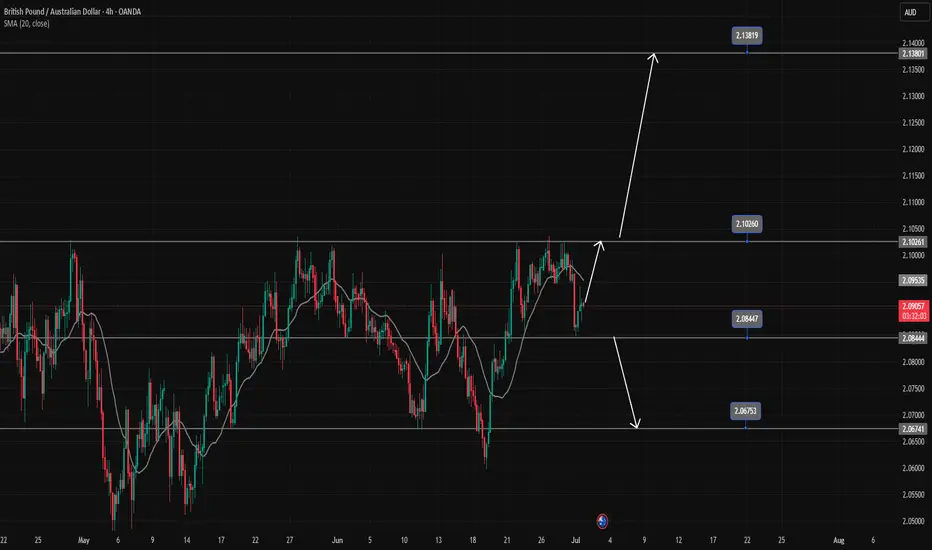
GBPAUD waiting for conditions to break out of the wide rangeGBPAUD found some buying momentum at the 2.085 support in today's trading session. In the long term, the pair's trading range is wide, extending from 2.102 to 2.067. A breakout of this range will form a new trend.
A BUY trading signal is confirmed when the pair breaks the resistance at 2.10200.
A SELL signal is confirmed when the pair breaks the support at 2.085.
📈 Key Levels
Support: 2.085 - 2.067
Resistance: 2.102 - 2.138
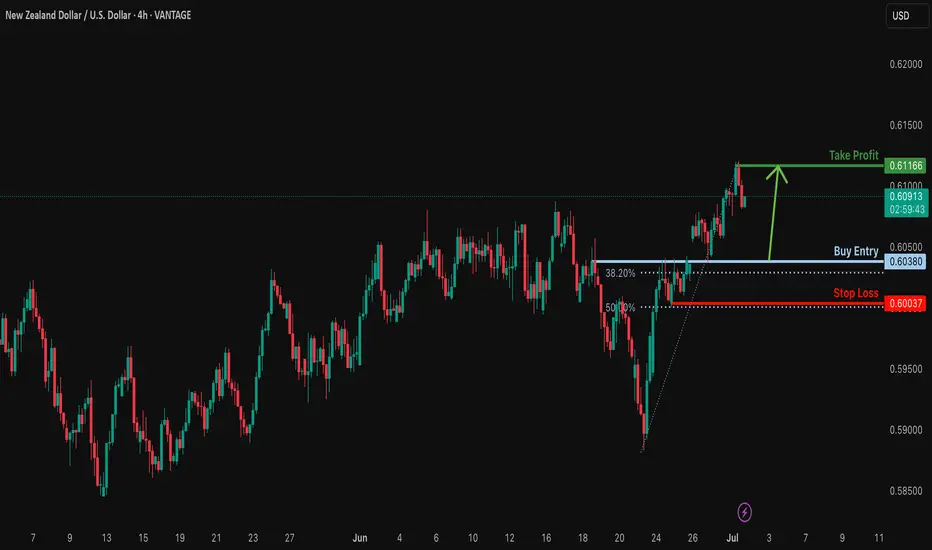
Bullish bounce?NZD/USD is falling towards the support level which is an overlap support that is slightly above the 38.2% Fibonacci retracement and could bounce from this level to our take profit.
Entry: 0.6038
Why we like it:
There is an overlap support that is slightly above the 38.2% Fibonacci retracement.
Stop loss: 0.6038
Why we like it:
There is a pullback support that aligns with the 50% Fibonacci retracement.
Take profit: 0.6116
Why we like it:
There is a pullback resistance.
Enjoying your TradingView experience? Review us!
Please be advised that the information presented on TradingView is provided to Vantage (‘Vantage Global Limited’, ‘we’) by a third-party provider (‘Everest Fortune Group’). Please be reminded that you are solely responsible for the trading decisions on your account. There is a very high degree of risk involved in trading. Any information and/or content is intended entirely for research, educational and informational purposes only and does not constitute investment or consultation advice or investment strategy. The information is not tailored to the investment needs of any specific person and therefore does not involve a consideration of any of the investment objectives, financial situation or needs of any viewer that may receive it. Kindly also note that past performance is not a reliable indicator of future results. Actual results may differ materially from those anticipated in forward-looking or past performance statements. We assume no liability as to the accuracy or completeness of any of the information and/or content provided herein and the Company cannot be held responsible for any omission, mistake nor for any loss or damage including without limitation to any loss of profit which may arise from reliance on any information supplied by Everest Fortune Group.
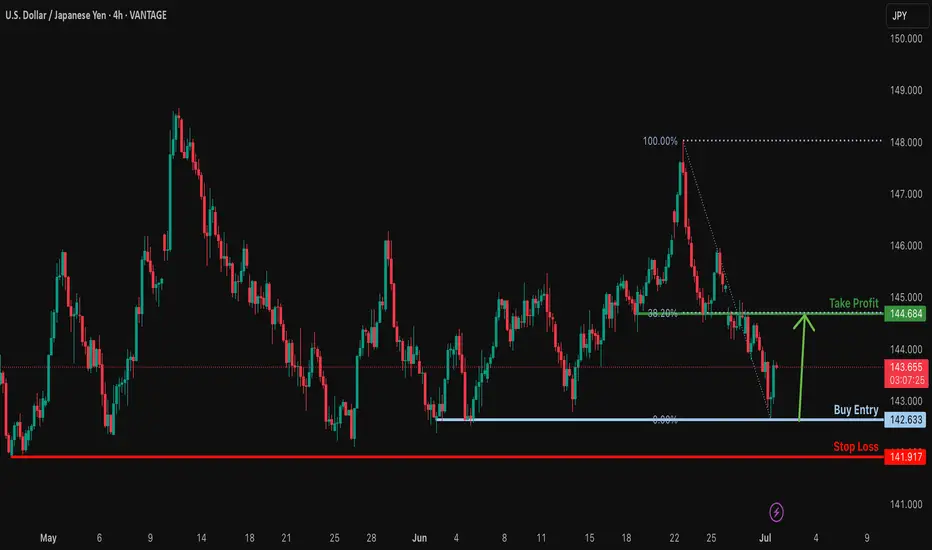
Bullish bounce off pullback support?USD/JPY has bounced off the support level which is a pullback support and could potentially rise from this level to our take profit.
Entry: 142.63
Why we like it:
There is a pullback support.
Stop loss: 141.91
Why we like it:
There is a pullback support.
Take profit: 144.68
Why we like it:
There is an overlap resistance that lines up with the 38.2% Fibonacci retracement.
Enjoying your TradingView experience? Review us!
Please be advised that the information presented on TradingView is provided to Vantage (‘Vantage Global Limited’, ‘we’) by a third-party provider (‘Everest Fortune Group’). Please be reminded that you are solely responsible for the trading decisions on your account. There is a very high degree of risk involved in trading. Any information and/or content is intended entirely for research, educational and informational purposes only and does not constitute investment or consultation advice or investment strategy. The information is not tailored to the investment needs of any specific person and therefore does not involve a consideration of any of the investment objectives, financial situation or needs of any viewer that may receive it. Kindly also note that past performance is not a reliable indicator of future results. Actual results may differ materially from those anticipated in forward-looking or past performance statements. We assume no liability as to the accuracy or completeness of any of the information and/or content provided herein and the Company cannot be held responsible for any omission, mistake nor for any loss or damage including without limitation to any loss of profit which may arise from reliance on any information supplied by Everest Fortune Group.
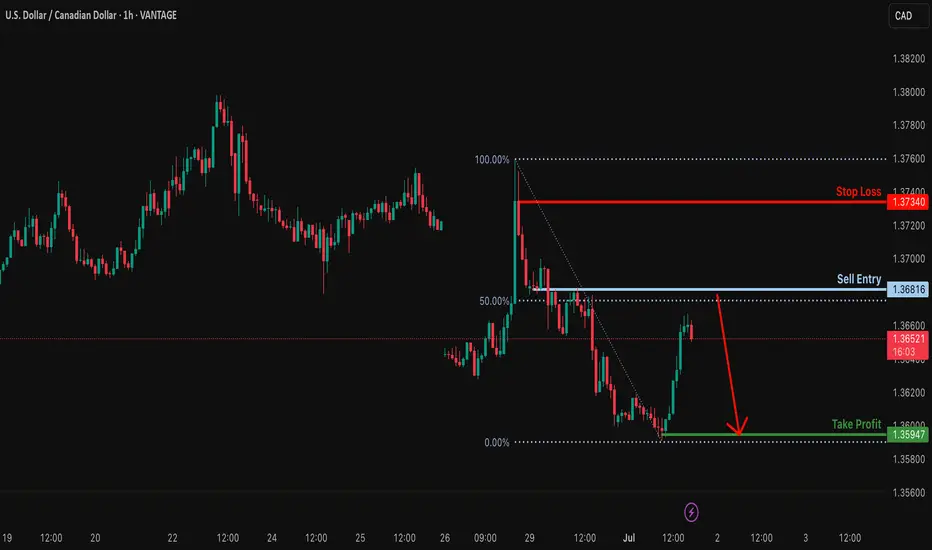
Heading into 50% Fibonacci resistance?USD/CAD is rising towards the resistance level which is a pullback resistance that lines up with the 50% Fibonacci retracement and could drop from this level to our take profit.
Entry: 1.3681
Why we like it:
There is a pullback resistance that aligns with the 50% Fibonacci retracement.
Stop loss: 1.3734
Why we like it:
There is a pullback resistance.
Take profit: 1.3594
Why we like it:
There is a pullback support.
Enjoying your TradingView experience? Review us!
Please be advised that the information presented on TradingView is provided to Vantage (‘Vantage Global Limited’, ‘we’) by a third-party provider (‘Everest Fortune Group’). Please be reminded that you are solely responsible for the trading decisions on your account. There is a very high degree of risk involved in trading. Any information and/or content is intended entirely for research, educational and informational purposes only and does not constitute investment or consultation advice or investment strategy. The information is not tailored to the investment needs of any specific person and therefore does not involve a consideration of any of the investment objectives, financial situation or needs of any viewer that may receive it. Kindly also note that past performance is not a reliable indicator of future results. Actual results may differ materially from those anticipated in forward-looking or past performance statements. We assume no liability as to the accuracy or completeness of any of the information and/or content provided herein and the Company cannot be held responsible for any omission, mistake nor for any loss or damage including without limitation to any loss of profit which may arise from reliance on any information supplied by Everest Fortune Group.
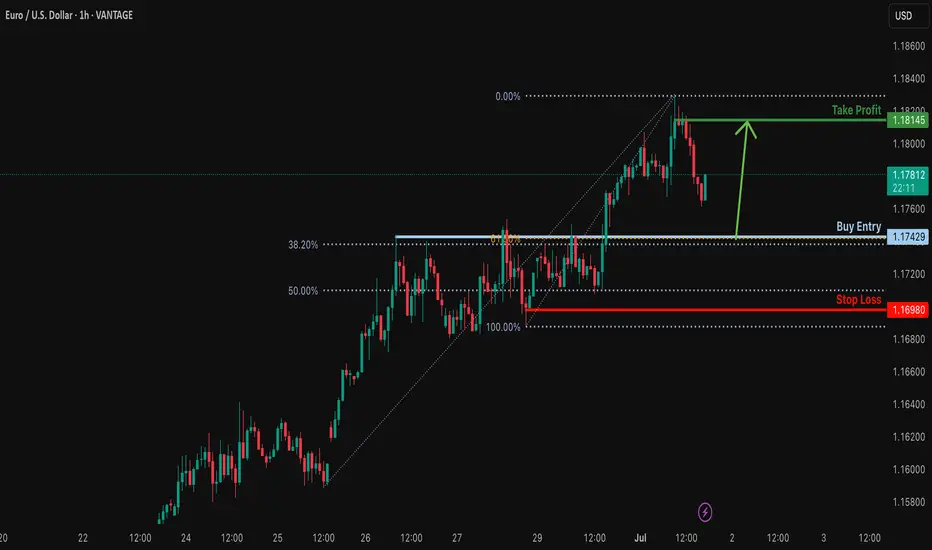
Bullish bounce off pullback support?EUR/USD is falling towards the support level which is a pullback support that aligns with the 38.2% and the 61.8% Fibonacci retracement and could bounce from this level to our take profit.
Entry: 1.1742
Why we like it:
There is a pullback support level that lines up with the 38.2% and the 61.8% Fibonacci retracement.
Stop loss: 1.1698
Why we like it:
There is a pullback support that is slightly below the 50% Fibonacci retracement.
Take profit: 1.1814
Why we like it:
There is a pullback resistance.
Enjoying your TradingView experience? Review us!
Please be advised that the information presented on TradingView is provided to Vantage (‘Vantage Global Limited’, ‘we’) by a third-party provider (‘Everest Fortune Group’). Please be reminded that you are solely responsible for the trading decisions on your account. There is a very high degree of risk involved in trading. Any information and/or content is intended entirely for research, educational and informational purposes only and does not constitute investment or consultation advice or investment strategy. The information is not tailored to the investment needs of any specific person and therefore does not involve a consideration of any of the investment objectives, financial situation or needs of any viewer that may receive it. Kindly also note that past performance is not a reliable indicator of future results. Actual results may differ materially from those anticipated in forward-looking or past performance statements. We assume no liability as to the accuracy or completeness of any of the information and/or content provided herein and the Company cannot be held responsible for any omission, mistake nor for any loss or damage including without limitation to any loss of profit which may arise from reliance on any information supplied by Everest Fortune Group.
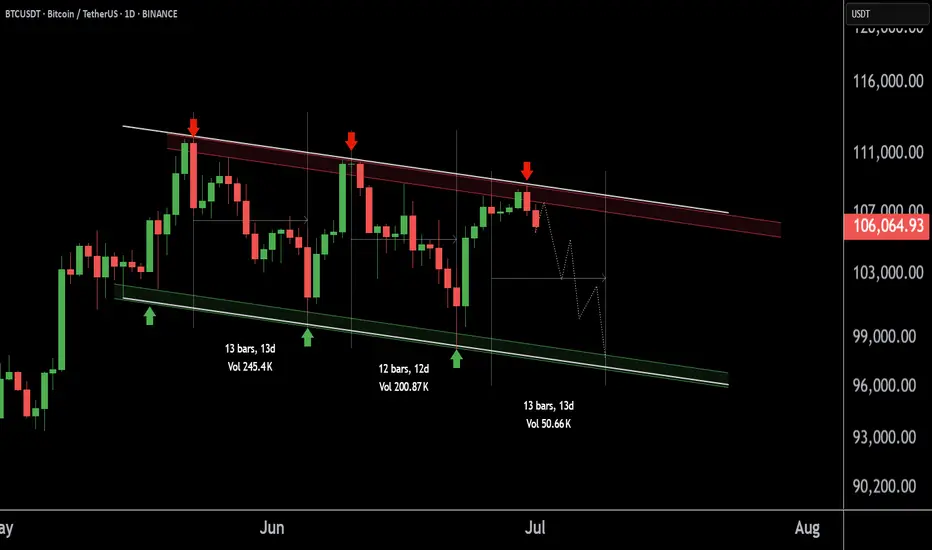
BTCUSDT at Best Resistance !!This is the Daily chart of Bitcoin .
BTCUSDT is trading near it Resistance Zone 108,600 - 107,400.
If this level is sustain , then we may see lower prices in BTCUSDT.
Thank You !!