AUDCHF: Bullish Flag from PRZ — Rally to 0.54444?AUDCHF ( OANDA:AUDCHF ) bounced from the Potential Reversal Zone (PRZ) , which aligns with the Yearly Support(1) and the 50% Fibonacci level of the previous bullish impulse.
From a Classic Technical Analysis perspective , AUDCHF appears to be breaking out of a Bullish Flag Pattern , which may suggest the continuation of the previous uptrend .
This bullish reaction also confirms the importance of the Support zone(0.51166 CHF-0.49773 CHF) , where buyers stepped in aggressively.
In terms of Elliott Wave theory , it seems that AUDCHF has completed the bearish waves and we should wait for the bullish waves .
I expect AUDCHF to continue rising after a successful breakout from the flag’s upper boundary . If momentum sustains, the target could be around 0.54444 CHF .
Note: Stop Loss (SL) = 0.51972 CHF
Australian Dollar/ Swiss Franc Analyze (4-hour time frame).
Be sure to follow the updated ideas.
Do not forget to put a Stop loss for your positions (For every position you want to open).
Please follow your strategy; this is just my idea, and I will gladly see your ideas in this post.
Please do not forget the ✅ ' like ' ✅ button 🙏😊 & Share it with your friends; thanks, and Trade safe.
Forexsignals

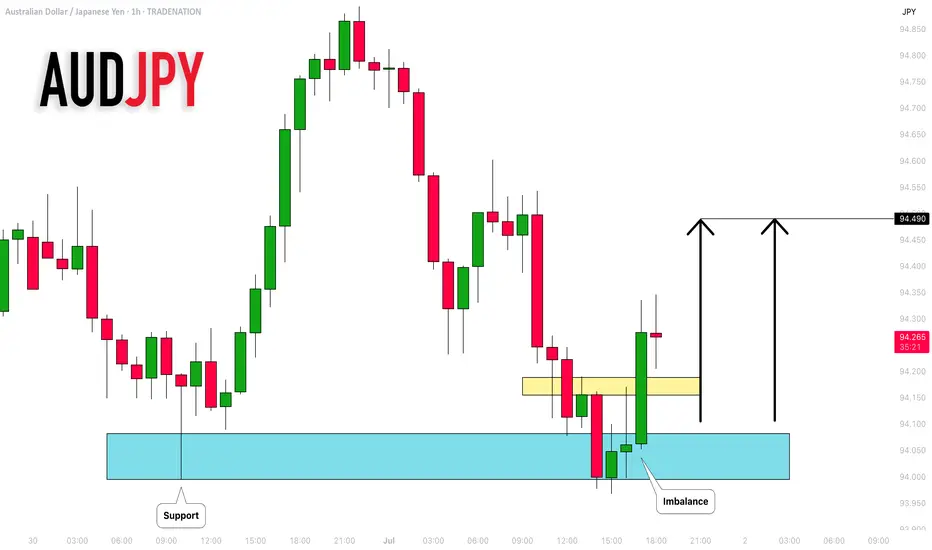
AUDJPY: Bullish Move From Support 🇦🇺🇯🇵
There is a high chance that AUDJPY will bounce
from the underlined horizontal support.
The price formed a bullish imbalance candle after its test.
I expect a rise to 94.49 level.
❤️Please, support my work with like, thank you!❤️
I am part of Trade Nation's Influencer program and receive a monthly fee for using their TradingView charts in my analysis.
#XAUUSD 30MIN 📉 #XAUUSD 30m Sell Setup – Bearish Continuation Ahead
Gold is currently retracing after a strong drop, consolidating within a short-term Supply Zone. We anticipate a temporary bullish push toward the 3345–3350 premium area, where the broader bearish trend is expected to resume.
🔻 Sell Zone: 3345 – 3350 (Supply / OB Zone)
🎯 Targets: 3300 → 3260
❌ Stop Loss: Above 3358
⚠ Note: This is a short-term retracement, not a trend reversal.
We expect selling pressure to return once price taps into the 3350 Order Block, in line with the higher timeframe bearish structure.
#gold #XAUUSD #forexsignals #SmartMoney

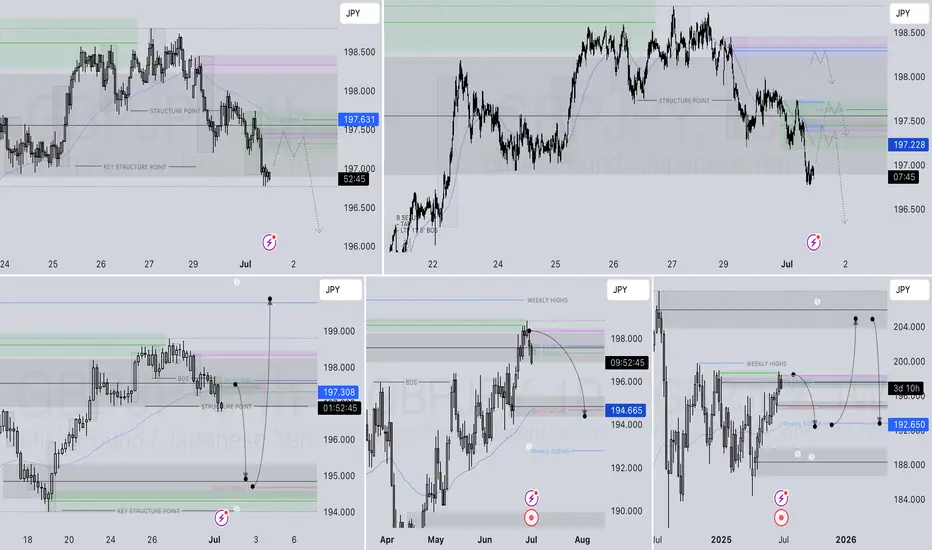
GBPJPY SHORT DAILY FORECAST Q3 D1 W27 Y25GBPJPY SHORT DAILY FORECAST Q3 D1 W27 Y25
Professional Risk Managers👋
Welcome back to another FRGNT chart update📈
Diving into some Forex setups using predominantly higher time frame order blocks alongside confirmation breaks of structure.
Let’s see what price action is telling us today! 👀
💡Here are some trade confluences📝
✅Daily Order block identified
✅4H Order Block identified
✅1H Order Block identified
🔑 Remember, to participate in trading comes always with a degree of risk, therefore as professional risk managers it remains vital that we stick to our risk management plan as well as our trading strategies.
📈The rest, we leave to the balance of probabilities.
💡Fail to plan. Plan to fail.
🏆It has always been that simple.
❤️Good luck with your trading journey, I shall see you at the very top.
🎯Trade consistent, FRGNT X
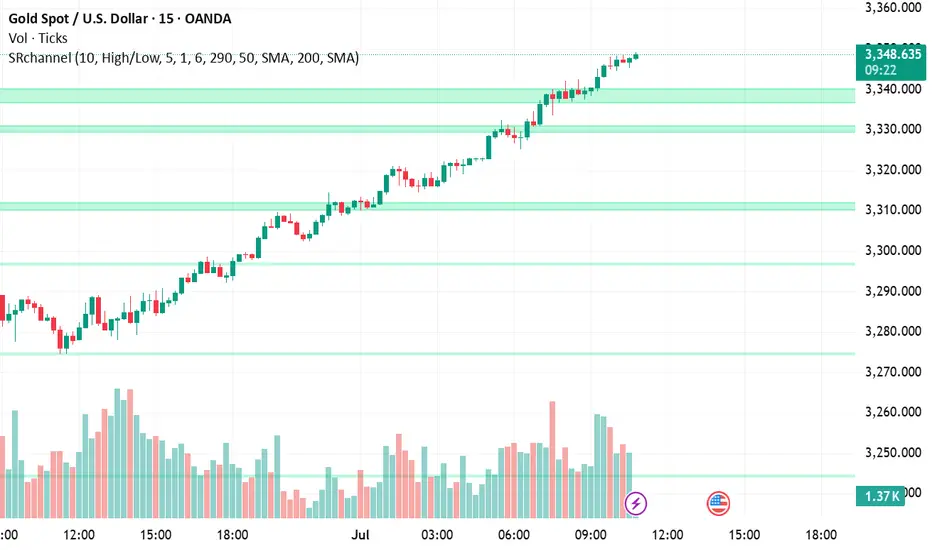
XAU/USD – Bullish Trend Faces Resistance at $3,350 XAU/USD – Bullish Trend Faces Resistance at $3,350 | Watch for Breakout or Pullback!
📅 Published on: Jul 01, 2025
✍️ By: MR_MARK0
🧠 Market Context:
Gold (XAU/USD) has been riding a strong bullish wave, pushing through multiple resistance levels. Currently, price is hovering just below the $3,350 resistance, which marks a critical level for either trend continuation or a potential pullback. Momentum remains in favor of buyers, but signs of exhaustion are beginning to surface.
🔍 Key Zones:
🔴 Resistance Zone: $3,350.0 – $3,352.5
🟢 Support Zone: $3,338.0 – $3,340.0
🟢 Demand Block: $3,310.0 – $3,315.0 (bullish base before recent breakout)
📌 Strategy in Play:
The chart reflects a Trend Continuation Strategy with key support/resistance zones identified. Price has shown strength, but we are now at a make-or-break level. Patience is crucial here.
🧭 Trade Idea:
🔁 Buy the Dip:
Entry Zone: $3,340 – $3,342
SL: Below $3,338
TP1: $3,352
TP2: $3,360
🔁 Breakout Play (Aggressive):
Entry: On breakout above $3,352 with bullish volume
SL: Below breakout candle low
TP: $3,360 and $3,372
⚠️ Risk Note:
Price is extended; a fake breakout above $3,350 may trigger a bull trap. If price fails and drops below $3,338, expect a corrective move toward $3,330 – $3,310. Watch volume divergence and candle rejection patterns.
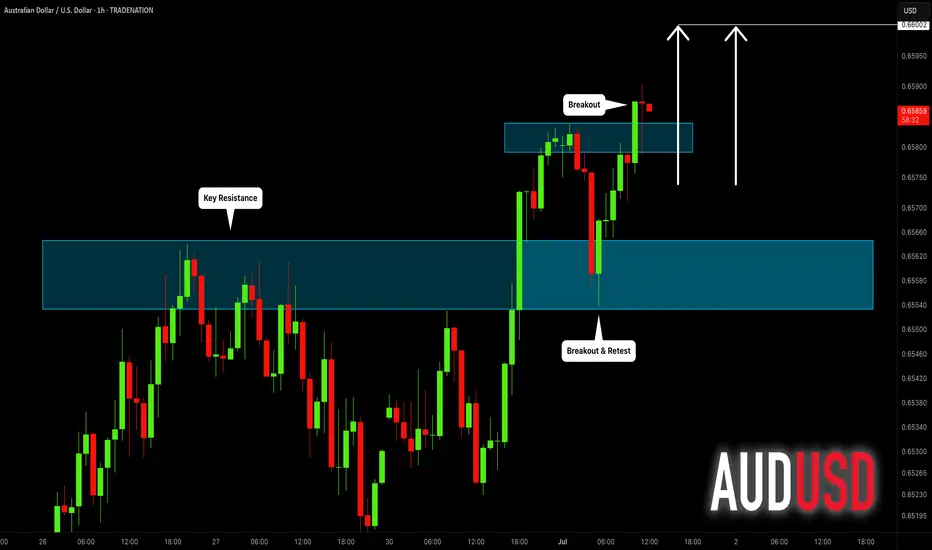
AUDUSD: Bullish Continuation After Breakout 🇦🇺🇺🇸
AUDUSD is going to rise more following a bullish breakout
of a key daily/intraday horizontal resistance.
Next goal - 0.66
❤️Please, support my work with like, thank you!❤️
I am part of Trade Nation's Influencer program and receive a monthly fee for using their TradingView charts in my analysis.
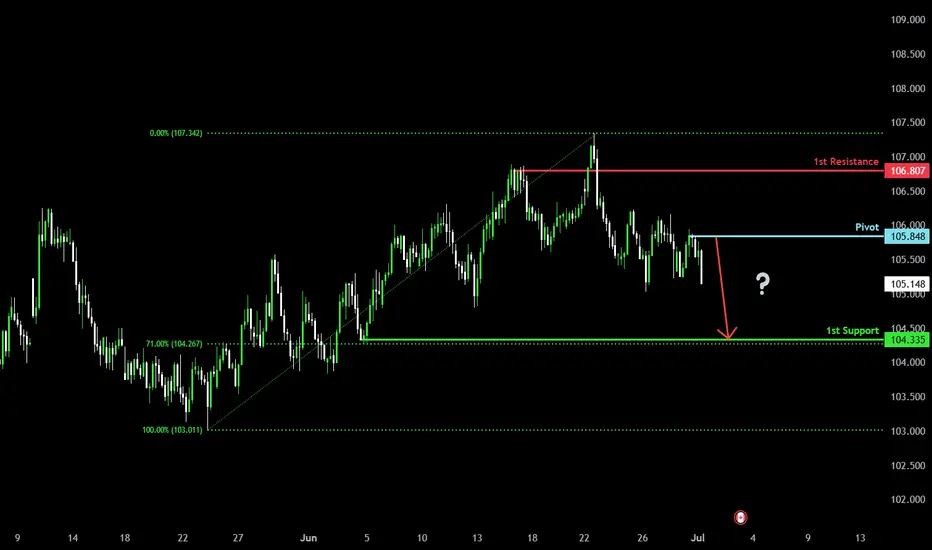
Potential bearish drop?CAD/JPY has reacted off the pivot which is a pullback resistance and could drop to the 1st support which is also a pullback support..
Pivot: 105.84
1st Support: 104.33
1st resistance: 106.80
Risk Warning:
Trading Forex and CFDs carries a high level of risk to your capital and you should only trade with money you can afford to lose. Trading Forex and CFDs may not be suitable for all investors, so please ensure that you fully understand the risks involved and seek independent advice if necessary.
Disclaimer:
The above opinions given constitute general market commentary, and do not constitute the opinion or advice of IC Markets or any form of personal or investment advice.
Any opinions, news, research, analyses, prices, other information, or links to third-party sites contained on this website are provided on an "as-is" basis, are intended only to be informative, is not an advice nor a recommendation, nor research, or a record of our trading prices, or an offer of, or solicitation for a transaction in any financial instrument and thus should not be treated as such. The information provided does not involve any specific investment objectives, financial situation and needs of any specific person who may receive it. Please be aware, that past performance is not a reliable indicator of future performance and/or results. Past Performance or Forward-looking scenarios based upon the reasonable beliefs of the third-party provider are not a guarantee of future performance. Actual results may differ materially from those anticipated in forward-looking or past performance statements. IC Markets makes no representation or warranty and assumes no liability as to the accuracy or completeness of the information provided, nor any loss arising from any investment based on a recommendation, forecast or any information supplied by any third-party.
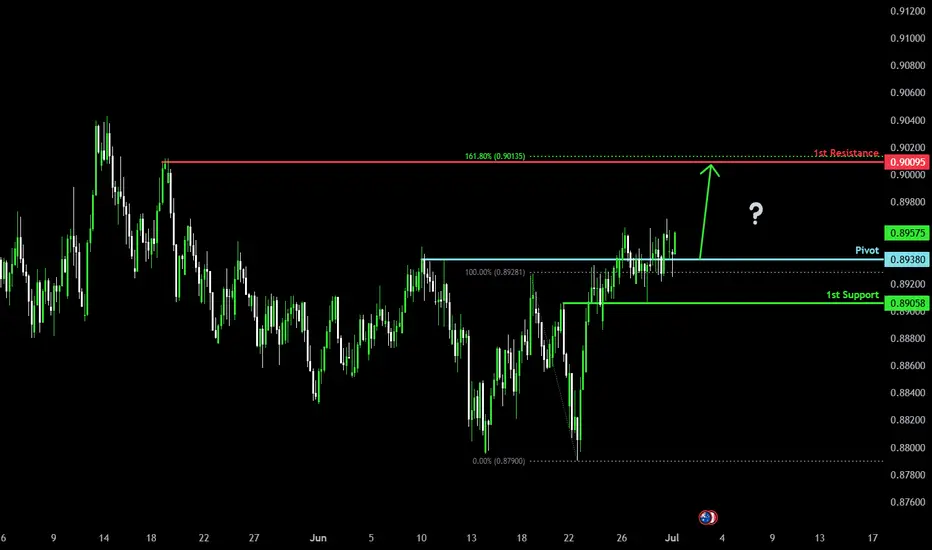
Bullish momentum to extend?AUD/CAD has bounced off the pivot and could potentially rise to the 1st resistance which lines up with the 161.8% Fibonacci extension.
Pivot: 0.8938
1st Support: 0.8905
1st Resistance: 0.9009
Risk Warning:
Trading Forex and CFDs carries a high level of risk to your capital and you should only trade with money you can afford to lose. Trading Forex and CFDs may not be suitable for all investors, so please ensure that you fully understand the risks involved and seek independent advice if necessary.
Disclaimer:
The above opinions given constitute general market commentary, and do not constitute the opinion or advice of IC Markets or any form of personal or investment advice.
Any opinions, news, research, analyses, prices, other information, or links to third-party sites contained on this website are provided on an "as-is" basis, are intended only to be informative, is not an advice nor a recommendation, nor research, or a record of our trading prices, or an offer of, or solicitation for a transaction in any financial instrument and thus should not be treated as such. The information provided does not involve any specific investment objectives, financial situation and needs of any specific person who may receive it. Please be aware, that past performance is not a reliable indicator of future performance and/or results. Past Performance or Forward-looking scenarios based upon the reasonable beliefs of the third-party provider are not a guarantee of future performance. Actual results may differ materially from those anticipated in forward-looking or past performance statements. IC Markets makes no representation or warranty and assumes no liability as to the accuracy or completeness of the information provided, nor any loss arising from any investment based on a recommendation, forecast or any information supplied by any third-party.
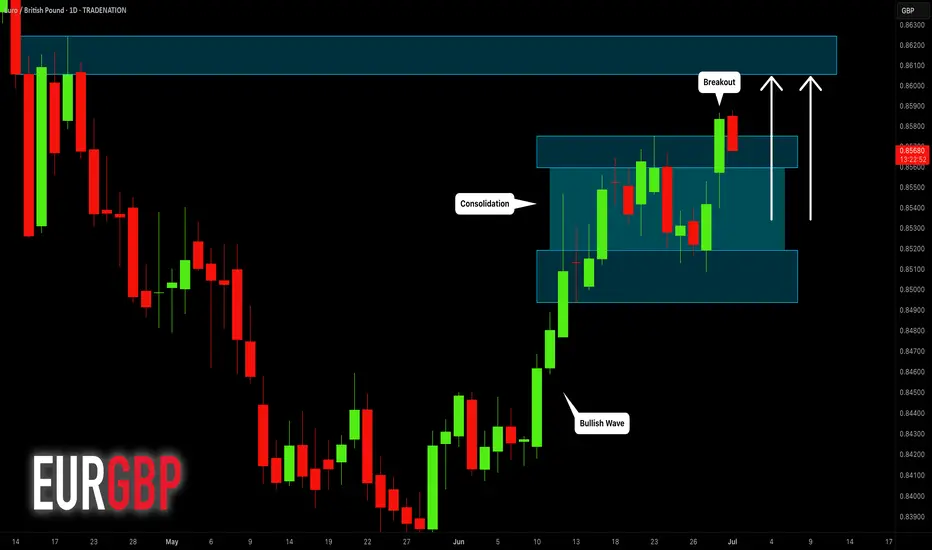
EURGBP: Strong Bullish Confirmation 🇪🇺🇬🇧
EURGBP is going to continue rising in an uptrend
that the pair established at the end of May.
A completion of a consolidation and a formation of a new local Higher High
indicate a highly probable bullish continuation soon.
Next resistance - 0.8605
❤️Please, support my work with like, thank you!❤️
I am part of Trade Nation's Influencer program and receive a monthly fee for using their TradingView charts in my analysis.
#USOIIL #WTI 1H📈 #USOIL 1H Buy Setup – Liquidity Sweep in Play
Crude Oil is consolidating after a sharp decline, forming a potential setup for a liquidity sweep below the current range, followed by a bullish reversal. We're anticipating a fakeout move to grab sell-side liquidity before price targets the Fair Value Gap (FVG) and premium supply zone above.
🟩 Buy Limit: 64.50 / 64.00
🎯 Targets: 70.00 → 72.00+
❌ Stop Loss: 63.00
This setup offers high risk-to-reward potential if the liquidity sweep plays out as expected. Monitor price action closely at the buy zone.
#CrudeOil #WTI #SmartMoney #TradingStrategy

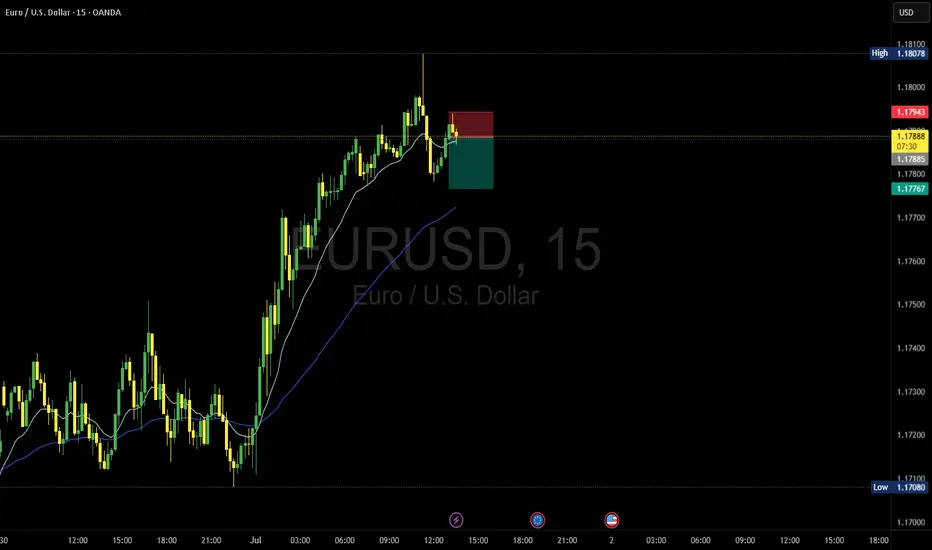
Another RR2 Position On EURUSDThesis: EUR/USD is showing signs of exhaustion near the 1.1800 psychological resistance, with price rejecting the upper band of a recent range.
Entry: 🔻 Sell at 1.17883 (current price action confirms rejection)
Stop-Loss: 🔺 1.17943 – Above recent swing high and psychological resistance
Take-Profit: ✅ 1.17767 – Targeting the lower bound of the recent range and prior support
Risk-Reward Ratio: ~1:2 – High conviction setup with tight risk and extended downside potential
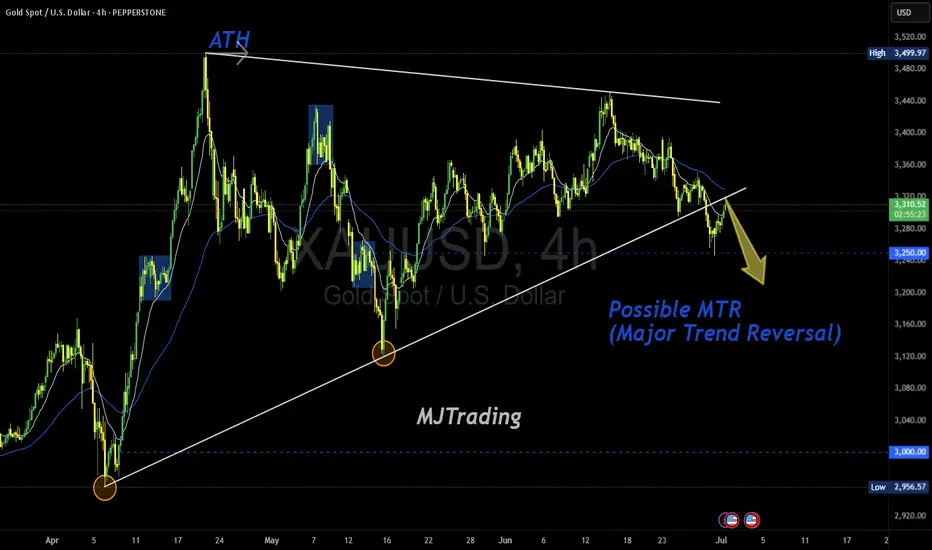
Possible MTR in Play (TBC)Gold has printed a textbook structure for a potential Major Trend Reversal (MTR) off the ATH zone, with a clean rejection and a shift in character. The descending trendline from the top aligns with lower highs, while the ascending base from April is now under pressure.
📌 Key Levels to Watch:
3,280.0 – neckline of the potential MTR
3,250.00 – psychological magnet and structural support
3,000.00 – major downside target if the reversal confirms
🧠 “Markets top on euphoria, not logic.” If price breaks and retests the neckline with momentum, the MTR thesis gains traction. Until then — TBC.
#XAUUSD #Gold #MajorTrendReversal #MTR #PriceAction #TechnicalAnalysis #GoldBears #ATHRejection #TrendShift #MJTrading
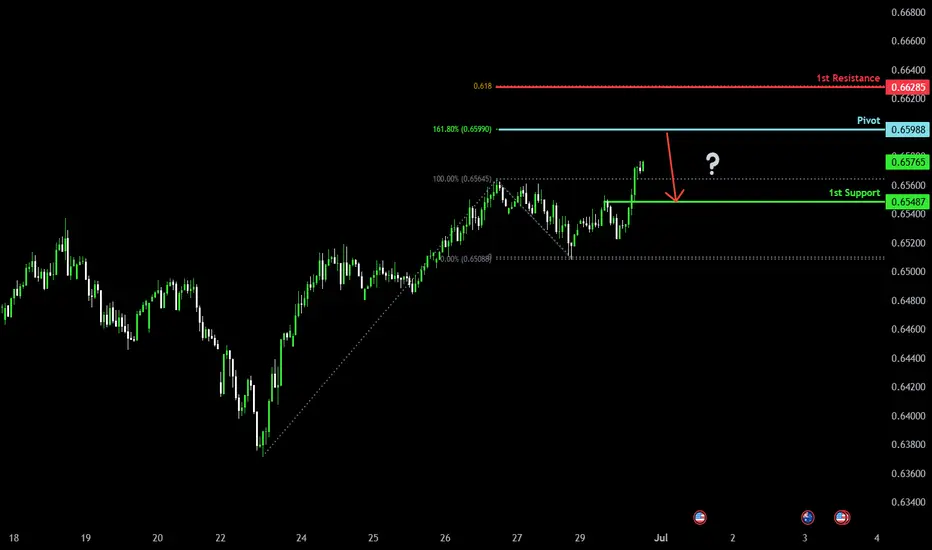
Could the Aussie reverse from here?The price is rising towards the pivot and could drop to the 1st support.
Pivot: 0.6598
1st Support: 0.6548
1st Resistance: 0.6628
Risk Warning:
Trading Forex and CFDs carries a high level of risk to your capital and you should only trade with money you can afford to lose. Trading Forex and CFDs may not be suitable for all investors, so please ensure that you fully understand the risks involved and seek independent advice if necessary.
Disclaimer:
The above opinions given constitute general market commentary, and do not constitute the opinion or advice of IC Markets or any form of personal or investment advice.
Any opinions, news, research, analyses, prices, other information, or links to third-party sites contained on this website are provided on an "as-is" basis, are intended only to be informative, is not an advice nor a recommendation, nor research, or a record of our trading prices, or an offer of, or solicitation for a transaction in any financial instrument and thus should not be treated as such. The information provided does not involve any specific investment objectives, financial situation and needs of any specific person who may receive it. Please be aware, that past performance is not a reliable indicator of future performance and/or results. Past Performance or Forward-looking scenarios based upon the reasonable beliefs of the third-party provider are not a guarantee of future performance. Actual results may differ materially from those anticipated in forward-looking or past performance statements. IC Markets makes no representation or warranty and assumes no liability as to the accuracy or completeness of the information provided, nor any loss arising from any investment based on a recommendation, forecast or any information supplied by any third-party.
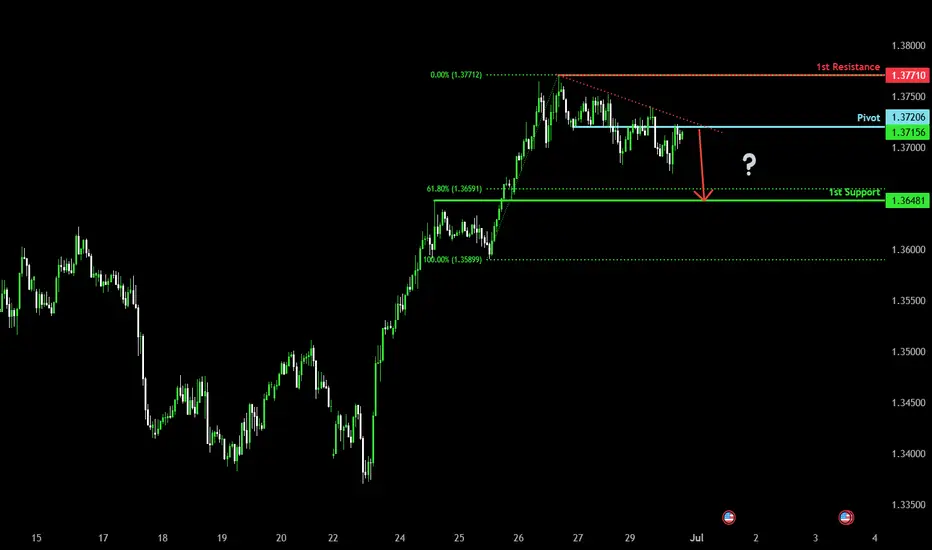
Bearish drop?The Cable (GBP/USD) is reacting off the pivot and could drop to the 1st support.
Pivot: 1.3720
1st Support: 1.3648
1st Resistance: 1.3771
Risk Warning:
Trading Forex and CFDs carries a high level of risk to your capital and you should only trade with money you can afford to lose. Trading Forex and CFDs may not be suitable for all investors, so please ensure that you fully understand the risks involved and seek independent advice if necessary.
Disclaimer:
The above opinions given constitute general market commentary, and do not constitute the opinion or advice of IC Markets or any form of personal or investment advice.
Any opinions, news, research, analyses, prices, other information, or links to third-party sites contained on this website are provided on an "as-is" basis, are intended only to be informative, is not an advice nor a recommendation, nor research, or a record of our trading prices, or an offer of, or solicitation for a transaction in any financial instrument and thus should not be treated as such. The information provided does not involve any specific investment objectives, financial situation and needs of any specific person who may receive it. Please be aware, that past performance is not a reliable indicator of future performance and/or results. Past Performance or Forward-looking scenarios based upon the reasonable beliefs of the third-party provider are not a guarantee of future performance. Actual results may differ materially from those anticipated in forward-looking or past performance statements. IC Markets makes no representation or warranty and assumes no liability as to the accuracy or completeness of the information provided, nor any loss arising from any investment based on a recommendation, forecast or any information supplied by any third-party.
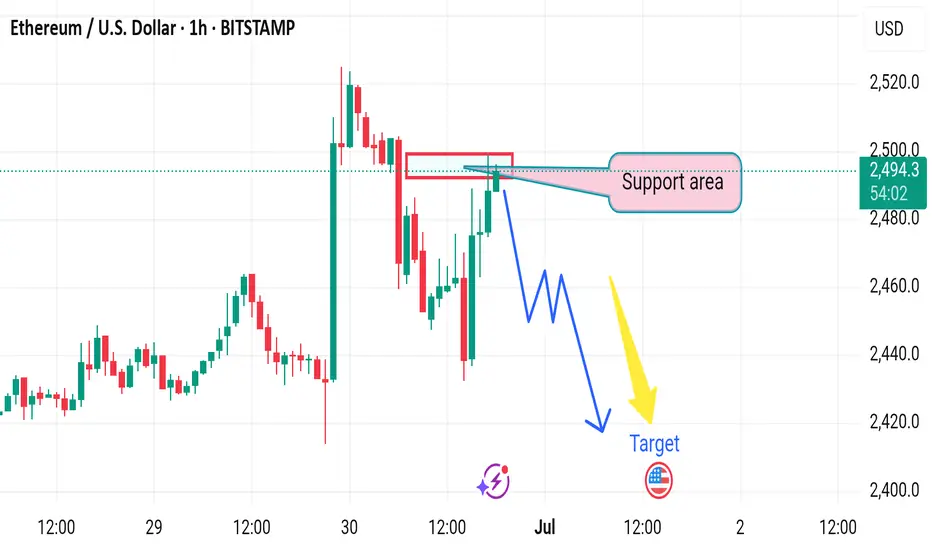
Market next target 🔀 Disruption Analysis – Bullish Alternative Scenario
The current chart suggests a bearish outlook from the resistance zone (~$2,495–$2,500), targeting a drop below $2,425. However, here’s how a bullish disruption could break this bearish narrative:
---
🟢 Bullish Disruption Possibility:
1. Support Reclaim & Strong Buyer Reaction:
If price reclaims and holds above the marked “support area” (~$2,495), it could signal strength and trap early sellers.
A strong bullish candle closing above $2,505 could invalidate the bearish scenario.
2. Higher Low Formation:
If ETH prints a higher low above $2,470, it would suggest buyers are stepping in early, reinforcing bullish momentum.
3. Target Shift – Bullish Continuation:
A confirmed breakout above $2,505 may open the path to $2,540–$2,560 as the new short-term target zone.
4. Momentum Catalyst:
A positive U.S. macroeconomic event or crypto-specific bullish news (e.g., ETF, institutional inflows) could fuel upside disruption.
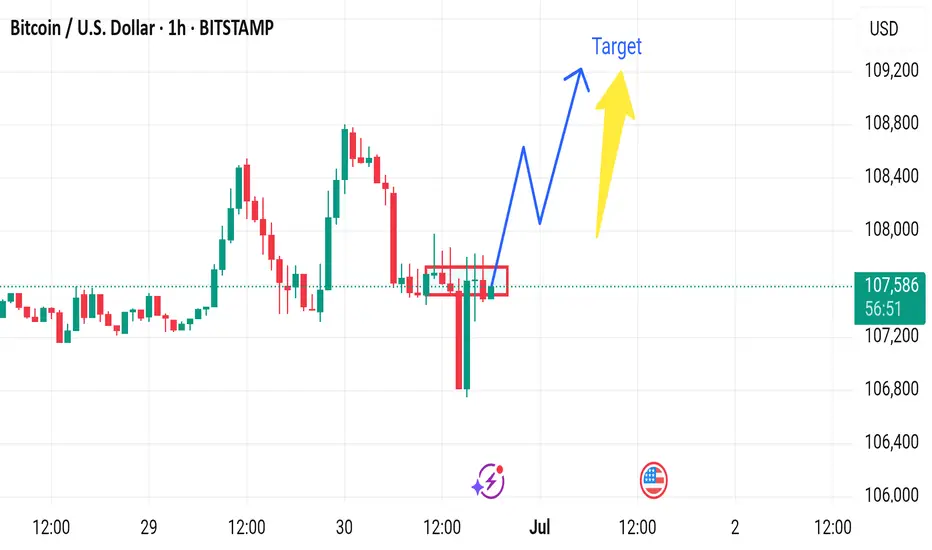
Market next target 🔀 Disruption Analysis – Bearish Alternative Scenario
The current chart suggests a bullish continuation from the consolidation zone around $107,300–$107,500, with a projected move toward $108,500+. However, the following bearish disruption could invalidate that path:
---
🔻 Bearish Disruption Possibility:
1. False Breakout Trap:
If price briefly spikes above the consolidation zone and quickly reverses, it could trap breakout buyers.
A failed bullish move around $107,800–$108,000 would be the first bearish signal.
2. Weak Volume Confirmation:
Lack of volume during the breakout would signal lack of institutional interest, increasing downside risk.
3. Break Below Support Zone:
If BTC breaks below $107,000, it would signal a loss of momentum and invalidate the bullish scenario.
This breakdown may lead to a quick move toward $106,000 or even $105,800, the recent swing low.
4. Macro Influence:
Any negative U.S. economic data or regulatory news could spark bearish sentiment and accelerate the drop.
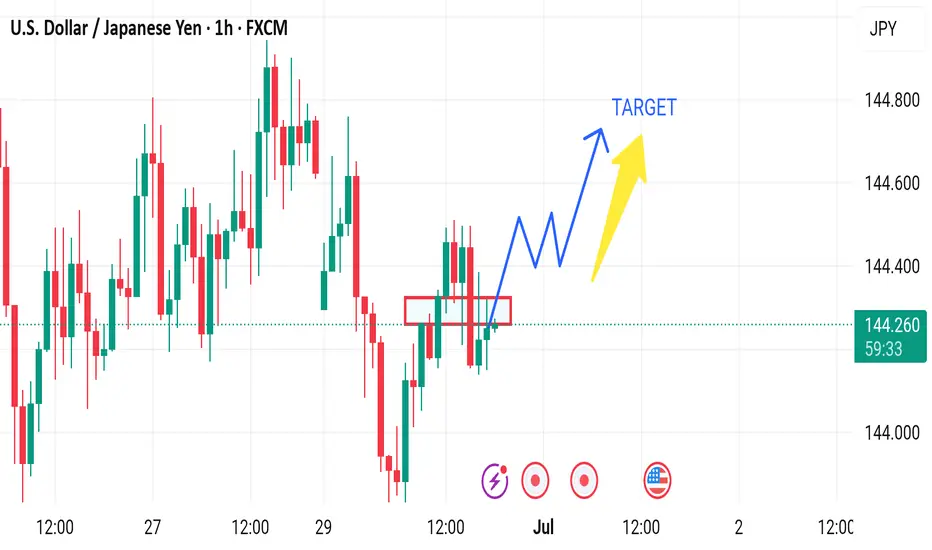
Market next move 🔀 Disruption Analysis – Bearish Alternative Scenario
While the current setup points to a bullish continuation above the support zone (around 144.10–144.20) with a projected target near 144.60, here’s how a bearish disruption could unfold instead:
---
🔻 Bearish Disruption Possibility:
1. Failed Breakout / Bull Trap:
Price may fake a move upward to trap breakout buyers near 144.40–144.50, then sharply reverse.
This would indicate a false breakout and potential reversal setup.
2. Rejection at Resistance:
Repeated failure to close above 144.40 may signal exhaustion.
Bearish divergence could form on momentum indicators (like RSI) as price rises.
3. Break Below Support Area:
A decisive break below the red support zone (around 144.10) may shift momentum bearish.
That would confirm a lower high and suggest downside continuation.
4. Next Bearish Target:
Initial support lies at 143.85, with further potential drop toward 143.60.
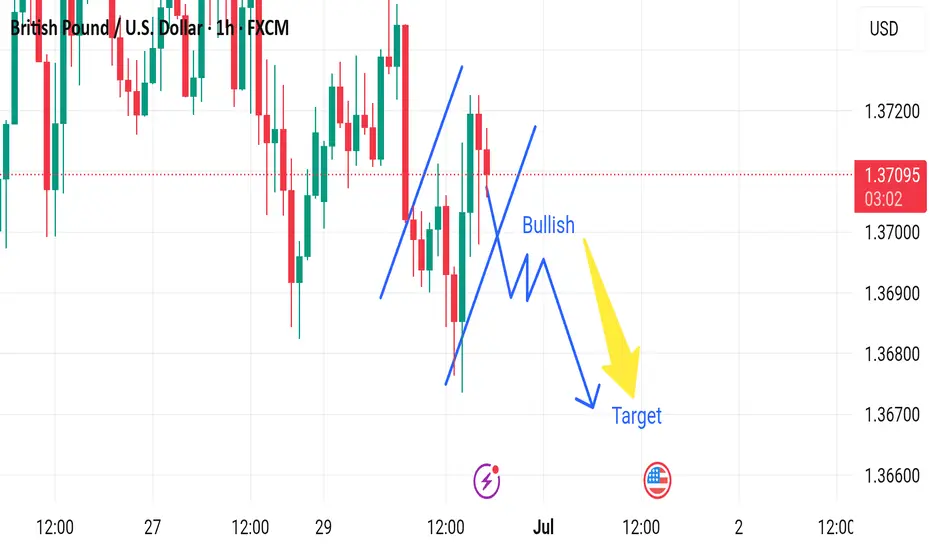
Market next target 🔀 Disruption Analysis – Bullish Alternative Scenario
While the current chart outlines a bearish scenario after a short-term bullish correction, leading to a drop toward the target near 1.36600, here’s how a bullish disruption could unfold instead:
---
🟢 Bullish Disruption Possibility:
1. False Breakdown / Bear Trap:
The market may dip slightly below recent lows to trigger sell stops and liquidity grab, then reverse upward.
If price finds strong buying interest around 1.3690–1.3700, it could spark a bullish reversal.
2. Strong Rejection Candles:
Watch for bullish engulfing or pin bar formations on lower timeframes (15m or 30m) near the dip area.
These would signal loss of bearish momentum.
3. Break of Lower High Structure:
A break above 1.3720 would shift short-term market structure to bullish.
It could lead to a move toward 1.3750–1.3780.
4. Macro Fundamentals:
Hawkish BOE comments or weak U.S. data could reverse USD strength, lifting GBP/USD.
Market next move Disruption Analysis – Bullish Alternative Scenario
While the current chart suggests a bearish setup from a resistance zone (around 1.1765) toward a target near 1.1630, here's a potential bullish disruption that could invalidate the bearish thesis:
---
🟢 Bullish Disruption Possibility:
1. False Breakdown / Liquidity Grab:
Price may fake a dip below the red resistance-turned-support zone to trigger stop-losses before reversing.
This is known as a liquidity sweep or bear trap.
2. Higher Low Formation:
If the pair pulls back slightly but forms a higher low above 1.1700, it may signal bullish continuation.
3. Breakout Confirmation:
A strong bullish candle above 1.1775 could confirm continuation toward 1.1830–1.1850.
4. Fundamental Catalyst:
Positive EU economic news or dovish signals from the U.S. Fed could support Euro strength.

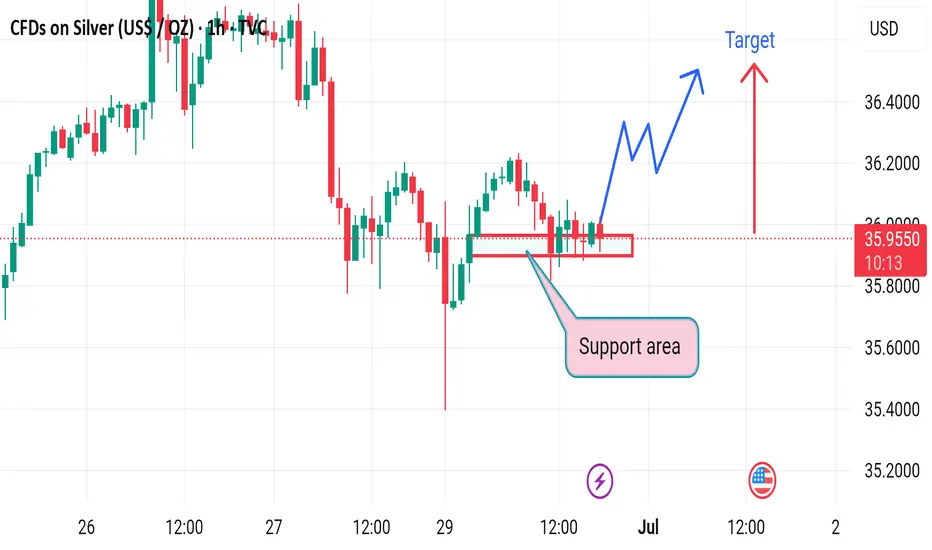
Market next target 🔀 Disruption Analysis - Alternative Scenario
While the current chart suggests a bullish breakout from the support area around $35.85–$35.90 with an upward target above $36.20, a potential bearish disruption scenario could unfold under the following conditions:
⚠️ Bearish Disruption Possibility:
1. Weakening Buying Pressure:
Price has tested the support zone multiple times, showing signs of weakening bullish momentum.
Buyers may be exhausting near the $36.00 area without strong follow-through.
2. Break Below Support:
If price breaks and closes below $35.85 support zone on high volume, it could invalidate the bullish setup.
This would create a lower low, indicating a potential trend reversal to the downside.
3. Next Downside Targets:
Immediate support lies around $35.60.
Further downside could take price to $35.40 if bearish momentum strengthens.
4. Bearish Triggers:
Negative economic data (especially U.S.-related as indicated by the calendar icon).
Rising DXY or bond yields may pressure silver prices
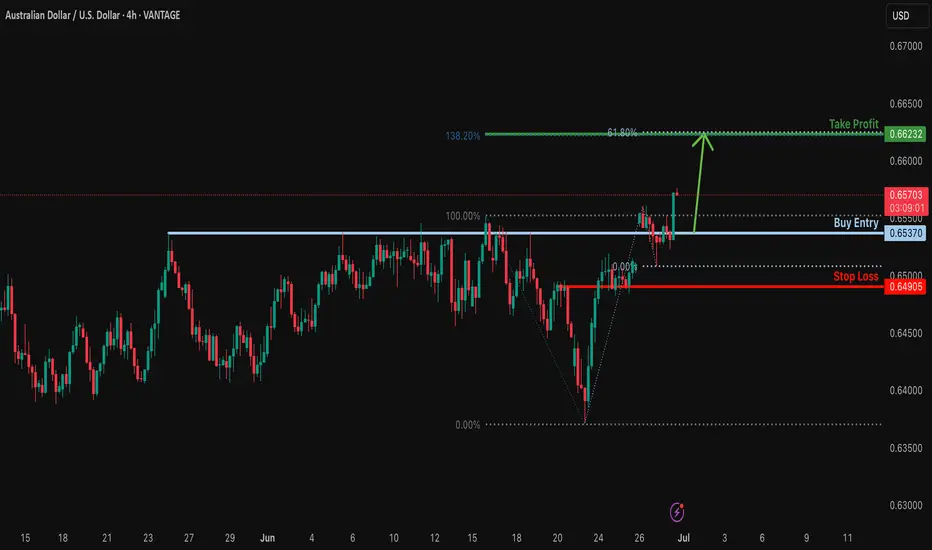
Bullish continuation for the Aussie?The price has bounced off the support level which is a pullback support and could potentially rise from this level to our take profit.
Entry: 0.5537
Why we like it:
There is a pullback support level.
Stop loss: 0.6490
Why we like it:
There is an overlap support level.
Take profit: 0.6623
Why we like it:
There is a resistance level at the 138.2% Fibonacci extension and the 61.8% Fibonacci projection.
Enjoying your TradingView experience? Review us!
Please be advised that the information presented on TradingView is provided to Vantage (‘Vantage Global Limited’, ‘we’) by a third-party provider (‘Everest Fortune Group’). Please be reminded that you are solely responsible for the trading decisions on your account. There is a very high degree of risk involved in trading. Any information and/or content is intended entirely for research, educational and informational purposes only and does not constitute investment or consultation advice or investment strategy. The information is not tailored to the investment needs of any specific person and therefore does not involve a consideration of any of the investment objectives, financial situation or needs of any viewer that may receive it. Kindly also note that past performance is not a reliable indicator of future results. Actual results may differ materially from those anticipated in forward-looking or past performance statements. We assume no liability as to the accuracy or completeness of any of the information and/or content provided herein and the Company cannot be held responsible for any omission, mistake nor for any loss or damage including without limitation to any loss of profit which may arise from reliance on any information supplied by Everest Fortune Group.
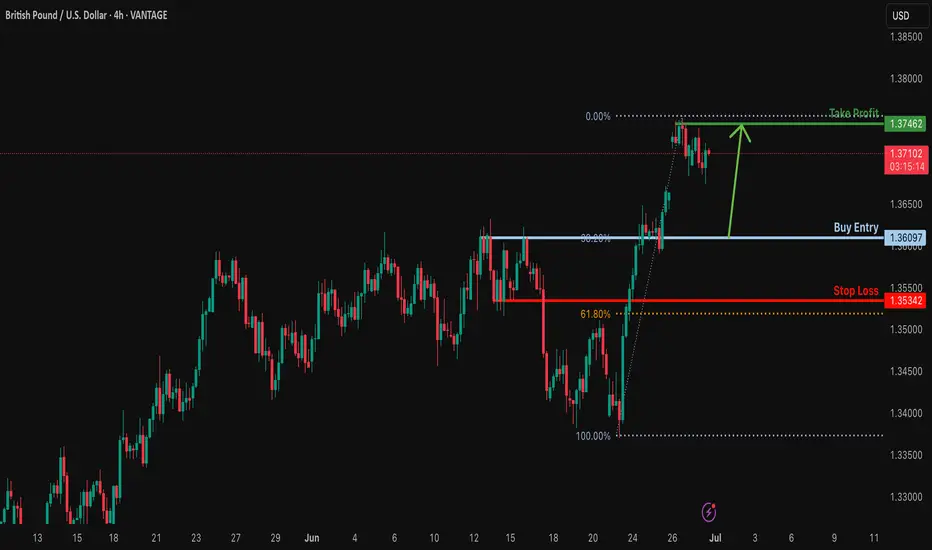
Falling towards pullback support?GBP?USD is falling towards the support level which is a pullback support that lines up with the 38.2% Fibonacci retracement and could drop from this level to our take profit.
Entry: 1.3609
Why we like it:
There is a pullback support level that lines up with the 38.2% Fibonacci retracement.
Stop loss: 1.3534
Why we like it:
There is a pullback support.
Take profit: 1.3746
Why we like it:
There is a pullback resistance.
Enjoying your TradingView experience? Review us!
Please be advised that the information presented on TradingView is provided to Vantage (‘Vantage Global Limited’, ‘we’) by a third-party provider (‘Everest Fortune Group’). Please be reminded that you are solely responsible for the trading decisions on your account. There is a very high degree of risk involved in trading. Any information and/or content is intended entirely for research, educational and informational purposes only and does not constitute investment or consultation advice or investment strategy. The information is not tailored to the investment needs of any specific person and therefore does not involve a consideration of any of the investment objectives, financial situation or needs of any viewer that may receive it. Kindly also note that past performance is not a reliable indicator of future results. Actual results may differ materially from those anticipated in forward-looking or past performance statements. We assume no liability as to the accuracy or completeness of any of the information and/or content provided herein and the Company cannot be held responsible for any omission, mistake nor for any loss or damage including without limitation to any loss of profit which may arise from reliance on any information supplied by Everest Fortune Group.
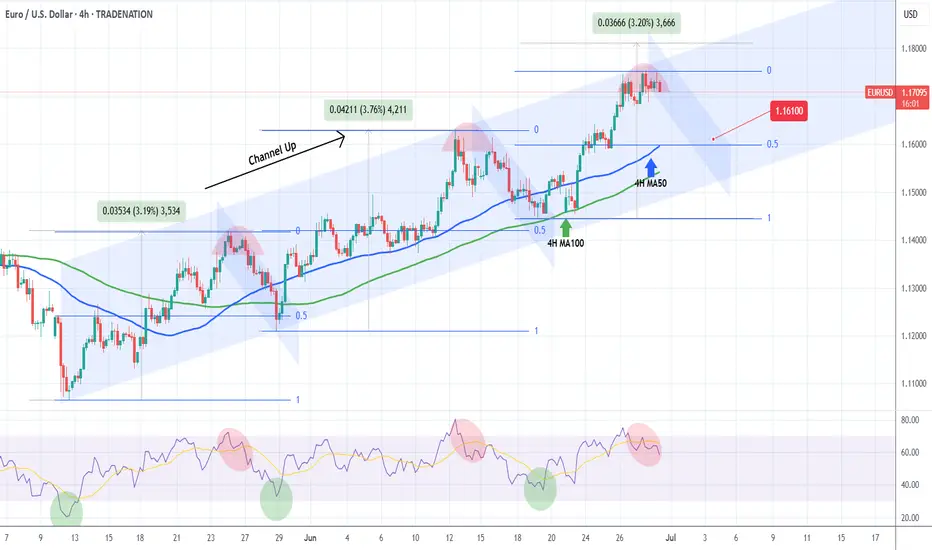
EURUSD Sell signal at the top of the Channel Up.Last time we analyzed the EURUSD pair (June 23, see chart below) we gave a strong buy signals at the bottom of the 1.5-month Channel Up:
The price is almost near our Target but since it's been consolidating for so many 4H candles on the pattern's top, it is better to take the good profit and turn bearish.
The 0.5 Fibonacci retracement level has been a solid target for the previous two Bearish Legs, but since the last one bottomed just above it on the 4H MA100 (green trend-line), we will place the Target a little higher this time also at 1.16100.
-------------------------------------------------------------------------------
** Please LIKE 👍, FOLLOW ✅, SHARE 🙌 and COMMENT ✍ if you enjoy this idea! Also share your ideas and charts in the comments section below! This is best way to keep it relevant, support us, keep the content here free and allow the idea to reach as many people as possible. **
-------------------------------------------------------------------------------
Disclosure: I am part of Trade Nation's Influencer program and receive a monthly fee for using their TradingView charts in my analysis.
💸💸💸💸💸💸
👇 👇 👇 👇 👇 👇