MarketBreakdown | EURUSD, GBPUSD, USDJPY, USDCHF
Here are the updates & outlook for multiple instruments in my watch list.
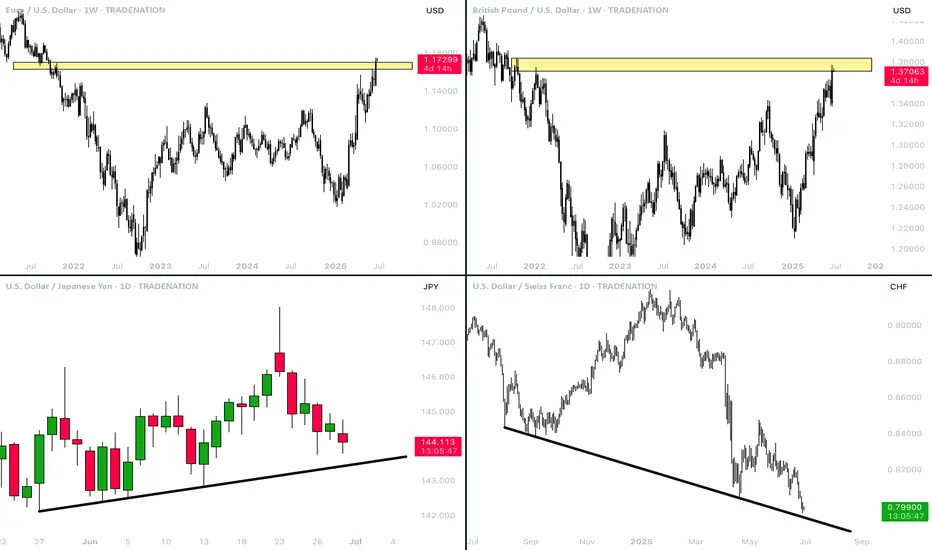
1️⃣ #EURUSD weekly time frame 🇪🇺🇺🇸
The pair is unstoppable.
The market violated a significant weekly resistance cluster last week.
It opens more growth potential after a pullback.
2️⃣ #GBPUSD weekly time frame 🇬🇧🇺🇸
In comparison to EURUSD, GBPUSD is now approaching a major
resistance area. I think that we can expect a retracement from that.
3️⃣ #USDJPY daily time frame 🇺🇸🇯🇵
The market continues a correctional movement lower.
The closest strong support that I see is based on a rising trend line.
I think that buying interest may spark again after its text.
4️⃣ #USDCHF daily time frame 🇺🇸🇨🇭
The price updated a historic low on Friday.
The next strong support that I see is based on a falling trend line.
We can expect a pullback from that.
Do you agree with my market breakdown?
❤️Please, support my work with like, thank you!❤️
I am part of Trade Nation's Influencer program and receive a monthly fee for using their TradingView charts in my analysis.
Forexsignals
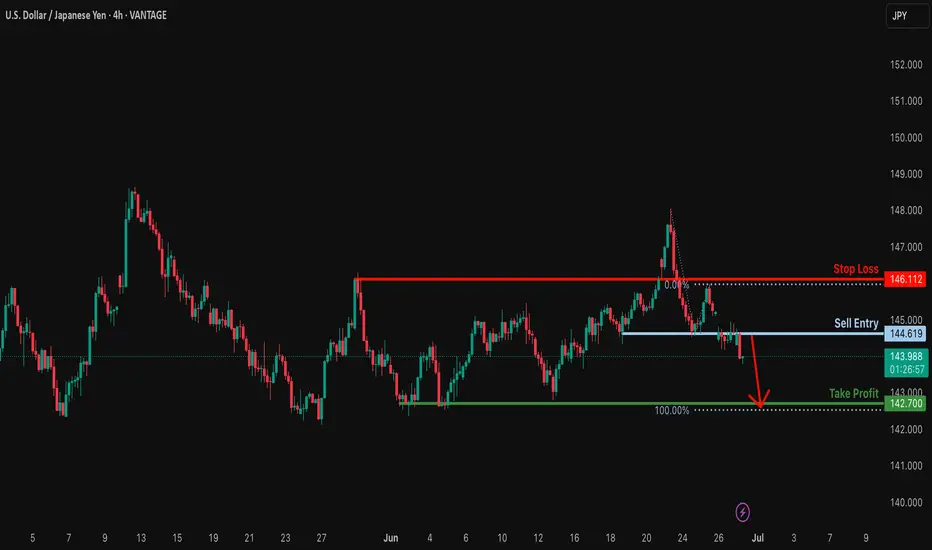
Potential bearish drop?USD/JPY has rejected off the resistance level which is a pullback resistance and could drop from this level to our take profit.
Entry: 144.61
Why we like it:
There is a pullback resistance level.
Stop loss: 146.11
Why we like it:
There is a pullback resistance level.
Take profit: 142.70
Why we like it:
There is a pullback support level that lines up with the 100% Fibonacci projection.
Enjoying your TradingView experience? Review us!
Please be advised that the information presented on TradingView is provided to Vantage (‘Vantage Global Limited’, ‘we’) by a third-party provider (‘Everest Fortune Group’). Please be reminded that you are solely responsible for the trading decisions on your account. There is a very high degree of risk involved in trading. Any information and/or content is intended entirely for research, educational and informational purposes only and does not constitute investment or consultation advice or investment strategy. The information is not tailored to the investment needs of any specific person and therefore does not involve a consideration of any of the investment objectives, financial situation or needs of any viewer that may receive it. Kindly also note that past performance is not a reliable indicator of future results. Actual results may differ materially from those anticipated in forward-looking or past performance statements. We assume no liability as to the accuracy or completeness of any of the information and/or content provided herein and the Company cannot be held responsible for any omission, mistake nor for any loss or damage including without limitation to any loss of profit which may arise from reliance on any information supplied by Everest Fortune Group.
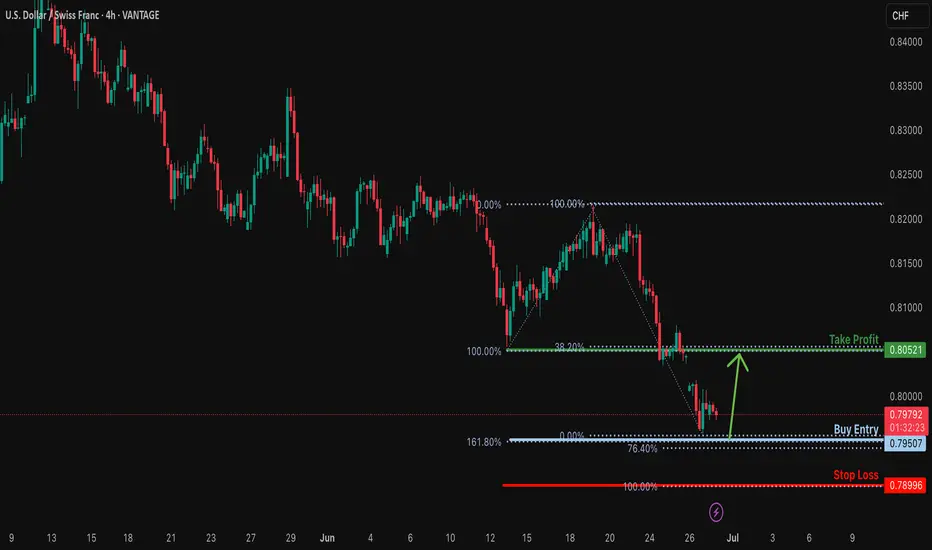
Bullish reversal?USD/CHF is falling towards the support level which aligns with the 161.8% Fibonacci extension and the 78.4% Fibonacci projection and could bounce from this level to our take profit.
Entry: 0.7950
Why we like it:
There is a support level at the 161.8% Fibonacci extension and the 78.4% Fibonacci projection.
Stop loss: 0.7899
Why we like it:
There is a support level at the 100% Fibonacci projection.
Take profit: 0.8052
Why we like it:
Thee is a pullback resistance that lines up with the 38.2% Fibonacci retracement.
Enjoying your TradingView experience? Review us!
Please be advised that the information presented on TradingView is provided to Vantage (‘Vantage Global Limited’, ‘we’) by a third-party provider (‘Everest Fortune Group’). Please be reminded that you are solely responsible for the trading decisions on your account. There is a very high degree of risk involved in trading. Any information and/or content is intended entirely for research, educational and informational purposes only and does not constitute investment or consultation advice or investment strategy. The information is not tailored to the investment needs of any specific person and therefore does not involve a consideration of any of the investment objectives, financial situation or needs of any viewer that may receive it. Kindly also note that past performance is not a reliable indicator of future results. Actual results may differ materially from those anticipated in forward-looking or past performance statements. We assume no liability as to the accuracy or completeness of any of the information and/or content provided herein and the Company cannot be held responsible for any omission, mistake nor for any loss or damage including without limitation to any loss of profit which may arise from reliance on any information supplied by Everest Fortune Group.
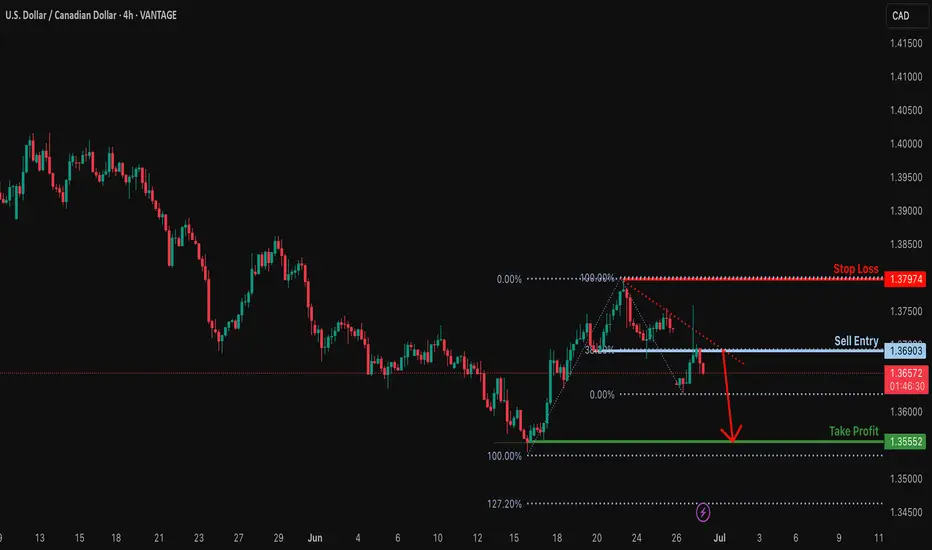
Bearish drop?USD/CAD is reacting off the resistance level which is pullback resistance that aligns with the 38.2% Fibonacci retracement and could drop from this level to our take profit.
Entry: 1.3690
Why we like it:
There is a pullback resistance that aligns with the 38.2% Fibonacci retracement.
Stop loss: 1.3797
Why we like it:
There is a pullback resistance.
Take profit: 1.3555
Why we like it:
There is a pullback support level.
Enjoying your TradingView experience? Review us!
Please be advised that the information presented on TradingView is provided to Vantage (‘Vantage Global Limited’, ‘we’) by a third-party provider (‘Everest Fortune Group’). Please be reminded that you are solely responsible for the trading decisions on your account. There is a very high degree of risk involved in trading. Any information and/or content is intended entirely for research, educational and informational purposes only and does not constitute investment or consultation advice or investment strategy. The information is not tailored to the investment needs of any specific person and therefore does not involve a consideration of any of the investment objectives, financial situation or needs of any viewer that may receive it. Kindly also note that past performance is not a reliable indicator of future results. Actual results may differ materially from those anticipated in forward-looking or past performance statements. We assume no liability as to the accuracy or completeness of any of the information and/or content provided herein and the Company cannot be held responsible for any omission, mistake nor for any loss or damage including without limitation to any loss of profit which may arise from reliance on any information supplied by Everest Fortune Group.
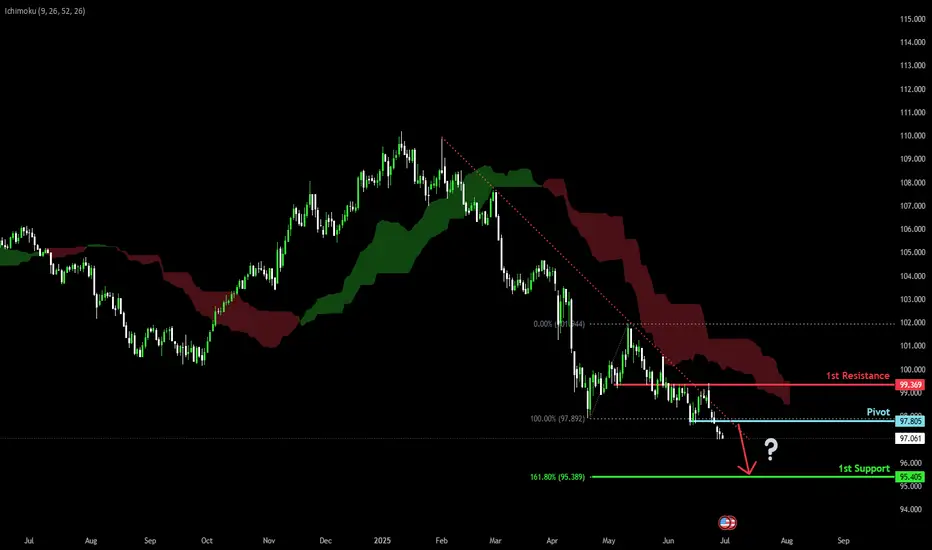
Bearish drop?US Dollar Index (DXY) has reacted off the pivot, which has been identified as a pullback resistance and could drop to the 1st support.
Pivot: 97.80
1st Support: 95.40
1st Resistance: 99.36
Risk Warning:
Trading Forex and CFDs carries a high level of risk to your capital and you should only trade with money you can afford to lose. Trading Forex and CFDs may not be suitable for all investors, so please ensure that you fully understand the risks involved and seek independent advice if necessary.
Disclaimer:
The above opinions given constitute general market commentary, and do not constitute the opinion or advice of IC Markets or any form of personal or investment advice.
Any opinions, news, research, analyses, prices, other information, or links to third-party sites contained on this website are provided on an "as-is" basis, are intended only to be informative, is not an advice nor a recommendation, nor research, or a record of our trading prices, or an offer of, or solicitation for a transaction in any financial instrument and thus should not be treated as such. The information provided does not involve any specific investment objectives, financial situation and needs of any specific person who may receive it. Please be aware, that past performance is not a reliable indicator of future performance and/or results. Past Performance or Forward-looking scenarios based upon the reasonable beliefs of the third-party provider are not a guarantee of future performance. Actual results may differ materially from those anticipated in forward-looking or past performance statements. IC Markets makes no representation or warranty and assumes no liability as to the accuracy or completeness of the information provided, nor any loss arising from any investment based on a recommendation, forecast or any information supplied by any third-party.
Bullish continuation?The Cable (GBP/USD) is falling towards the pivot, which acts as a pullback support and could bounce to the 1st resistance.
Pivot: 1.3617
1st Support: 1.3442
1st Resistance: 1.3795
Risk Warning:
Trading Forex and CFDs carries a high level of risk to your capital and you should only trade with money you can afford to lose. Trading Forex and CFDs may not be suitable for all investors, so please ensure that you fully understand the risks involved and seek independent advice if necessary.
Disclaimer:
The above opinions given constitute general market commentary, and do not constitute the opinion or advice of IC Markets or any form of personal or investment advice.
Any opinions, news, research, analyses, prices, other information, or links to third-party sites contained on this website are provided on an "as-is" basis, are intended only to be informative, is not an advice nor a recommendation, nor research, or a record of our trading prices, or an offer of, or solicitation for a transaction in any financial instrument and thus should not be treated as such. The information provided does not involve any specific investment objectives, financial situation and needs of any specific person who may receive it. Please be aware, that past performance is not a reliable indicator of future performance and/or results. Past Performance or Forward-looking scenarios based upon the reasonable beliefs of the third-party provider are not a guarantee of future performance. Actual results may differ materially from those anticipated in forward-looking or past performance statements. IC Markets makes no representation or warranty and assumes no liability as to the accuracy or completeness of the information provided, nor any loss arising from any investment based on a recommendation, forecast or any information supplied by any third-party.

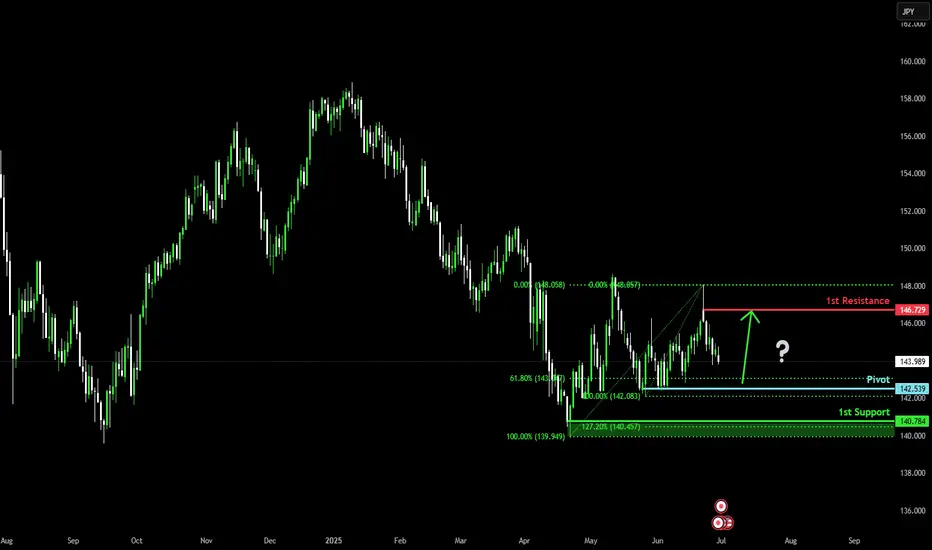
Bullish bounce off pullback support?USD/JPY is falling towards the pivot and could bounce to the 1st resistance, which is a pullback resistance.
Pivot: 142.53
1st Support: 140.78
1st Resistance: 146.72
Risk Warning:
Trading Forex and CFDs carries a high level of risk to your capital and you should only trade with money you can afford to lose. Trading Forex and CFDs may not be suitable for all investors, so please ensure that you fully understand the risks involved and seek independent advice if necessary.
Disclaimer:
The above opinions given constitute general market commentary, and do not constitute the opinion or advice of IC Markets or any form of personal or investment advice.
Any opinions, news, research, analyses, prices, other information, or links to third-party sites contained on this website are provided on an "as-is" basis, are intended only to be informative, is not an advice nor a recommendation, nor research, or a record of our trading prices, or an offer of, or solicitation for a transaction in any financial instrument and thus should not be treated as such. The information provided does not involve any specific investment objectives, financial situation and needs of any specific person who may receive it. Please be aware, that past performance is not a reliable indicator of future performance and/or results. Past Performance or Forward-looking scenarios based upon the reasonable beliefs of the third-party provider are not a guarantee of future performance. Actual results may differ materially from those anticipated in forward-looking or past performance statements. IC Markets makes no representation or warranty and assumes no liability as to the accuracy or completeness of the information provided, nor any loss arising from any investment based on a recommendation, forecast or any information supplied by any third-party.
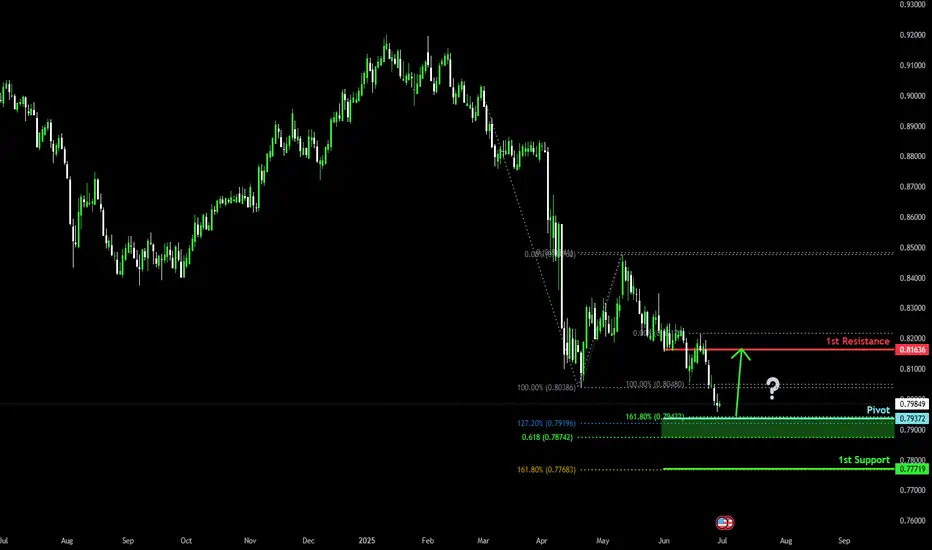
Bullish reversal for the Swissie?The price is falling towards the pivot, which aligns with the Fibonacci confluence and could reverse to the 1st resistance, which is an overlap resistance.
Pivot: 0.7942
1st Support: 0.7771
1st Resistance: 0.8163
Risk Warning:
Trading Forex and CFDs carries a high level of risk to your capital and you should only trade with money you can afford to lose. Trading Forex and CFDs may not be suitable for all investors, so please ensure that you fully understand the risks involved and seek independent advice if necessary.
Disclaimer:
The above opinions given constitute general market commentary, and do not constitute the opinion or advice of IC Markets or any form of personal or investment advice.
Any opinions, news, research, analyses, prices, other information, or links to third-party sites contained on this website are provided on an "as-is" basis, are intended only to be informative, is not an advice nor a recommendation, nor research, or a record of our trading prices, or an offer of, or solicitation for a transaction in any financial instrument and thus should not be treated as such. The information provided does not involve any specific investment objectives, financial situation and needs of any specific person who may receive it. Please be aware, that past performance is not a reliable indicator of future performance and/or results. Past Performance or Forward-looking scenarios based upon the reasonable beliefs of the third-party provider are not a guarantee of future performance. Actual results may differ materially from those anticipated in forward-looking or past performance statements. IC Markets makes no representation or warranty and assumes no liability as to the accuracy or completeness of the information provided, nor any loss arising from any investment based on a recommendation, forecast or any information supplied by any third-party.
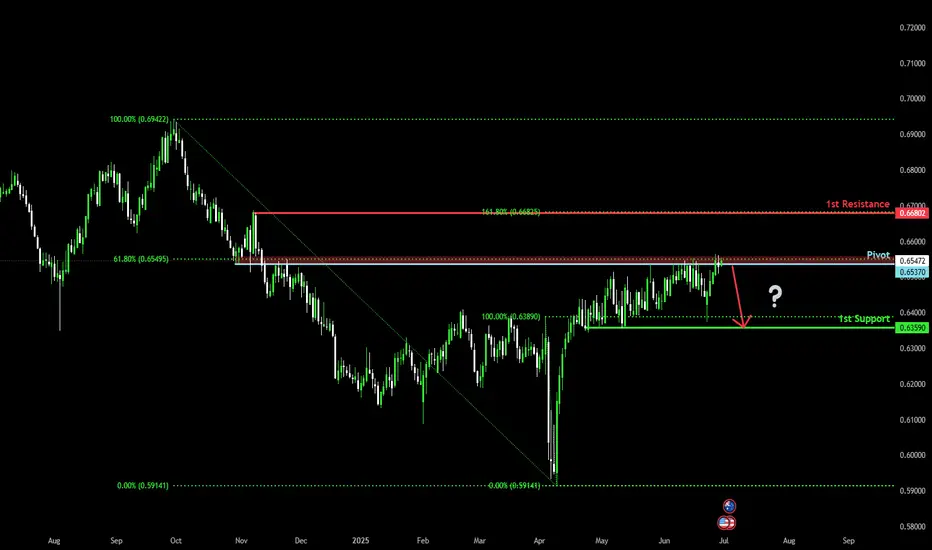
Could the price reverse from here?AUD/USD is reacting off the pivot, which is a pullback resistance that aligns with the 61.8% Fibonacci retracement and could drop the 1st support.
Pivot: 0.6537
1st Support: 0.6359
1st Resistance: 0.6680
Risk Warning:
Trading Forex and CFDs carries a high level of risk to your capital and you should only trade with money you can afford to lose. Trading Forex and CFDs may not be suitable for all investors, so please ensure that you fully understand the risks involved and seek independent advice if necessary.
Disclaimer:
The above opinions given constitute general market commentary, and do not constitute the opinion or advice of IC Markets or any form of personal or investment advice.
Any opinions, news, research, analyses, prices, other information, or links to third-party sites contained on this website are provided on an "as-is" basis, are intended only to be informative, is not an advice nor a recommendation, nor research, or a record of our trading prices, or an offer of, or solicitation for a transaction in any financial instrument and thus should not be treated as such. The information provided does not involve any specific investment objectives, financial situation and needs of any specific person who may receive it. Please be aware, that past performance is not a reliable indicator of future performance and/or results. Past Performance or Forward-looking scenarios based upon the reasonable beliefs of the third-party provider are not a guarantee of future performance. Actual results may differ materially from those anticipated in forward-looking or past performance statements. IC Markets makes no representation or warranty and assumes no liability as to the accuracy or completeness of the information provided, nor any loss arising from any investment based on a recommendation, forecast or any information supplied by any third-party.
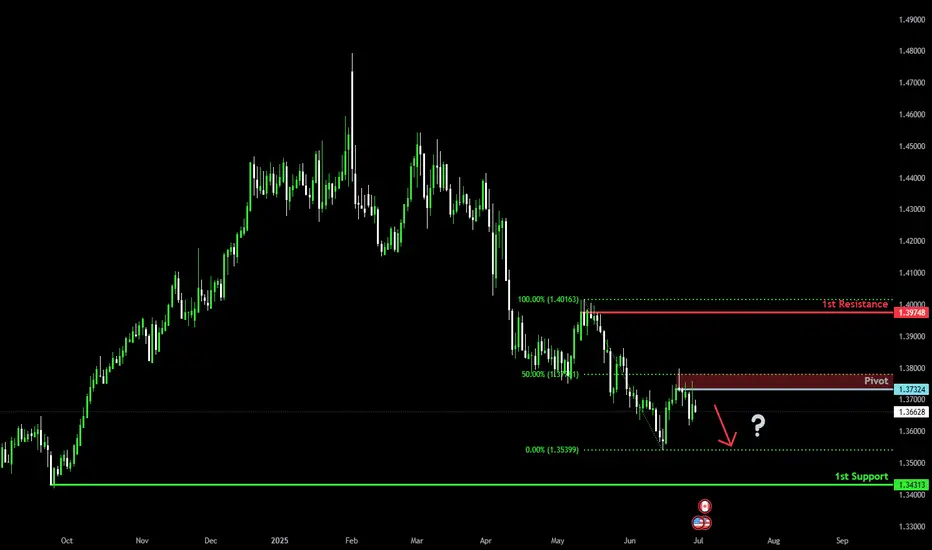
Bearish continuation?The Loonie (USD/CAD) has rejected off the pivot and could drop to the 1st support.
Pivot: 1.3732
1st Support: 1.3431
1st Resistance: 1.3974
Risk Warning:
Trading Forex and CFDs carries a high level of risk to your capital and you should only trade with money you can afford to lose. Trading Forex and CFDs may not be suitable for all investors, so please ensure that you fully understand the risks involved and seek independent advice if necessary.
Disclaimer:
The above opinions given constitute general market commentary, and do not constitute the opinion or advice of IC Markets or any form of personal or investment advice.
Any opinions, news, research, analyses, prices, other information, or links to third-party sites contained on this website are provided on an "as-is" basis, are intended only to be informative, is not an advice nor a recommendation, nor research, or a record of our trading prices, or an offer of, or solicitation for a transaction in any financial instrument and thus should not be treated as such. The information provided does not involve any specific investment objectives, financial situation and needs of any specific person who may receive it. Please be aware, that past performance is not a reliable indicator of future performance and/or results. Past Performance or Forward-looking scenarios based upon the reasonable beliefs of the third-party provider are not a guarantee of future performance. Actual results may differ materially from those anticipated in forward-looking or past performance statements. IC Markets makes no representation or warranty and assumes no liability as to the accuracy or completeness of the information provided, nor any loss arising from any investment based on a recommendation, forecast or any information supplied by any third-party.
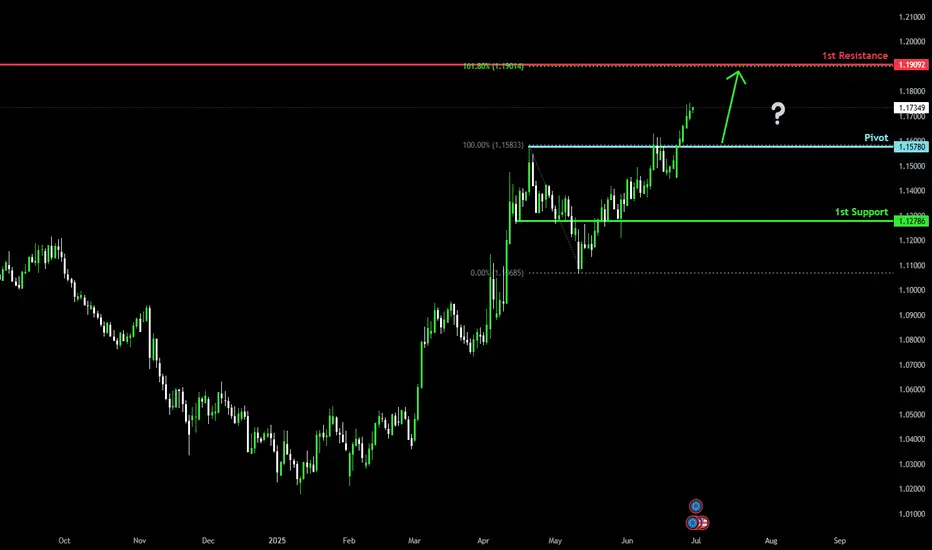
Bullish rise?The Fiber (EUR/USD) has reacted off the pivot and could rise to the 1st resistance.
Pivot: 1.1578
1st Support: 1.1278
1st Resistance: 1.1909
Risk Warning:
Trading Forex and CFDs carries a high level of risk to your capital and you should only trade with money you can afford to lose. Trading Forex and CFDs may not be suitable for all investors, so please ensure that you fully understand the risks involved and seek independent advice if necessary.
Disclaimer:
The above opinions given constitute general market commentary, and do not constitute the opinion or advice of IC Markets or any form of personal or investment advice.
Any opinions, news, research, analyses, prices, other information, or links to third-party sites contained on this website are provided on an "as-is" basis, are intended only to be informative, is not an advice nor a recommendation, nor research, or a record of our trading prices, or an offer of, or solicitation for a transaction in any financial instrument and thus should not be treated as such. The information provided does not involve any specific investment objectives, financial situation and needs of any specific person who may receive it. Please be aware, that past performance is not a reliable indicator of future performance and/or results. Past Performance or Forward-looking scenarios based upon the reasonable beliefs of the third-party provider are not a guarantee of future performance. Actual results may differ materially from those anticipated in forward-looking or past performance statements. IC Markets makes no representation or warranty and assumes no liability as to the accuracy or completeness of the information provided, nor any loss arising from any investment based on a recommendation, forecast or any information supplied by any third-party.
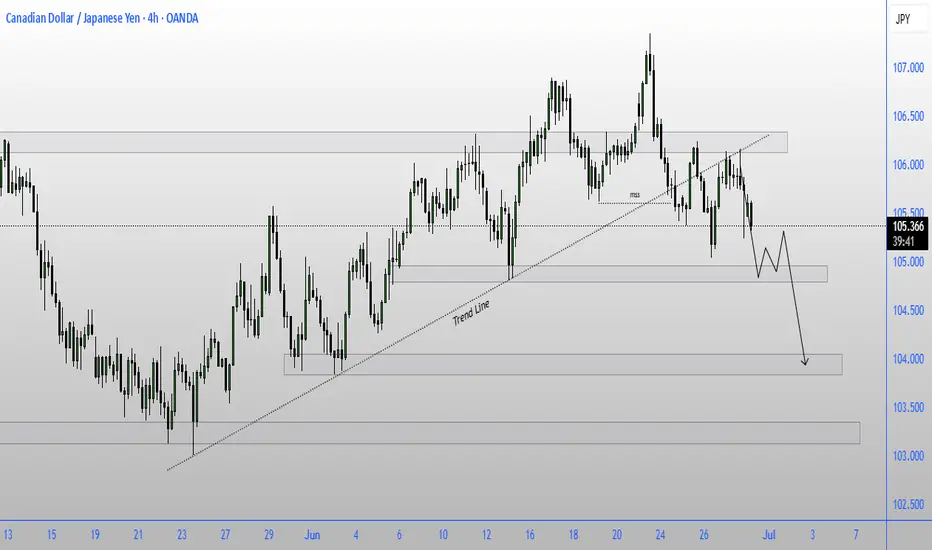
CADJPY BEARISH SETUP💱 CAD/JPY Reversal Watch: Bearish Pressure Builds Below Resistance
4-Hour Candlestick Chart – Analysis as of June 30, 2025
The CAD/JPY pair is showing signs of weakening momentum after repeated failures to break above the key 106.000 resistance level. This suggests growing downside pressure and increased chances of a corrective move in the near term.
🔍 Key Technical Levels
🟥 Current Price: 105.481
🚫 Resistance Zone: Around 106.000 — multiple rejections signal seller dominance
🛡️ Key Support Level: 104.000 — acting as the downside magnet
📉 Downward Arrow: Suggests bearish directional sentiment remains intact
🧠 Technical Interpretation
📌 Price action is forming a lower high, a classic sign of a potential short-term reversal.
📌 Repeated failures near the 106.000 mark highlight resistance strength and declining bullish interest.
📌 A drop below 105.000 could intensify downside momentum, with the 104.000 support as the next major level.
📌 For bulls to regain control, the pair must reclaim 106.000 with solid buying volume.
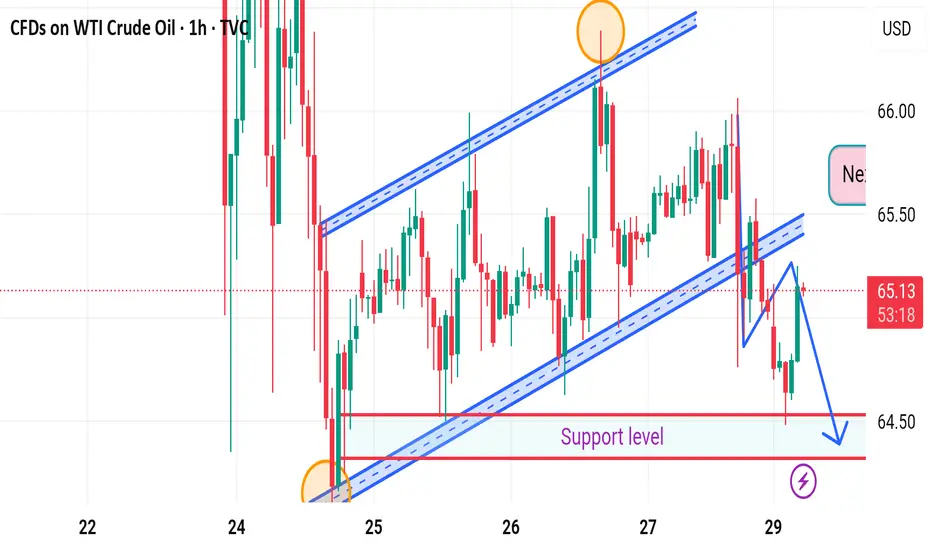
Market next move 🔄 Disruption Analysis: Contrarian View
⚠️ Original Viewpoint Summary:
The original analysis suggests a bearish breakdown from the rising channel, with a short-term target of 64.36, pointing to a move towards the support zone.
---
📉 Disrupted (Contrarian) Perspective:
🔁 Fakeout Scenario Possibility:
The sharp drop below the trendline may be a bear trap.
Price quickly bounced back into the channel region, showing buyer interest near the support.
🔎 Key Observations:
Wick rejection near the lower support suggests that demand is active around 64.50–64.36 zone.
The structure of higher lows is still valid unless there's a confirmed close below the support box.
Momentum indicators (not shown) may help validate whether this is a temporary pullback or a deeper correction.
📈 Alternative Projection:
If price holds above the support zone, it could rebound back to test 65.50–65.80 resistance.
A false breakdown followed by consolidation may lead to retest of the upper channel (near 66.00).
---
🧭 Revised Strategy Suggestion:
Avoid early shorts unless there is a confirmed candle close below 64.36.
Watch for bullish price action near support (hammer, engulfing) for a potential long re-entry.
Reevaluate if WTI forms a base around 64.40 — possible reversal setup.
NZDJPY Technical + Fundamental Short Alignment = Short SetupToday, I want to review the NZDJPY ( OANDA:NZDJPY ) pair short position from a fundamental and technical perspective . It seems to be in a good zone for a short position.
Do you agree with me?
----------------------------------------
First, let's look at the fundamentals of NZDJPY.
New Zealand (RBNZ):
The Reserve Bank of New Zealand cut the OCR by 25bps in May and hinted at further easing if inflation continues to cool. Recent CPI data has shown clear disinflation trends, increasing the likelihood of more rate cuts in the second half of 2025. Consumer confidence is also declining, and retail sales have been weaker than expected.
Japan (BoJ):
The Bank of Japan is under growing pressure to tighten monetary policy. Inflation remains above 2%, and market expectations for a rate hike later this year are building. Any shift from ultra-loose policy supports JPY strength, especially against weaker yielders like NZD.
Macro Summary:
Diverging monetary policies: RBNZ easing, BoJ possibly tightening.
NZD weakened by soft data, JPY strengthened by policy expectations.
Risk sentiment is currently neutral-to-negative, favoring safe-haven JPY.
Conclusion:
Short NZDJPY is fundamentally justified. The pair aligns with macro forces: NZD is pressured by rate cuts and weak growth, while JPY is poised to strengthen with upcoming policy shifts.
----------------------------------------
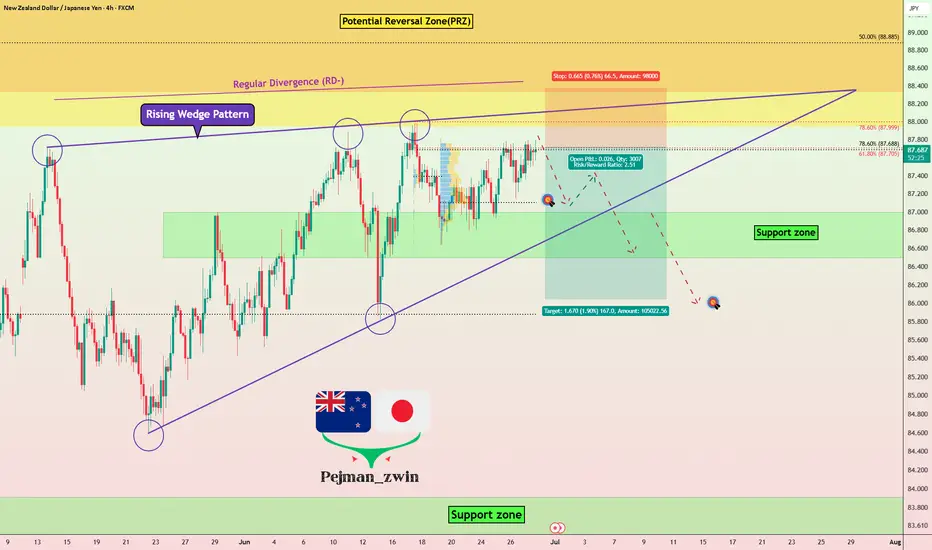
Now let's take a look at the NZDJPY chart on the 4-hour time frame .
NZDJPY is currently trading near the Potential Reversal Zone(PRZ) .
In terms of classic technical analysis , it appears that NZDJPY has successfully formed a Rising Wedge Pattern .
Also, we can see the Regular Divergence(RD-) between Consecutive Peaks.
Based on the above explanation , I expect NZDJPY to drop to at least 87.159 JPY if the lower line of the Rising Wedge Pattern and the Support zone(86.50 JPY-87.00 JPY) are broken, the second target could be 86.043 JPY .
Note: Stop Loss(SL): 88.378 JPY
Please respect each other's ideas and express them politely if you agree or disagree.
New Zealand Dollar/ Japanese Yen Analyze (NZDJPY), 4-hour time frame.
Be sure to follow the updated ideas.
Do not forget to put a Stop loss for your positions (For every position you want to open).
Please follow your strategy and updates; this is just my Idea, and I will gladly see your ideas in this post.
Please do not forget the ✅' like '✅ button 🙏😊 & Share it with your friends; thanks, and Trade safe.
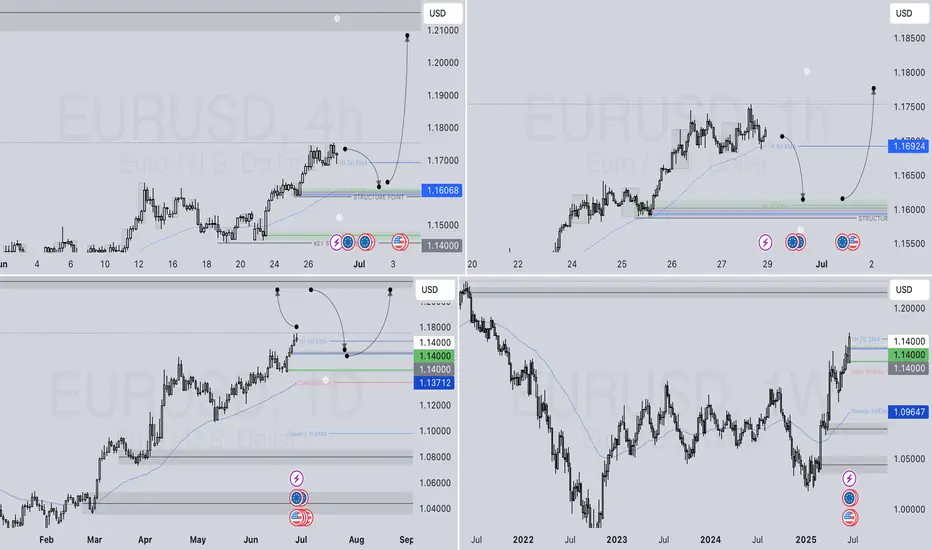
EURUSD WEEKLY HIGHER TIME FRAME FORECAST Q3 W27 Y25EURUSD WEEKLY HIGHER TIME FRAME FORECAST Q3 W27 Y25
Professional Risk Managers👋
Welcome back to another FRGNT chart update📈
Diving into some Forex setups using predominantly higher time frame order blocks alongside confirmation breaks of structure.
Let’s see what price action is telling us today! 👀
💡Here are some trade confluences📝
✅Weekly Order block identified
✅Daily Order block identified
✅4H Order Block identified
🔑 Remember, to participate in trading comes always with a degree of risk, therefore as professional risk managers it remains vital that we stick to our risk management plan as well as our trading strategies.
📈The rest, we leave to the balance of probabilities.
💡Fail to plan. Plan to fail.
🏆It has always been that simple.
❤️Good luck with your trading journey, I shall see you at the very top.
🎯Trade consistent, FRGNT X
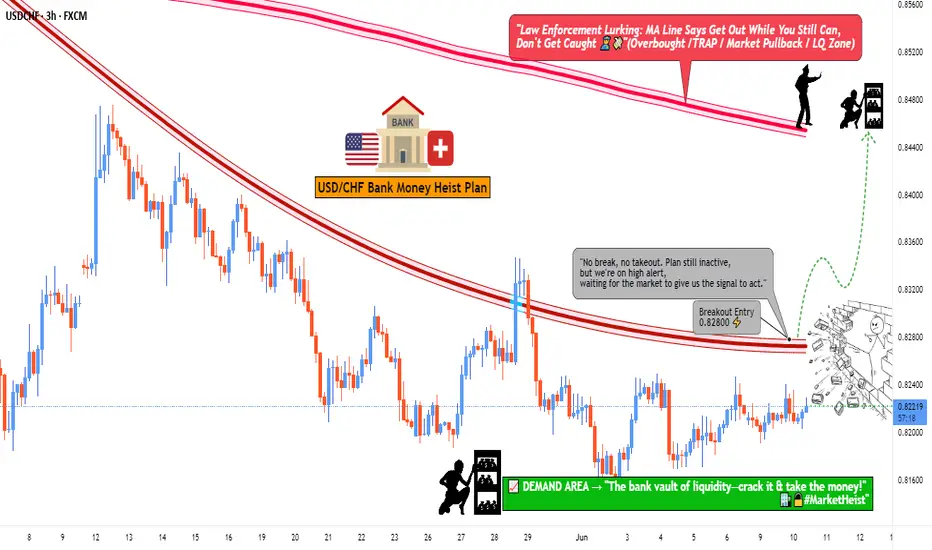
"USD/CHF Breakout - Real Deal or Trap?"🏦 SWISS BANK HEIST: USD/CHF BULLISH LOOT GRAB 🚨
(Professional Money Snatching Strategy)
🦹♂️ Attention All Market Bandits!
(Hola! Oi! Salut! Hallo! Ahlan!) 🎭💰
🔥 Thief Trading Intel Confirmed!
The USD/CHF "Swissy" vault is ready for cracking! Our bullish robbery plan targets 0.84500 - but we must escape before the bears (police) set their trap!
🔓 ENTRY: CRACKING THE SAFE
"0.82800 MA is the vault door!"
✔ Option 1: Buy Stop above MA (breakout play)
✔ Option 2: Buy Limit at swing low (15m/30m pullback)
🔔 Pro Tip: Set alerts - real thieves never miss their heist!
🚨 STOP LOSS: POLICE EVASION PLAN
📍 Thief SL: 0.81900 (below 3H swing low)
⚠️ Warning: No SL before breakout! You'll trigger the alarms!
💎 TARGET: ESCAPE WITH THE LOOT
🎯 Primary Take: 0.84500
💰 Scalpers: Long-only! Trail SL like a getaway car!
📊 MARKET CONDITIONS
⚖️ Neutral Trend (but bullish potential brewing!)
🔍 Key Intel Needed: COT reports, macro data, CHF safe-haven flows
🌐 Full Briefing: Bi0 linkss 👉🔗 (don't go in blind!)
🚦 RISK MANAGEMENT PROTOCOLS
• ❌ Avoid trading during news events
• 🔒 Always use trailing stops
• 💣 Position size = your explosive potential
🦾 SUPPORT THE SYNDICATE
💥 SMASH THAT BOOST BUTTON!
💬 Comment your heist results below!
🔔 Next robbery coming soon - stay tuned!
🤑 Remember thieves: Book profits before the Swiss police arrive!
BANK JOB: NZD/CAD LOOT GRAB (Swing Heist Plan) 🏦 "Market Heist: NZD/CAD Long Before Trap Closes! 💰
🦹♂️ Attention All Market Thieves!
(Hola! Oi! Salut! Hallo! Ahlan!) 🎭💸
🔥 Thief Trading Intel Confirmed!
The NZD/CAD "Kiwi vs Loonie" vault is primed for cracking! Our bullish heist blueprint targets the red zone - but we escape before the bears set their trap!
🔓 ENTRY: CRACKING THE SAFE
"Resistance wall at 0.83150 is the vault door!"
✔ Option 1: Buy Stop above resistance (breakout play)
✔ Option 2: Buy Limit at swing low (15m/30m pullback)
🔔 Pro Tip: Set breakout alerts - don't miss the heist!
🚨 STOP LOSS: POLICE EVASION PLAN
📍 Thief SL: 0.82200 (below 4H swing low & MA)
⚠️ Warning: No SL before breakout! You'll trigger the alarms!
💎 TARGET: ESCAPE WITH THE LOOT
🎯 Primary Take: 0.84400
💰 Scalpers: Long-only! Trail your SL like a getaway car!
📊 MARKET CONDITIONS
🐂 Bullish Trend (but overbought - time it right!)
🔍 Key Intel Needed: COT reports, macro data, sentiment
🌐 Full Briefing: Check bi0 linkss 👉🔗
🚦 RISK MANAGEMENT PROTOCOLS
• ❌ Avoid news event heists
• 🔒 Always use trailing stops
• 💣 Position size = explosive potential
🦾 SUPPORT THE SYNDICATE
💥 SMASH THAT BOOST BUTTON!
💬 Comment your heist results below!
🔔 Next job coming soon - stay tuned!
🤑 Remember thieves: Book profits before the cops arrive!

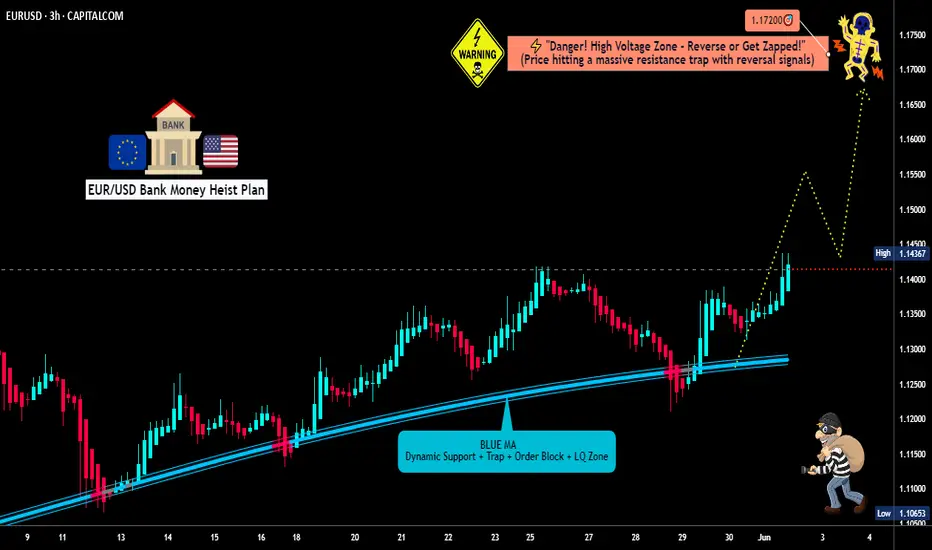
SNATCH & RUN: EUR/USD Long Setup (High-Risk Loot Zone)🔥 EUR/USD Heist: Bullish Loot Before the Trap! (Thief Trading Strategy) 🔥
🌟 Hi! Hola! Ola! Bonjour! Hallo! Marhaba! 🌟
Attention, Money Makers & Market Robbers! 🤑💰💸✈️
Based on the 🔥Thief Trading Style🔥, here’s our master plan to loot the EUR/USD "The Fiber" Forex Market! Follow the strategy on the chart—Long Entry is key. We’re targeting the high-risk Red Zone: overbought, consolidating, and primed for a reversal. Beware the trap—bulls must strike fast before bears ambush! 🏆💸
"Take the profit and treat yourself, trader. You deserve this heist!" 💪🎉
🚪 Entry Point (The Vault is Open!)
📈 "Swipe the bullish loot at any price—the heist is LIVE!"
Pro Tip: Use Buy Limit orders within a 15-30 min timeframe (recent swing low/high). ALERTS ARE A MUST!
🛑 Stop Loss (Escape Route)
Thief SL at nearest swing low (1.12500) on the 3H timeframe (Day/Swing trade).
Adjust based on your risk, lot size, and multiple orders.
🎯 Target (Loot & Scoot!)
🎯 1.17200 (or escape earlier if the cops show up!)
⚡ Scalpers’ Quick Grab
👀 Only scalp LONG!
Big wallets? Raid straight in.
Small stacks? Join swing traders for the robbery.
Use Trailing SL to protect your stolen cash! 💰
📢 Why This Heist? (EUR/USD Bullish Momentum)
"The Fiber" is heating up! Key drivers:
Fundamentals (COT Reports, Macro Data)
Sentiment & Intermarket Trends
Future Targets & Score Outlook
🔗 Want the full intel? Check our bio0 for linkks! 👉👉
⚠️ Trading Alert: News = Danger! 📰🚨
News releases = volatility spikes! Protect your loot:
❌ Avoid new trades during news.
🔒 Use Trailing SL to lock profits.
💖 Support the Heist Crew!
💥 Smash the Boost Button! 💥
More boosts = easier money steals!
Strengthen our robbery squad!
Every day is a heist—profit with Thief Trading Style! 🏆🚀
Stay tuned for the next robbery plan! 🤑🐱👤🤩
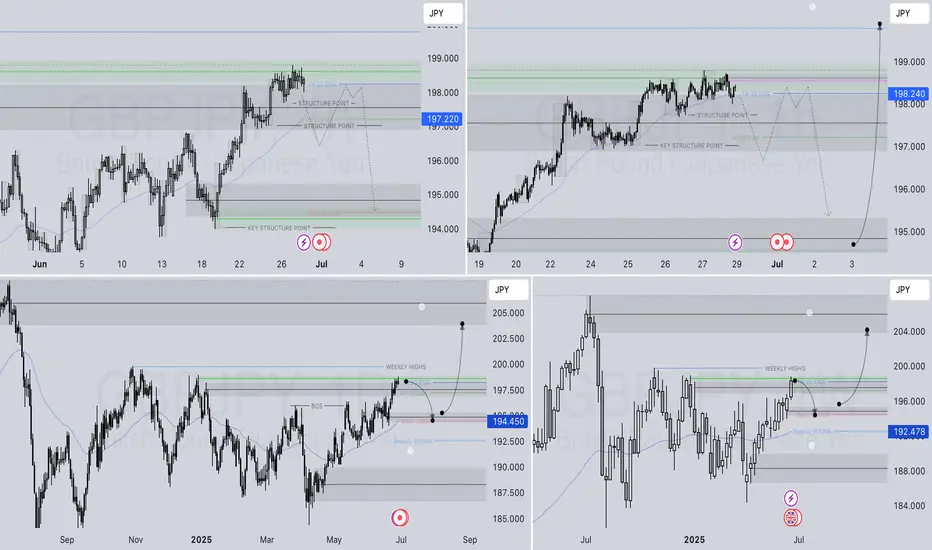
GBPJPY WEEKLY HIGHER TIME FRAME FORECAST Q3 W27 Y25GBPJPY WEEKLY HIGHER TIME FRAME FORECAST Q3 W27 Y25
Professional Risk Managers👋
Welcome back to another FRGNT chart update📈
Diving into some Forex setups using predominantly higher time frame order blocks alongside confirmation breaks of structure.
Let’s see what price action is telling us today! 👀
💡Here are some trade confluences📝
✅Weekly 50EMA Rejection
✅Daily Order block identified
✅1H Order Block identified
🔑 Remember, to participate in trading comes always with a degree of risk, therefore as professional risk managers it remains vital that we stick to our risk management plan as well as our trading strategies.
📈The rest, we leave to the balance of probabilities.
💡Fail to plan. Plan to fail.
🏆It has always been that simple.
❤️Good luck with your trading journey, I shall see you at the very top.
🎯Trade consistent, FRGNT X
GBP/USD Robbery: Can You Grab the Cash Before the Cops Arrive?🚨 GBP/USD "The Cable" forex bank Heist Alert: The Bullish Breakout Robbery Plan (Swing & Scalp Strategy) 🚨
🌟 Hi! Hola! Ola! Bonjour! Hallo! Marhaba! 🌟
Attention Money Makers & Market Robbers! 🤑💰💸
Based on the 🔥Thief Trading Style🔥, here’s our master plan to loot the GBP/USD "The Cable" forex bank. Follow the strategy on the chart—focusing on LONG entries—and escape near the high-risk Red Zone. This area is overbought, consolidating, and a potential reversal trap where bears lurk. 🏆 Take profits fast—you’ve earned it! 💪
🎯 Heist Entries:
📈 Entry 1: "The Breakout Heist!" – Wait for Resistance (1.36200) to break, then strike! Bullish profits await.
📈 Entry 2: "Big Players’ Pullback!" – Jump in at 1.34000+ buy above at any price for a safer steal.
🔔 Pro Tip: Set a chart alert to catch the breakout instantly!
🛑 Stop Loss Rules:
*"Yo, listen! 🗣️ If you’re entering with a buy-stop, DON’T set your SL until AFTER the breakout. Place it at the nearest swing low (3H timeframe) or wherever your risk allows—but remember, rebels risk more! 🔥"*
🏴☠️ Target: 1.37500
🧲 Scalpers: Only play LONG! Use trailing SL to lock in profits. Big wallets? Go all in. Small stacks? Join the swing heist!
📊 Market Pulse:
The GBP/USD "The Cable" is neutral but primed for bullish momentum. Watch:
Fundamentals (COT, Macro, Geopolitics)
Sentiment & Intermarket Trends
Positioning & Future Targets & Overall score
📌 Check our bioo linkks for deep analysis! 🔗🌍
⚠️ Trading Alert:
News = Volatility! Protect your loot:
Avoid new trades during major news
Use trailing stops to secure profits
💥 Boost This Heist!
Hit 👍 & 🔄 to strengthen our robbery crew! Let’s dominate the market daily with the Thief Trading Style. 🚀💵
Stay tuned—another heist drops soon! 🎯🐱👤

"(NZD/JPY) Kiwi-Yen Bandit Trade: Steal 200+ Pips This Week!"🚨 NZD/JPY Bank Heist: Loot the Kiwi-Yen Rally Before the Cops Arrive!
🌟Hola! Kia ora! Konnichiwa! Hello, thieves! 🌟
Attention all market bandits & profit pirates! 🏴☠️💰
Your favorite 🔥Thief Trading Crew🔥 is back with another high-stakes forex robbery—this time targeting the NZD/JPY "Kiwi vs Yen" vault!
🔓 The Master Plan:
Long entry = Our golden key to the bank.
Target: The high-risk Yellow ATR line (where traps lurk, but so do MASSIVE profits!).
Danger zone: Overbought signals, bearish ambushes, fakeouts—but we steal smarter!
📈 Entry Point:
"Vault doors cracked open—swipe those bullish gains NOW!"
👉 Pro thief move: Set buy limits near 15-30min swing lows/highs for sneaky pullback entries.
🛑 Stop Loss (Escape Route):
Thief SL: Hide below the 4H moving average (85.800).
Adjust based on your risk appetite & loot size.
🎯 Take Profit: 88.500 (Time to vanish with the cash!)
⚡ Scalpers’ Corner:
Only scalp LONG—no bearish bets!
Big stacks? Raid the market now.
Small budget? Join swing traders & execute the heist slow & steady.
Trailing SL = Your getaway driver. 🚗💨
💡 Why NZD/JPY?
Bullish momentum fueled by:
Fundamentals (COT data, macro trends)
Market sentiment & intermarket flows (Full analysis in bi0 linkks! 🔗👉👉👉)
⚠️ Heist Alert! News = Police sirens! 📢🚨
Avoid new trades during high-impact news.
Trailing stops = Your invisibility cloak.
💖 Support the Crew!
SMASH THAT BOOST BUTTON! 💥
Help us dominate the charts & loot daily with the Thief Trading Style! 💰🔥
Next heist coming soon… Stay sharp, thieves! 😎🔪

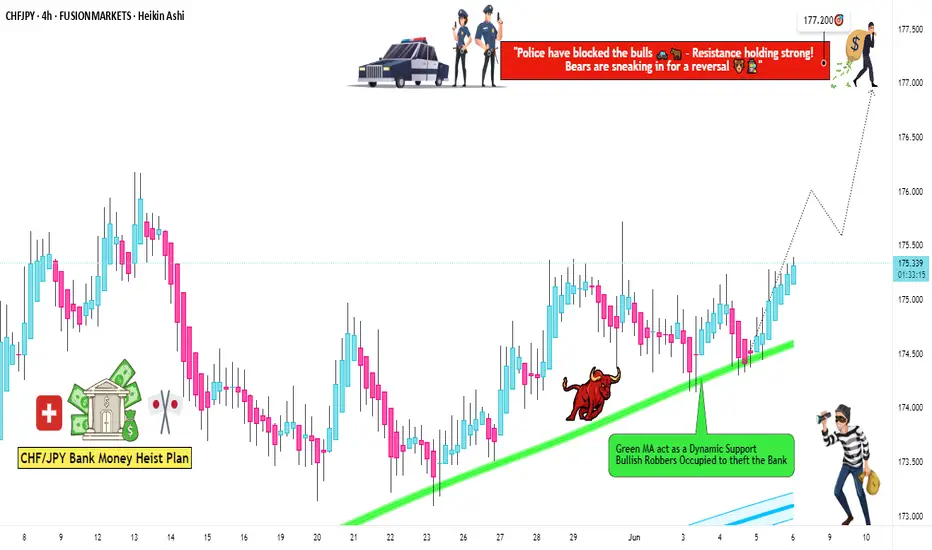
"CHF/JPY Bullish Trap? We’re Stealing Profits Anyway!"🔥 Swiss-Yen Bank Heist: Bullish Loot Grab! (CHF/JPY Master Plan) 🔥
🌟 Hi! Hola! Ola! Bonjour! Hallo! Marhaba! 🌟
Attention Money Makers & Market Robbers! 🤑💰💸✈️
Based on the 🔥Thief Trading Style🔥 (technical + fundamental analysis), we’re plotting a bullish heist on the CHF/JPY "Swiss-Yen" Forex Bank. Follow the strategy on the chart—long entry is our golden ticket! Target? The high-risk Red Zone—where police traps, overbought signals, and bearish robbers lurk. But we’re sneaky thieves… and we always get the loot! 🏆💸
📈 Entry: "The vault is wide open!" Swipe bullish gains at any price—the heist is LIVE!
Pro Tip: Place buy limit orders within 15-30 min (swing lows/highs).
🛑 Stop Loss:
Thief-style SL at recent 4H swing low (174.100) (Day/scalping trade)
Adjust based on your risk, lot size, and multiple orders.
🎯 Target: 177.200 (Time to cash out!)
🧲 Scalpers: Eyes here! 👀
Only scalp LONG.
Big money? Charge in! Small budget? Join swing traders and execute the robbery.
Trailing SL = Your money’s bodyguard. 💰
Why CHF/JPY?
Bullish momentum fueled by:
Fundamentals (COT reports, macro trends)
Sentiment + Intermarket analysis (Check our bioo for deep dives! 🔗👉👉👉)
⚠️ Trading Alert: News = Chaos! 📰🗞️🚫
Avoid new trades during major news.
Trailing stops = Profit protector.
💖 Support the Heist!
Smash the Boost Button! 💥
Strengthen our robbery squad. Steal profits daily with the Thief Trading Style! 🏆💪🚀
Stay tuned—another heist drops soon! 🤑🐱👤🤩
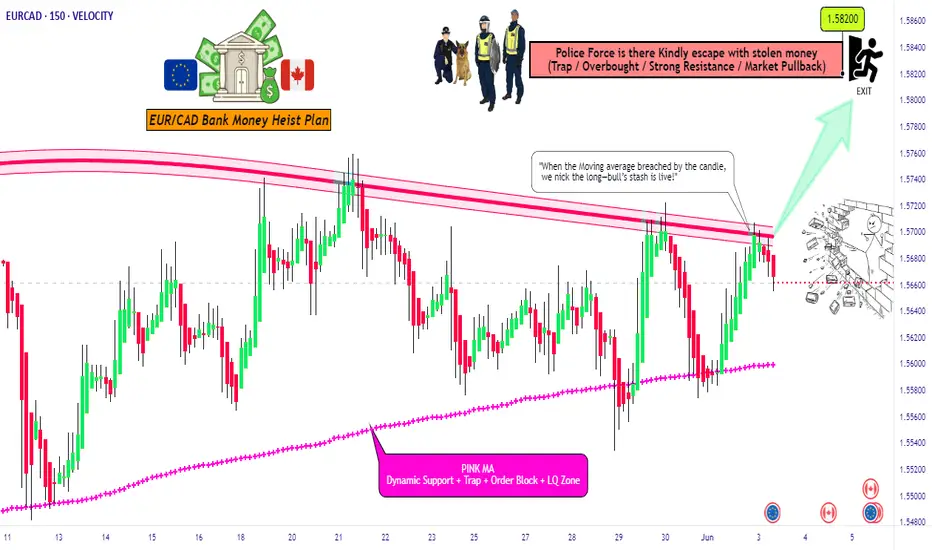
EUR/CAD Raid Alert: Last Chance to Loot This Bullish Breakout!🏴☠️ EUR/CAD LOOT ALERT: Can We Steal 100 Pips Before the Trap Springs? (Thief Trading Blueprint)
🌟 Hola! Bonjour! Ciao! Hallo! Marhaba! 🌟
Attention Forex Bandits & Loonie Raiders! 💶🦫💰
🔥 Thief Trading Intel: We're targeting EUR/CAD for a MA breakout heist! Long entry only - eyeing that 1.57200 breakout level. High-risk MA Zone ahead: overbought, consolidating, perfect for our ambush.
"Take your pips and vanish - this steal's on the house!" 💨💵
🚪 ENTRY: The Trap is Set!
📈 "Wait for MA breakout at 1.57200 - then STRIKE!"
Option 1: Buy Stop above MA (breakout confirmation)
Option 2: Buy Limit at swing levels (15-30 min TF)
📌 Pro Thief Move: SET THOSE ALERTS!
🛑 STOP LOSS: Escape Plan
🔊 "Listen up, rookies!" 🗣️
Breakout trades? NO SL until after confirmation!
Rebels: Place wherever... but sleep with one eye open! 👁️
📍 Smart Crew SL: Nearest swing low (1H TF)
🎯 TARGET: Loot & Scoot!
🎯 1.58200 (100 pips of pure profit!)
⚡ SCALPERS' QUICK HIT
👀 Long only!
Deep pockets? Raid now
Light wallet? Join swing heist
Trailing SL = Your Getaway Car! 🚗💨
📢 WHY THIS HEIST?
"Euro vs Loonie" showing strength! Watch for:
COT data & Macro trends
Intermarket analysis
Sentiment shifts
🔗 Full dossier? Bio0 links below! 👉🏻☝🏻👉🏻☝🏻
⚠️ WARNING: News = Police Raid! 📰🚨
CAD news moves fast! Protect your stash:
❌ No new trades during news
🔒 Trailing stops = Handcuff-proof profits
💖 SUPPORT THE CREW!
💥 SMASH THAT BOOST BUTTON! 💥
More boosts = bigger future scores!
Stronger crew = more pips for all!
Next currency heist coming soon... 💶🔫