CAD/JPY Bank Heist: Bullish Breakout (or) Bearish Trap?🌟 Hi! Hola! Ola! Bonjour! Hallo! Marhaba! 🌟
Dear Money Makers & Market Robbers, 🤑💰💸✈️
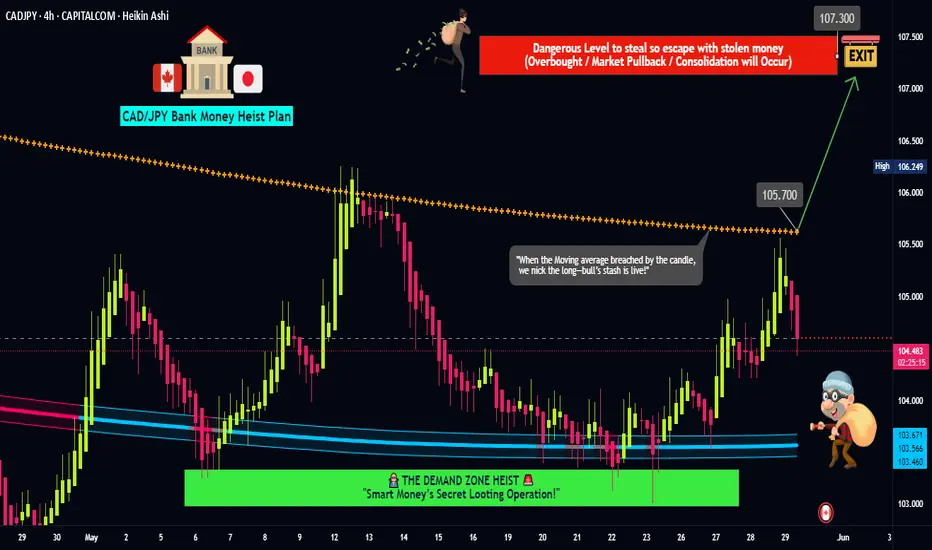
Based on the 🔥Thief Trading Style🔥, here’s our master plan to loot the CAD/JPY "Loonie-Yen" Forex Bank Heist! Follow the strategy on the chart—Long Entry is the play. Our escape? Near the high-risk Danger Resistance Zone. It’s a risky level—overbought, consolidating, potential reversal—where bearish robbers lurk. 🏆💸 Take profits fast, traders! You earned it! 💪🎉
📈 Entry: The Heist Begins!
Wait for the breakout above 105.700—then strike! Bullish profits await.
Buy Stop Orders above Moving Average OR
Buy Limit Orders (15-30min timeframe) near swing lows/highs for pullback entries.
📌 Set an ALERT! Don’t miss the breakout.
🛑 Stop Loss: Protect Your Loot!
🔊 Yo, listen up! 🗣️
Buy Stop Orders? Don’t set SL until after breakout.
Place SL at nearest/swing low (4H timeframe)—adjust based on your risk & lot size.
Rebels, set SL wherever… but don’t cry later! 🔥⚡
🎯 Target: 107.300
Scalpers: Only go LONG. Use trailing SL to lock in gains.
Swing Traders: Ride the wave or join late—robbery is teamwork! 🤝
💥 Why CAD/JPY? Bullish Momentum!
Fundamentals, COT Reports, Sentiment, Intermarket Trends—checkk our bio for full analysis. 🔗🔗🔗
⚠️ Trading Alert: News = Danger!
Avoid new trades during news.
Use trailing stops to protect profits.
💖 Support the Heist! Hit the BOOST Button!
More boosts = More robberies = More profits! 💰🚀
Stay tuned—next heist coming soon! �🤗🎉
Forexsignals
NZD/CHF Heist Blueprint: Snag the Kiwi vs. Franc Profits!Ultimate NZD/CHF Heist Plan: Snag the Kiwi vs. Franc Loot! 🚀💰
🌍 Greetings, Wealth Raiders! Hola! Ciao! Bonjour! 🌟
Fellow money chasers and market bandits, 🤑💸 let’s dive into the NZD/CHF "Kiwi vs. Franc" Forex heist with our 🔥Thief Trading Style🔥, blending sharp technicals and solid fundamentals. Follow the charted strategy for a long entry, aiming to cash out near the high-risk ATR zone. Watch out for overbought signals, consolidation, or a trend reversal trap where bearish robbers lurk. 🏴☠️💪 Seize your profits and treat yourself—you’ve earned it! 🎉
Entry 📈
The vault’s open wide! 🏦 Grab the bullish loot at the current price—the heist is live! For precision, set Buy Limit orders on a 15 or 30-minute timeframe, targeting a retest of the nearest high or low.
Stop Loss 🛑
📍 Place your Thief SL at the recent swing low on a 4H timeframe for day trades.
📍 Adjust SL based on your risk tolerance, lot size, and number of orders.
Target 🎯
Aim for 0.50400 or slip out early to secure your loot! 💰
Scalpers, Listen Up! 👀
Stick to long-side scalps. Got big capital? Jump in now! Smaller stacks? Join swing traders for the robbery. Use a trailing SL to lock in your gains. 🧲💵
NZD/CHF Market Intel 📊
The Kiwi vs. Franc is riding a bullish wave, fueled by key drivers. Dig into the fundamentals, macro trends, COT reports, sentiment, intermarket analysis, and future targets for the full scoop. 🔗👇
⚠️ Trading Alert: News & Position Safety 📰
News drops can shake the market! To protect your loot:
Skip new trades during news releases.
Use trailing stops to secure profits and limit losses. 🚫
Join the Heist! 💥
Support our robbery plan—hit the Boost Button! 🚀 Let’s stack cash with ease using the Thief Trading Style. 💪🤝 Stay sharp for the next heist plan, bandits! 🤑🐱👤🎉

Is This the Next Big Heist? Thief Trader Eyes NZD/USD Long SetupThief Trader’s NZD/USD Heist Plan – Long Setup in Play!
🌍 **Hello Global Wealth Warriors!**
Hello, Bonjour, Ciao, Salut, Guten Tag, Ola!
📢 **Fellow Profit Pirates & Market Mavericks**, it’s time to set sail again! Get ready to loot the forex seas with our latest **Thief Trader Strategy** targeting the **NZD/USD (The Kiwi)** pair.
---
🔎 **Trade Overview**
💥 Setup: Long Entry Plan – Executing our cunning blueprint with Thief Trading's sharp technical & fundamental intel**.
🎯 Target: 0.62300 (or exit just before for safety).
⚠️ Danger Zone: Watch for traps at the RED Zone Level – signs of overbought conditions, consolidation, trend flips & bearish setups.
---
🟢 **Entry Signal** – *The Heist Begins!*
📈 **Primary Entry**:
> Breakout above **MA Line (0.60300)** = Bullish move → *Place a Buy Stop above ATR Line*
📉 **Pullback Option**:
> *Buy Limit* at recent swing low/high on **15 or 30-min TF**.
📌 **Pro Tip**:
Set an **Alert** on your chart to catch the breakout live. Timing is everything!
---
🛑 **Stop Loss – The Getaway Plan**
📍 **SL Recommendation**:
> Recent swing low on the **4H chart (0.59400)** for day/swing trades.
> 🎯 Customize your SL based on risk, lot size, and total orders.
---
🔐 **Scalpers vs. Swingers**
👀 **Scalpers**: Focus ONLY on long-side plays.
💰 Got deep pockets? Dive in.
😎 Otherwise, swing traders – this is your golden moment. Trail your SL to protect profits.
🌐 **Market Pulse** – Momentum Watch
📊 Kiwi is navigating a **MA Resistance Zone**, but bullish bias remains due to:
* **Fundamentals**
* **Macro Insights**
* **COT Reports**
* **Sentiment & Intermarket Trends**
* **Quant Analysis + Overall Score**
📎 Check the linkks for detailed breakdown.
📰 **News Warning!**
⚠️ Major releases ahead?
* Pause entries.
* Protect trades with **trailing SLs**.
---
🚨 **Join the Next Heist with Thief Trading!**
💥 Smash that **Boost** or **Like** to join our profit squad.
With **Thief Trader Style**, we dominate the markets DAILY.
Your support fuels our mission. ❤️💼
---
💸 Stay ready for the next move, money-makers.
🎯 Eyes on the chart – timing is profit.

The Aussie Dollar Heist Blueprint: "AUD/USD" Long Setup!?🌍 Hello, Global Wealth Warriors! Ciao, Salut, Guten Tag, Ola! 🌟
Fellow Profit Pirates & Market Mavericks, 💸⚡
Unveiling our cunning blueprint to plunder the AUD/USD (The Aussie) forex market, crafted with 🔥Thief Trading’s razor-sharp technical and fundamental insights🔥. Stick to the chart’s game plan, zoned in on a long entry. Our mission? Slip out near the high-stakes RED Zone Level—a perilous spot with overbought vibes, consolidation, trend flips, and traps where bearish bandits lurk. 🏴☠️💰 Celebrate your wins, traders—you’ve earned it! 🎉
Entry 📈 : "The heist is on! Wait for the MA line breakout (0.65200) then make your move - Bullish profits await!"
however I advise to Place Buy stop orders above the ATR line (or) Place buy limit orders within a 15 or 30 minute timeframe most recent or swing, low or high level for Pullback entries.
📌I strongly advise you to set an "alert (Alarm)" on your chart so you can see when the breakout entry occurs.
🛑 **Stop Loss**:
📍 Thief SL parked at the recent/swing low on the 4H timeframe (0.64600) for day/swing trades.
📍 Tailor your SL to your risk appetite, lot size, and number of orders. Stay sharp!
🎯 **Target**: Aim for 0.66300 or make a swift exit just before.
👀 **Scalpers, Listen Up**: Stick to long-side scalping. Got deep pockets? Dive in now! Otherwise, join swing traders for the grand heist. Use trailing SL to shield your loot. 💰
💹 **Market Pulse**: The AUD/USD (The Aussie) forex market is in a ATR Dynamic Resistance zone but leaning bullish, fueled by key drivers. ☝
🌐 Dive into Fundamentals, Macro Insights, COT Reports, Quantitative Analysis, Sentiment Outlook, Intermarket Trends, Future Targets & Overall score.. Check the linkss for the full scoop! 🔗🌍
⚠️ **Trading Alert**: News can shake the market! 📰
🔐 Protect your positions:
- Pause new trades during news releases.
- Use trailing stop-loss to lock in gains.
💪 **Join the Heist**: Smash the Boost Button to supercharge our robbery squad! 💥 With Thief Trading Style, we rake in profits daily with ease. 🚀 Your support fuels our market conquests. 🤝❤️
Stay tuned for the next daring heist, money makers! 🤑🐱👤🎯

Master Your Edge: It’s Not About Just Being Right
Most traders obsess over being right on every trade. But the truth is, consistent profitability doesn’t come from perfect predictions—it comes from disciplined risk management.
Mark Douglas reminds us:
“Trading is not about being right or wrong. It’s about how much you make when you’re right and how much you lose when you’re wrong.”
Focus less on proving yourself right, and more on protecting your capital when you’re wrong. That’s how professionals thrive in uncertain markets.
#MJTrading
#TradingPsychology #MarkDouglas #ForexMindset #TraderMindset #EURUSD #TradingQuotes #ForexLife #RiskManagement #TradingDiscipline #ForexEducation #ChartOfTheDay #PriceAction #MindOverMarkets
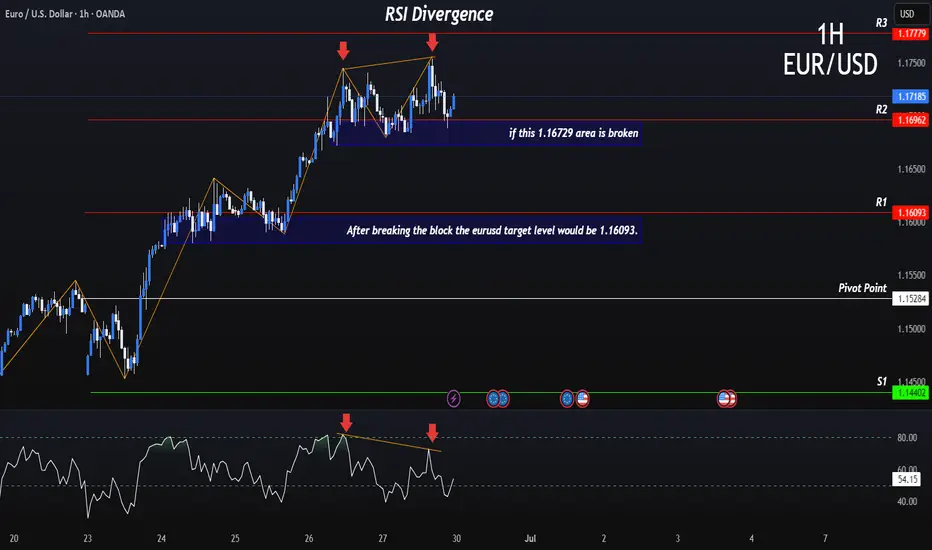
RSI Flashes Warning on EURUSD: Critical Level Under Watch!Good morning traders,
If the EURUSD pair breaks below the 1.16729 level due to an RSI divergence, the next potential target could be around 1.16093.
Keep in mind that a break below 1.16729 may also signal a potential trend reversal.
I've marked the pivot points for you on the chart for better clarity.
Additionally, it's crucial to keep an eye on current economic data and news releases as part of your fundamental analysis.
I meticulously prepare these analyses for you, and I sincerely appreciate your support through likes. Every like from you is my biggest motivation to continue sharing my analyses.
I’m truly grateful for each of you—love to all my followers💙💙💙
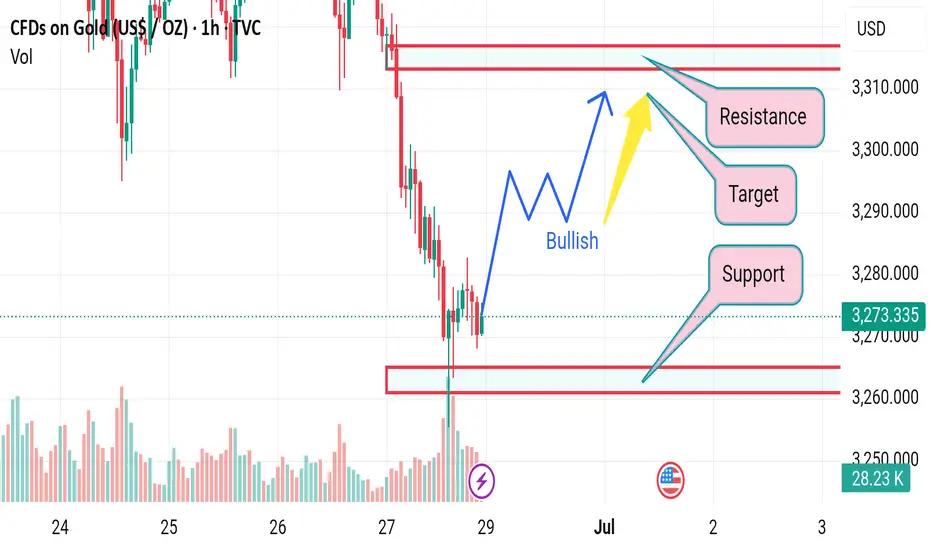
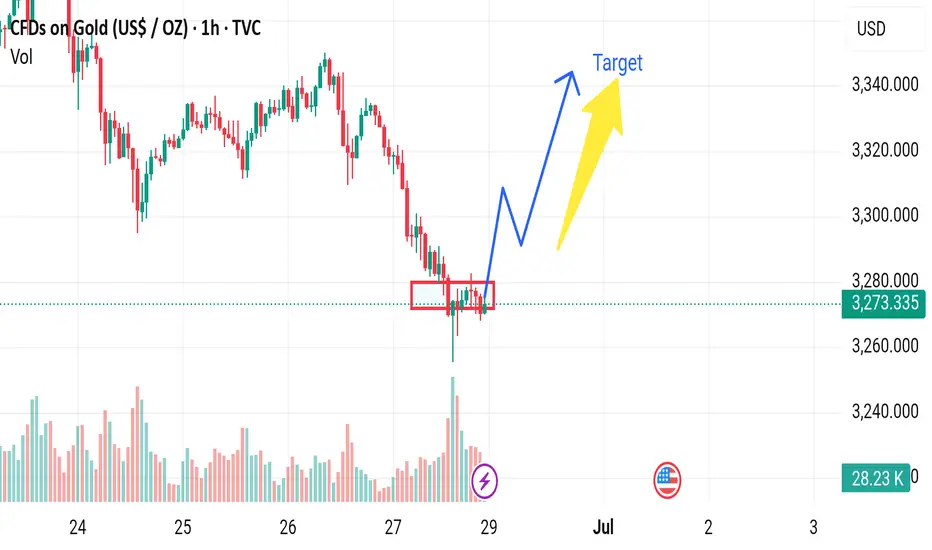
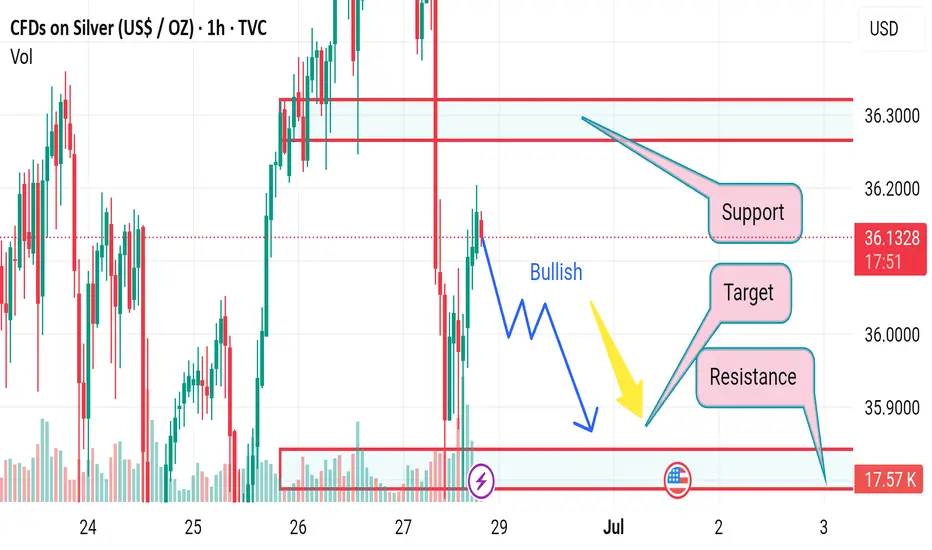
Market next target 🟥 Disrupted (Bearish or Cautious) Analysis:
1. Failed Bullish Attempt Risk
While a bounce from the support zone (~3,260 USD) is visible, the momentum lacks strong bullish confirmation. The rejection from the support area could be a dead-cat bounce, especially since the overall trend leading into this zone was sharply downward.
2. Volume Divergence
The volume spike on the large red candle suggests heavy selling pressure, not accumulation. The weak follow-up volume on the minor green recovery bars indicates a lack of buyer confidence.
3. False Breakout Possibility
If price does push toward the “Target” or even the “Resistance” zone (3,290–3,310), it might be a bull trap, luring late buyers in before a reversal back downward.
4. Bearish Continuation Scenario
Price may retest the support zone (3,260) again.
If this support breaks decisively, it could trigger a strong sell-off, with potential to test lower zones around 3,240 or even 3,200.
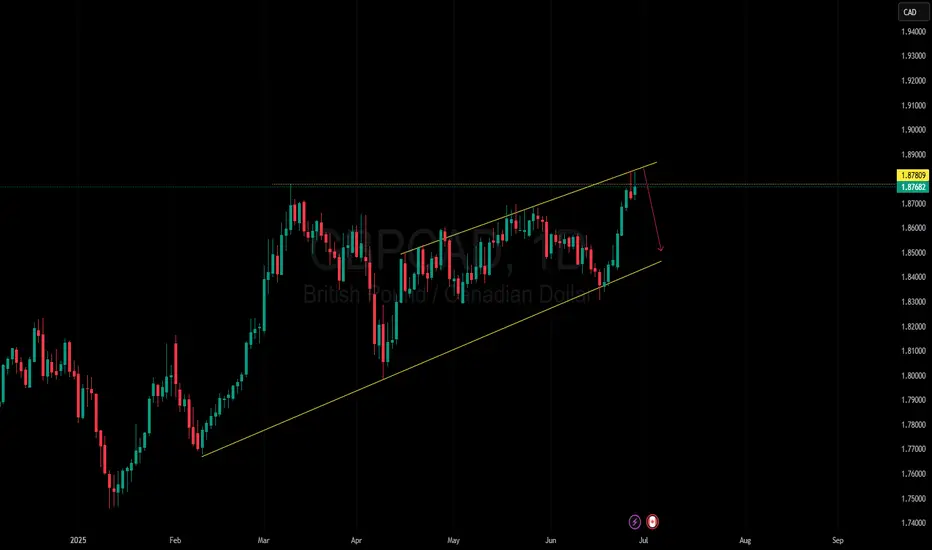
Failed to break higher — now it’s time to crash.After a sharp rally, the market has hit its previous all-time high.
📌 A double top is now forming — signaling a potential short-term pullback.
Get ready for a possible dip — let’s go! 🚨
OANDA:GBPCAD
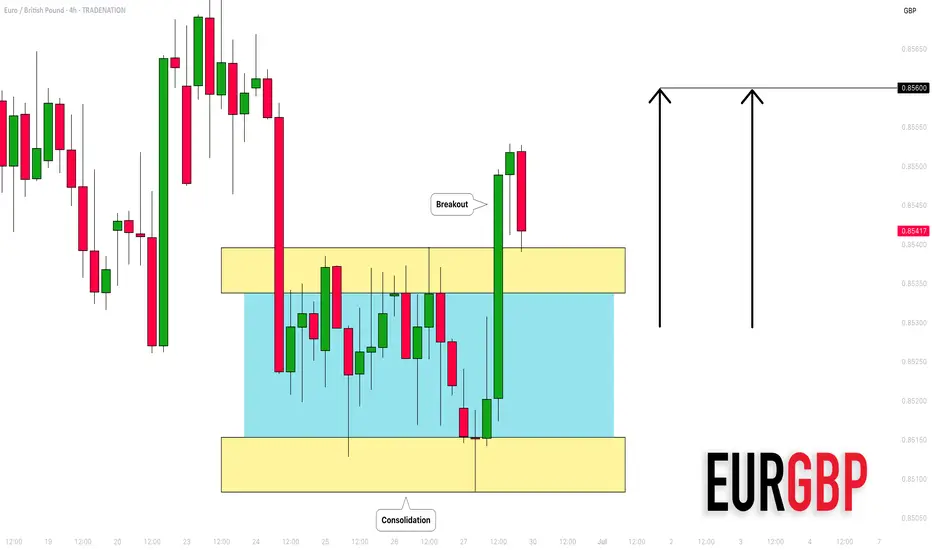
EURGBP: Bullish Move Ahead! 🇪🇺🇬🇧
EURGBP violated a consolidation range on Friday.
It is an important sign of strength of the buyers and I expect a bullish continuation
next week.
Goal - 0.856
❤️Please, support my work with like, thank you!❤️
I am part of Trade Nation's Influencer program and receive a monthly fee for using their TradingView charts in my analysis.
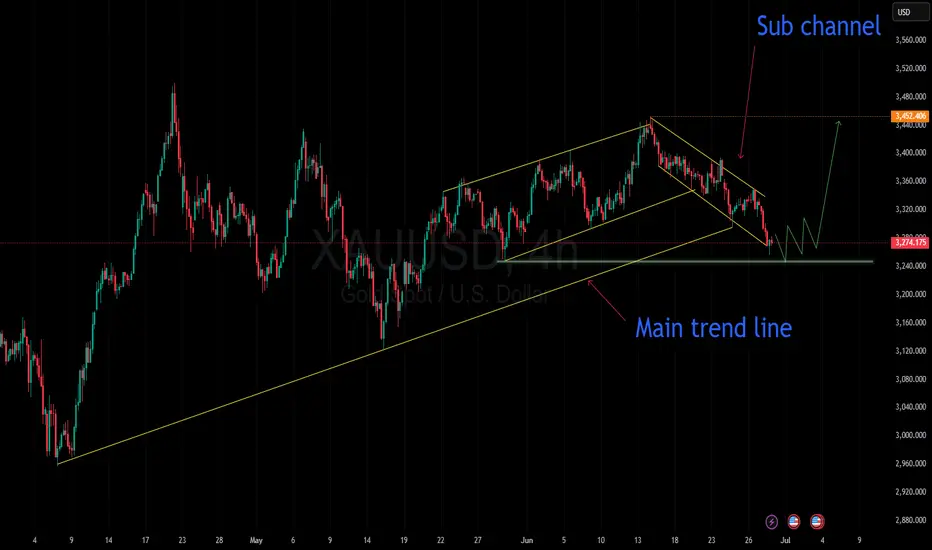
Gold is coiling for a breakout... All eyes on the next move!📉 Gold is currently moving within a minor descending channel.
In yesterday’s analysis, I pointed out the potential for a drop. Now, after a period of range-bound movement, I expect a breakout from this channel and a return to the main trend.
🎯 The first target on a reversal would be the top of the minor channel.
Keep a close eye on price action here — this zone could be key for the next move
OANDA:XAUUSD
Market next move Disruption (Bearish Scenario):
1. False Breakout Risk:
The price has recently tested the lower support range (red boxes) several times without strong follow-through. This could suggest weak buying momentum.
2. Volume Spike Trap:
The large volume spike on the wick down may represent stop-loss hunting or a liquidity grab rather than true accumulation. If it were strong accumulation, we would expect a more sustained bounce.
3. Resistance Zone Ahead:
The price is nearing resistance around $3,275–$3,280, where previous breakdowns started. If it fails to break above this zone decisively, a rejection and continued downtrend is possible.
4. Lower High Formation:
The most recent price action could form a lower high, suggesting a continuation of the bearish trend instead of a reversal.
---
🔽 Bearish Path (Alternative Projection):
Price retests $3,275–$3,280, fails to break out.
Drops below the red box support (~$3,260).
Heads toward the next support levels around $3,240 or lower.
📉 "Target becomes invalidated if price fails to hold above the red box support zone."
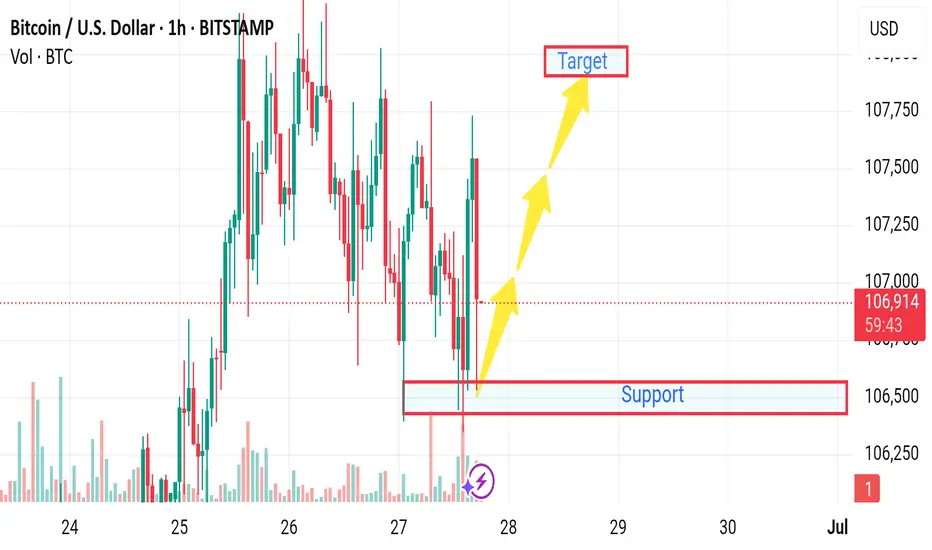
Market next target ⚠️ Disruption & Analytical Weaknesses:
1. Support Zone Already Broken (Wick Penetration):
The candlestick wick clearly pierced the support level drawn on the chart.
This indicates that buyers are weak at that level — the support is not holding firmly.
Relying on this support for a bullish bias is risky, as it may soon turn into resistance.
2. Volume Confirms Weakness, Not Strength:
The bounce from the support zone happens on low or declining volume, suggesting lack of strong buying interest.
A legitimate bullish reversal should be backed by a volume surge — here, that’s absent.
3. False Sense of Recovery:
The analysis shows arrows projecting straight up to the “Target” level, implying a smooth bullish recovery.
This is unrealistic given the recent choppy price action and repeated failures to hold gains above 107,200.
Price action suggests uncertainty or distribution, not clean bullish momentum.
4. Tight Range and High Volatility Ignored:
Price has been ranging between ~106,400 and ~107,600 with rapid whipsaws.
This kind of structure is often indicative of indecision, and setting a clear directional target without breakout confirmation is premature
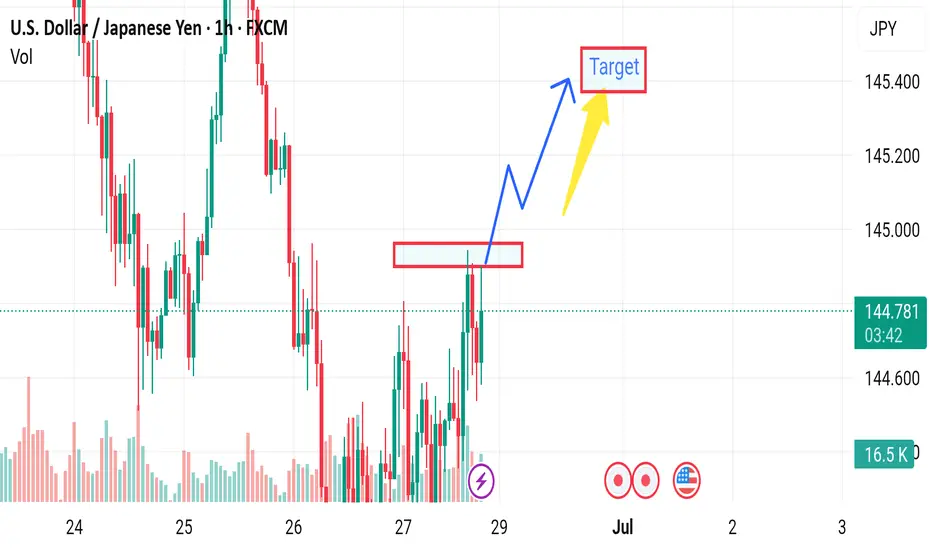
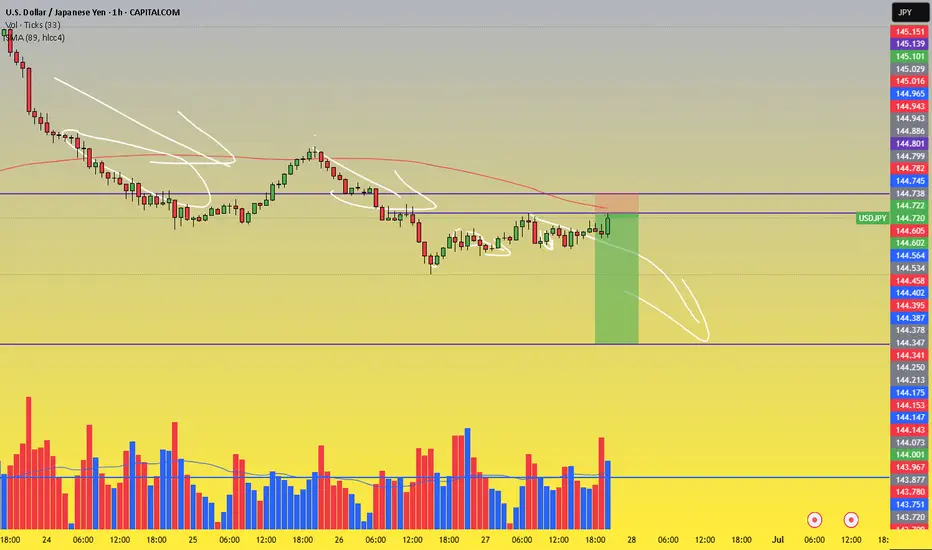
Market next target ⚠️ Disruption & Counterpoints:
1. Premature Breakout Bias:
The chart shows price repeatedly rejecting the resistance zone (highlighted in red).
The arrow assumes a clean breakout without confirmation — this is speculative, as the price hasn’t closed convincingly above the resistance.
This could easily turn into a false breakout or double top if price fails again.
2. Volume Mismatch:
A breakout should be backed by strong bullish volume. However, the current volume is mixed and not showing a clear surge in buyer strength.
Lack of volume confirmation makes the breakout less reliable.
3. Ignoring Recent Rejections:
The red zone was tested multiple times in the last sessions without success. That typically signals strong supply or institutional selling.
Repeating this setup without accounting for historical failure adds downside risk.
4. Missing Bearish Scenario:
No alternate path is considered. A failed breakout could lead to a pullback toward 144.00 or lower, especially with U.S. news events (indicated by the flag).
A balanced analysis should always prepare for both breakout and rejection.
5. Macroeconomic Event Risk:
Similar to the GBP/USD chart, this one also shows an upcoming U.S. economic event. That could heavily move USD/JPY, and technical setups may become invalid fast.
The analysis ignores the need to wait for the news catalyst or confirmation after the release.
Market next move ⚠️ Disruption & Counterpoints:
1. Labeling Error – "Bullish" in a Bearish Trend:
The chart clearly shows a strong downtrend starting after the peak on June 28.
Despite this, the word "Bullish" is used alongside a downward zigzag, which is misleading. This is not a bullish structure — it's a bearish continuation pattern or possibly a bear flag, which suggests further downside.
Using “Bullish” here may confuse traders into thinking a reversal is expected, while the actual trend favors further decline.
2. No Confirmed Reversal Pattern:
There's no double bottom, inverse head and shoulders, or any bullish candlestick formation (e.g., engulfing or hammer) to indicate a likely bullish reversal.
Without strong reversal signals, expecting a bullish move here lacks technical support.
3. Target Box Ambiguity:
The “Target” box is not clearly justified. There are no Fibonacci levels, previous support zones, or measured move explanations backing it.
A target should be based on a technical level — such as the bottom of a previous range, a support zone, or a projection from a pattern.

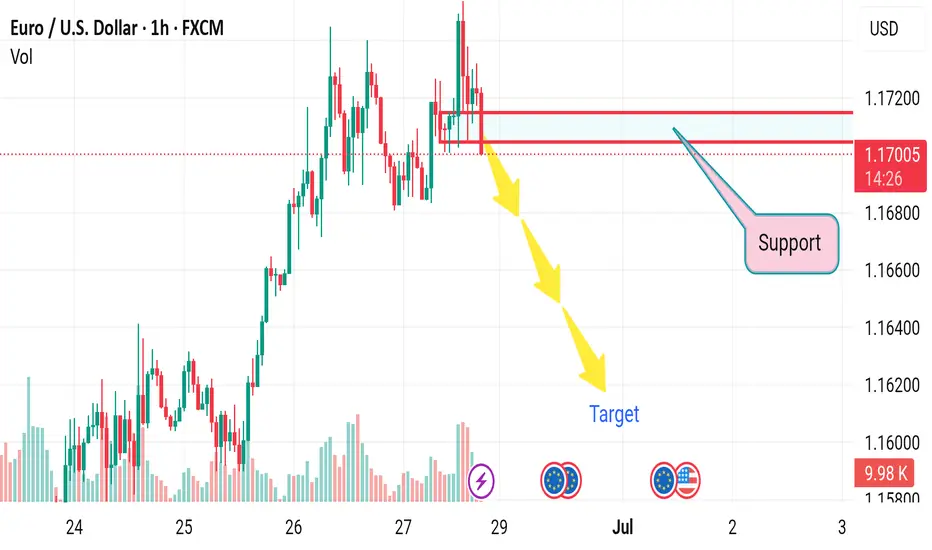
Market next target 🔍 Disruption Analysis of the EUR/USD Chart
1. "Support" Label Positioned at the Current Price Level
Disruption: The chart marks 1.1705 as “Support,” but price is sitting directly on or slightly above it.
Challenge: If price is already breaking through or hovering at support without bouncing, it’s a sign of weakness — this zone may no longer be valid as support.
✅ Correction: Re-label this area as “Potential Resistance” if a breakdown confirms.
---
2. Directional Bias Assumes Continuation Without Confirmation
Disruption: Three yellow arrows indicate a bearish continuation, yet no bearish candlestick pattern, volume spike, or break-close-below-support has been confirmed.
Challenge: This is a premature projection that lacks price action validation.
✅ Correction: Wait for a confirmed candle close below 1.1700 with increased volume to validate the move.
---
3. Volume Ignored Despite Clear Clues
Disruption: There is rising volume during the move down near support — this could indicate either strong selling or smart money accumulation.
Challenge: Volume analysis is completely overlooked, missing a critical layer of confirmation.
✅ Correction: Analyze the volume spike on the red candles; if followed by weak follow-through, a bullish reversal may be setting up instead
Market next move 🔍 Disruptive Analysis of the Original Chart
1. Labeling Conflict: "Bullish" with Bearish Arrow
Disruption: The term "Bullish" is written, yet the arrow clearly shows a downward movement. This is contradictory.
Challenge: A downward movement typically suggests bearish sentiment. Either the label is incorrect, or the directional analysis is flawed.
2. Support/Resistance Confusion
Disruption:
The chart shows "Support" at around 36.15 but labels the zone below it as "Target" and "Resistance", which is illogical.
Resistance should be above the current price; support below.
Challenge: It appears that the analyst has inverted the traditional roles of support and resistance.
3. Unclear Volume Interpretation
Disruption: The volume at the bottom is not analyzed or discussed. Yet volume spikes correlate with high selling pressure near resistance.
Challenge: Without volume context, predicting price movement is speculative.
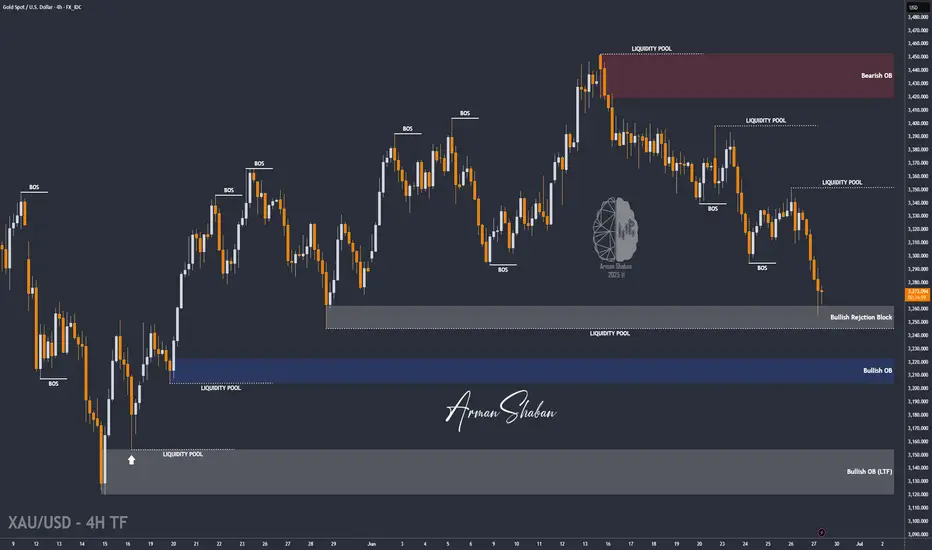
XAUUSD : Ready for More Upside Before Another Fall ?By analyzing the gold chart on the 4-hour timeframe, we can see that price initially followed our bullish scenario, climbing 140 pips up to $3336. However, after hitting that level, gold reversed and entered the bearish scenario, dropping below $3300 and eventually finding support around $3255.
This area acted as a strong demand zone, and we’ve since seen a rebound. Currently, gold is trading around $3273, and as long as price holds above the marked demand zone (Bullish Rejection Block), we may expect another bullish move before price potentially targets the liquidity below $3245 and $3203.
Please support me with your likes and comments to motivate me to share more analysis with you and share your opinion about the possible trend of this chart with me !
Best Regards , Arman Shaban
Retest of New Highs and Pullback Zone✨ By MJTrading:
Chart Overview:
AUDUSD reached a 2025 new high around 0.65600 before pulling back sharply. Price broke out of a consolidation wedge and is now retesting the prior breakout and dynamic support area.
🔹 Key Points:
Structure: Clear impulse move to new highs, followed by corrective pullback.
Support Zone: Blue box ~0.6480–0.6500 could act as a demand area if price extends lower.
EMAs: Price testing the 60 EMA (~0.6523) after losing short-term momentum.
Trade Setup:
Entry: 0.65250
SL: 0.65510
TP1: 0.65000
(Please Manage your Risk)( Ideal: 1% Per Trade)
Possible Scenarios:
Bullish reaction from current EMA support or the blue demand zone.
Deeper retracement if price fails to hold above 0.6500.
💡 Note:
This chart highlights how prior consolidation and breakout zones can offer potential retest entries in trending markets.
Thanks for your time an attention...
Follow for more setups.
#MJTrading
#AUDUSD #Forex #TechnicalAnalysis #PriceAction #BreakoutTrading #SupportResistance #TradingView #FX

SELL: USDJPY 144.75 Trade Recommendation – 1H Chart🎯 Trade Setup:
Sell Entry Zone: 144.75 – 144.78
Stop Loss (SL): 145.15
Take Profit (TP): 142.60
Risk:Reward Ratio (R:R): Approx. 1:4 → Excellent for swing or intraday setups
📊 Technical Analysis Breakdown:
1. Strong Resistance Zone – High Reversal Probability:
The 144.75–144.78 zone:
A clear historical resistance area with multiple rejections in the past
Converges with the SMA 89 (red line) → acts as a strong dynamic resistance
Price has consistently formed lower highs around this region → showing selling pressure is building
2. Volume Analysis – Distribution Signals:
Volume slightly increased as price approached the resistance but did not accompany a breakout
No “breakout volume” → Indicates possible distribution phase, not accumulation → Favoring SELL positions
3. Price Action & Pattern:
The structure is forming lower highs – a key sign of bearish momentum
After the sharp rejection from the 145.22 zone (June 26), the market has shifted toward a bearish correction cycle
4. Target Area – Key Support:
142.60 is a well-defined support level:
Matches a previous major low
Corresponds with a high-liquidity zone from prior trading sessions
Ideal area to take profit before any potential bounce
⚠️ Risk Management Notes:
Trade confirmation increases if you see bearish candlestick signals (e.g., bearish engulfing, pin bar) in the entry zone
Exit immediately if price breaks and closes above 145.15 with strong volume – that invalidates the bearish setup
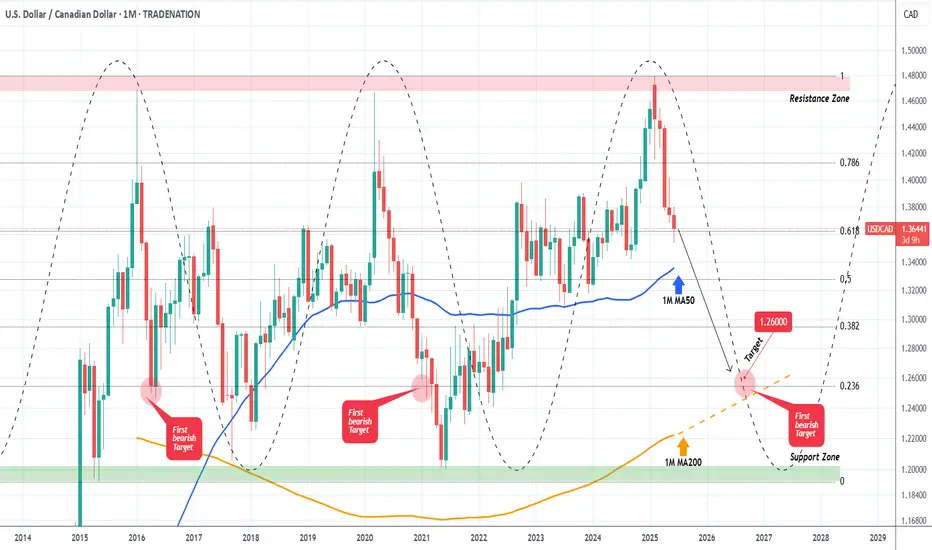
USDCAD Strongest long-term Sell in the market right now.At the beginning of the year (January 15, see chart below), we made an unpopular bearish call at the time, hinting that the USDCAD pair was approaching its Resistance Zone, hence a multi-year Top was in order:
As you can see, the moment the price hit that Resistance Zone, it got instantly rejected and a new Bearish Leg started, which has extended up to this day. This time we view this on the 1M time-frame where the Support levels are more clearly illustrated.
More particularly, the 1M MA50 (blue trend-line) poses as the first one, in fact it has been holding since September 2022. Our Target is still located at 1.26000, which is marginally above the 0236 Fibonacci level, which has been the 1st Target during both previous Bearish Legs. Also it is where the 1M MA200 (orange trend-line) is headed to, and there are high chances of a long-term bounce there.
-------------------------------------------------------------------------------
** Please LIKE 👍, FOLLOW ✅, SHARE 🙌 and COMMENT ✍ if you enjoy this idea! Also share your ideas and charts in the comments section below! This is best way to keep it relevant, support us, keep the content here free and allow the idea to reach as many people as possible. **
-------------------------------------------------------------------------------
Disclosure: I am part of Trade Nation's Influencer program and receive a monthly fee for using their TradingView charts in my analysis.
💸💸💸💸💸💸
👇 👇 👇 👇 👇 👇
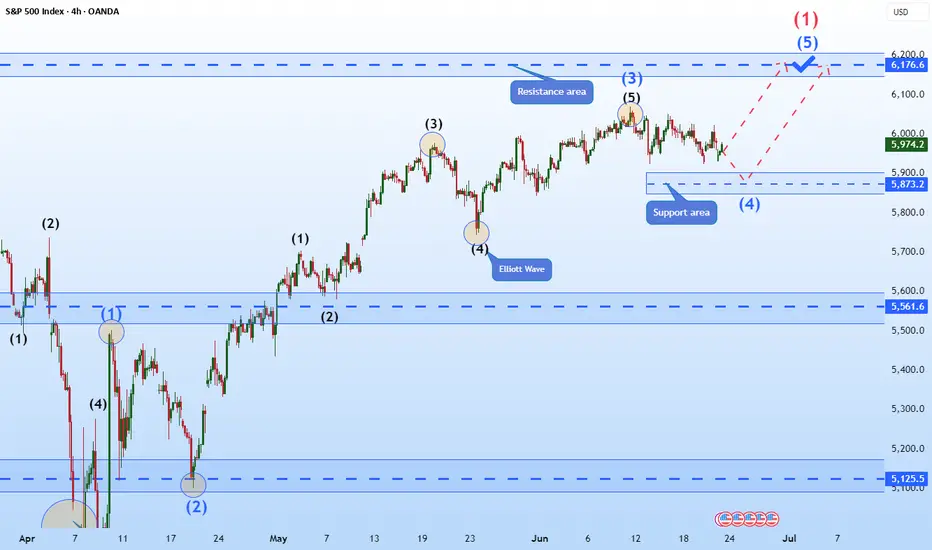
Hellena | SPX500 (4H): LONG resistance area of 6176 (Wave 1).Colleagues, the previous forecast remains essentially unchanged, and the target is still 6176, but I think the forecast can be updated because the price has been flat for quite some time.
I still expect the upward movement to continue in the large wave “1” and in the medium-order wave “5”.
A small correction to the support area of 5873 is possible.
Manage your capital correctly and competently! Only enter trades based on reliable patterns!
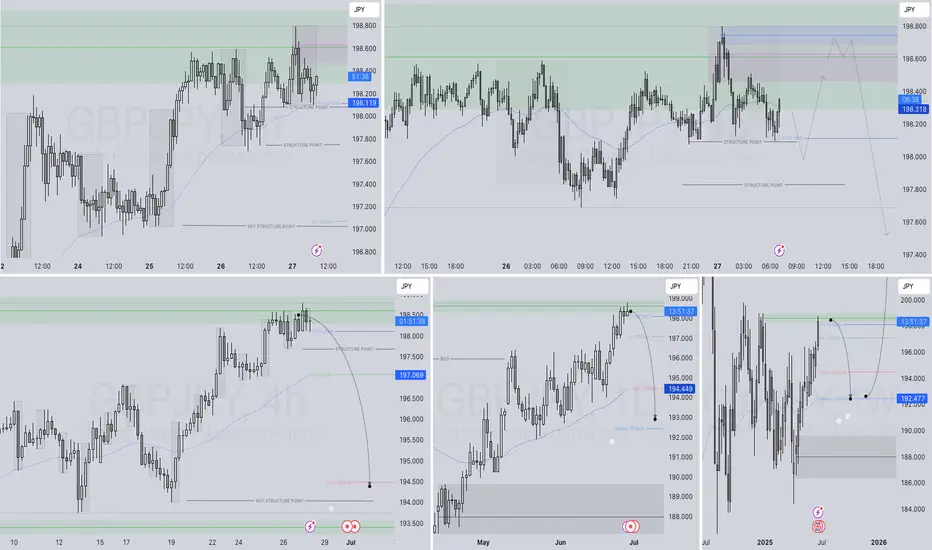
GBPJPY SHORT FORECAST Q2 W26 D27 Y25GBPJPY SHORT FORECAST Q2 W26 D27 Y25
Professional Risk Managers
Welcome back to another FRGNT chart update
Diving into some Forex setups using predominantly higher time frame order blocks alongside confirmation breaks of structure.
Let’s see what price action is telling us today
Here are some trade confluences
Weekly Order Block Identified
Daily Order block identified
4H Order Block identified
15' Order block identified
Remember, to participate in trading comes always with a degree of risk, therefore as professional risk managers it remains vital that we stick to our risk management plan as well as our trading strategies.
The rest, we leave to the balance of probabilities.
Fail to plan. Plan to fail.
It has always been that simple.
Good luck with your trading journey, I shall see you at the very top.
Trade consistent, FRGNT X
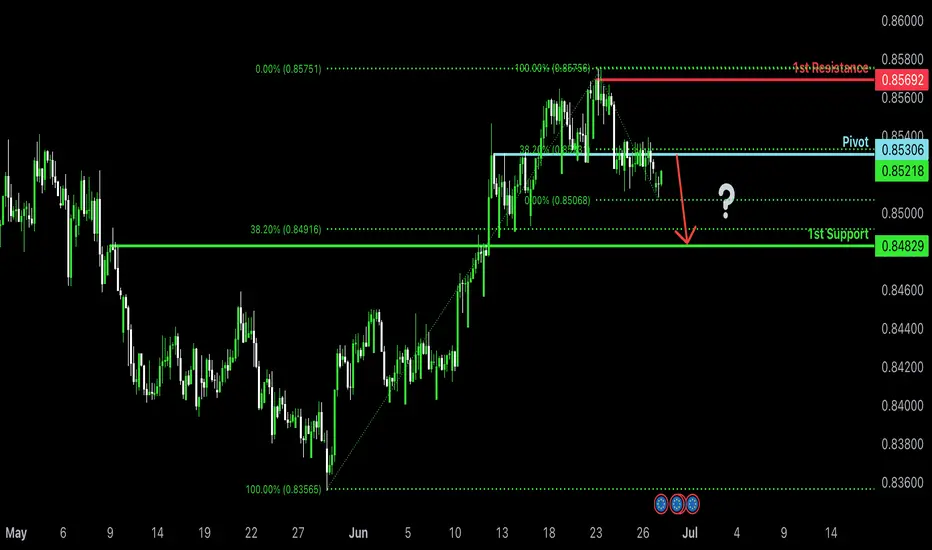
Bearish drop?EUR/GBP is rising towards the pivot that aligns with the 38.2% Fibonacci retracement and could drop to the 1st support.
Pivot: 0.8530
1st Support: 0.8482
1st Resistance: 0.8569
Risk Warning:
Trading Forex and CFDs carries a high level of risk to your capital and you should only trade with money you can afford to lose. Trading Forex and CFDs may not be suitable for all investors, so please ensure that you fully understand the risks involved and seek independent advice if necessary.
Disclaimer:
The above opinions given constitute general market commentary, and do not constitute the opinion or advice of IC Markets or any form of personal or investment advice.
Any opinions, news, research, analyses, prices, other information, or links to third-party sites contained on this website are provided on an "as-is" basis, are intended only to be informative, is not an advice nor a recommendation, nor research, or a record of our trading prices, or an offer of, or solicitation for a transaction in any financial instrument and thus should not be treated as such. The information provided does not involve any specific investment objectives, financial situation and needs of any specific person who may receive it. Please be aware, that past performance is not a reliable indicator of future performance and/or results. Past Performance or Forward-looking scenarios based upon the reasonable beliefs of the third-party provider are not a guarantee of future performance. Actual results may differ materially from those anticipated in forward-looking or past performance statements. IC Markets makes no representation or warranty and assumes no liability as to the accuracy or completeness of the information provided, nor any loss arising from any investment based on a recommendation, forecast or any information supplied by any third-party.