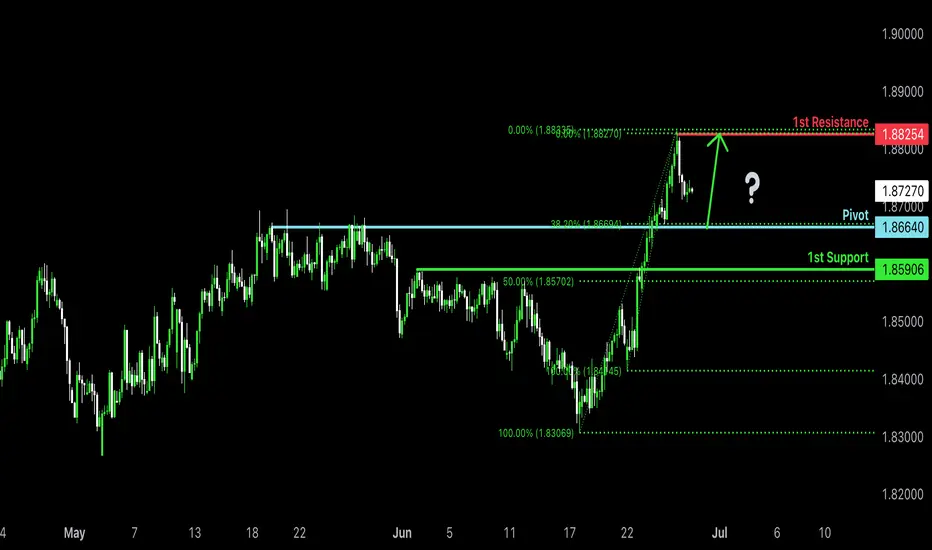
Bullish continuation?GBP/CAD is falling towards the pivot and could bounce to the 1st resistance which is a pullback resistance.
Pivot: 1.8664
1st Support: 1.8590
1st Resistance: 1.8825
Risk Warning:
Trading Forex and CFDs carries a high level of risk to your capital and you should only trade with money you can afford to lose. Trading Forex and CFDs may not be suitable for all investors, so please ensure that you fully understand the risks involved and seek independent advice if necessary.
Disclaimer:
The above opinions given constitute general market commentary, and do not constitute the opinion or advice of IC Markets or any form of personal or investment advice.
Any opinions, news, research, analyses, prices, other information, or links to third-party sites contained on this website are provided on an "as-is" basis, are intended only to be informative, is not an advice nor a recommendation, nor research, or a record of our trading prices, or an offer of, or solicitation for a transaction in any financial instrument and thus should not be treated as such. The information provided does not involve any specific investment objectives, financial situation and needs of any specific person who may receive it. Please be aware, that past performance is not a reliable indicator of future performance and/or results. Past Performance or Forward-looking scenarios based upon the reasonable beliefs of the third-party provider are not a guarantee of future performance. Actual results may differ materially from those anticipated in forward-looking or past performance statements. IC Markets makes no representation or warranty and assumes no liability as to the accuracy or completeness of the information provided, nor any loss arising from any investment based on a recommendation, forecast or any information supplied by any third-party.
Forexsignals
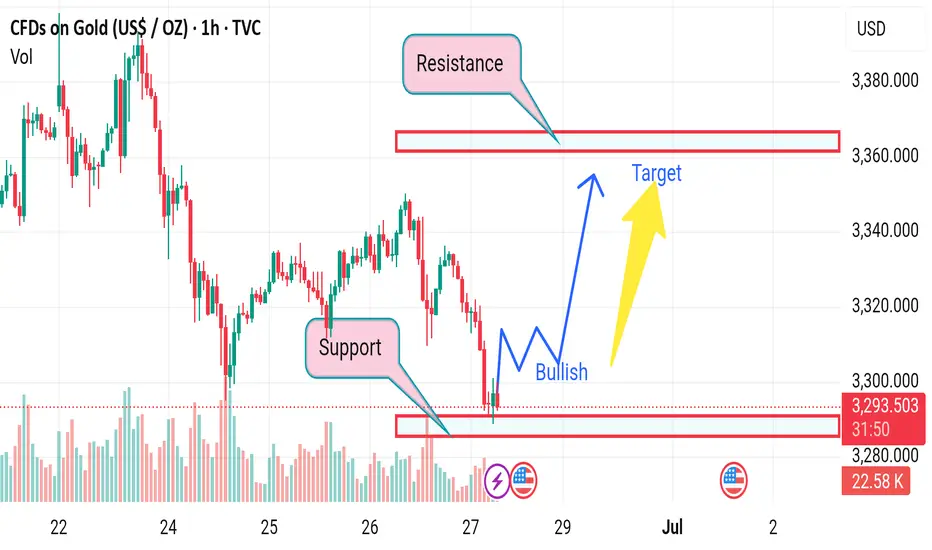
Market next move 🔍 Disrupting the Original Bullish Bias
The original analysis assumes a bullish reversal from the support zone aiming for a resistance target near $3,360. However, let’s challenge that with an alternate (bearish or neutral) perspective:
---
⚠️ 1. Support May Not Hold
Price has tested the support zone multiple times, increasing the probability of a breakdown.
Repeated testing weakens support levels; a breakdown below $3,280 could trigger panic selling or stop-loss hunts, accelerating the drop.
---
📉 2. Bearish Momentum is Dominant
The overall trend is downward, with lower highs and lower lows.
The current bounce could be a dead cat bounce — a short-lived recovery before another drop.
---
📊 3. Volume Analysis
There's no significant bullish volume spike at the support, which weakens the bullish thesis.
This suggests lack of strong buying interest, a red flag for bullish continuation.
---
🔄 4. Resistance May Hold Strong
The resistance area around $3,360 has shown previous strong rejections.
Even if price rises, it could stall or reverse before reaching the target.
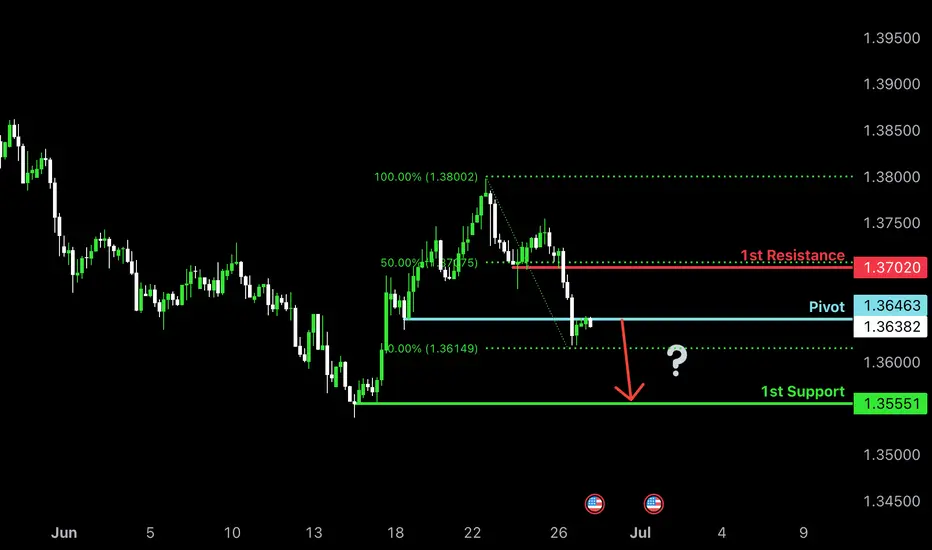
Bearish drop off pullback resistance?USD/CAD is reacting off the pivot which is a pullback resistance and could drop to the 1st support which acts as a pullback support.
Pivot: 1.3646
1st Support: 1.3555
1st Resistance: 1.3702
Risk Warning:
Trading Forex and CFDs carries a high level of risk to your capital and you should only trade with money you can afford to lose. Trading Forex and CFDs may not be suitable for all investors, so please ensure that you fully understand the risks involved and seek independent advice if necessary.
Disclaimer:
The above opinions given constitute general market commentary, and do not constitute the opinion or advice of IC Markets or any form of personal or investment advice.
Any opinions, news, research, analyses, prices, other information, or links to third-party sites contained on this website are provided on an "as-is" basis, are intended only to be informative, is not an advice nor a recommendation, nor research, or a record of our trading prices, or an offer of, or solicitation for a transaction in any financial instrument and thus should not be treated as such. The information provided does not involve any specific investment objectives, financial situation and needs of any specific person who may receive it. Please be aware, that past performance is not a reliable indicator of future performance and/or results. Past Performance or Forward-looking scenarios based upon the reasonable beliefs of the third-party provider are not a guarantee of future performance. Actual results may differ materially from those anticipated in forward-looking or past performance statements. IC Markets makes no representation or warranty and assumes no liability as to the accuracy or completeness of the information provided, nor any loss arising from any investment based on a recommendation, forecast or any information supplied by any third-party.
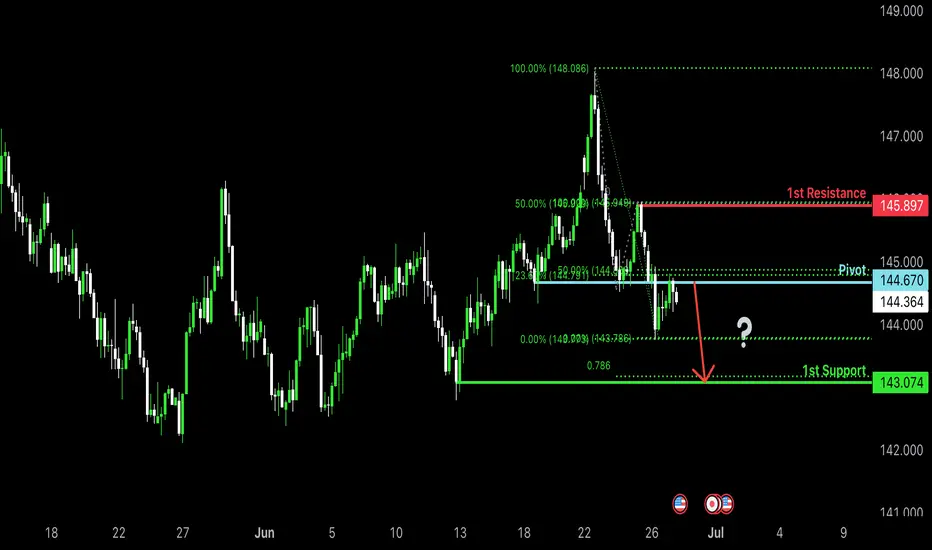
Bearish drop?USD/JPY is reacting off te pivot and could drop t the 1st support.
Pivot: 144.67
1st Support: 143.07
1st Resistance: 145.89
Risk Warning:
Trading Forex and CFDs carries a high level of risk to your capital and you should only trade with money you can afford to lose. Trading Forex and CFDs may not be suitable for all investors, so please ensure that you fully understand the risks involved and seek independent advice if necessary.
Disclaimer:
The above opinions given constitute general market commentary, and do not constitute the opinion or advice of IC Markets or any form of personal or investment advice.
Any opinions, news, research, analyses, prices, other information, or links to third-party sites contained on this website are provided on an "as-is" basis, are intended only to be informative, is not an advice nor a recommendation, nor research, or a record of our trading prices, or an offer of, or solicitation for a transaction in any financial instrument and thus should not be treated as such. The information provided does not involve any specific investment objectives, financial situation and needs of any specific person who may receive it. Please be aware, that past performance is not a reliable indicator of future performance and/or results. Past Performance or Forward-looking scenarios based upon the reasonable beliefs of the third-party provider are not a guarantee of future performance. Actual results may differ materially from those anticipated in forward-looking or past performance statements. IC Markets makes no representation or warranty and assumes no liability as to the accuracy or completeness of the information provided, nor any loss arising from any investment based on a recommendation, forecast or any information supplied by any third-party.
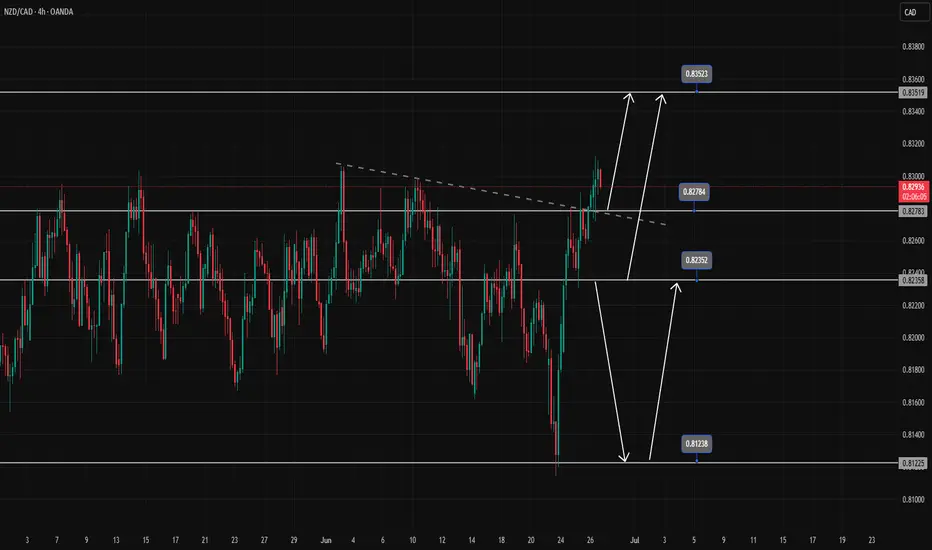
Is the NZDCAD uptrend still strong?NZDCAD has broken the trendline structure and is heading towards the resistance at 0.83500
0.827 has become a confluence of support and trendline. The pair is looking for more buying momentum at the support zone.
2 zones to watch are 0.827 and 0.823
If the 0.823 zone is broken, the uptrend is broken and the market turns to a downtrend. The target of the downtrend and the market finds the bottom of last month around 0.812.
Confirm SELL signal when breaking 0.823
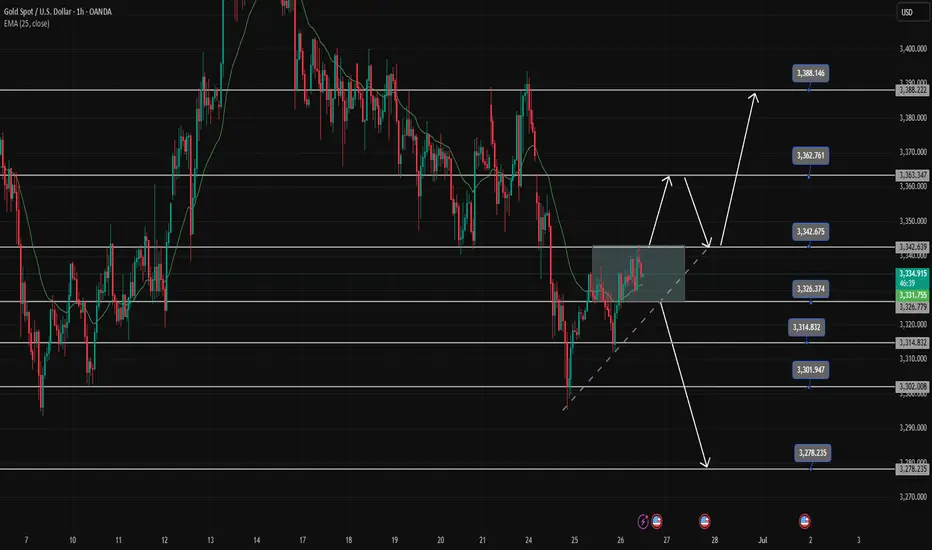
Gold Trading Strategy June 26✏️ D1 candle shows a recovery but not significantly. Gold is currently reacting at the key resistance zone of 3342.
The immediate support zone that the price is heading toward is 3326. This forms a breakout range between 3326 and 3342.
A bullish channel may form if there is a strong price reaction at 3326. Conversely, if 3326 is broken, it could confirm a continuation of the downtrend targeting 3302 during the European and US sessions today. The bearish target could even extend to 3278.
📈 Key Levels
Breakout Range: 3326 - 3342
Support: 3326 - 3314 - 3302 - 3278
Resistance: 3342 - 3363 - 3388
📊 Recommended Trade Setups
BUY: 3302–3300 | SL: 3297
SELL: 3363–3365 | SL: 3369
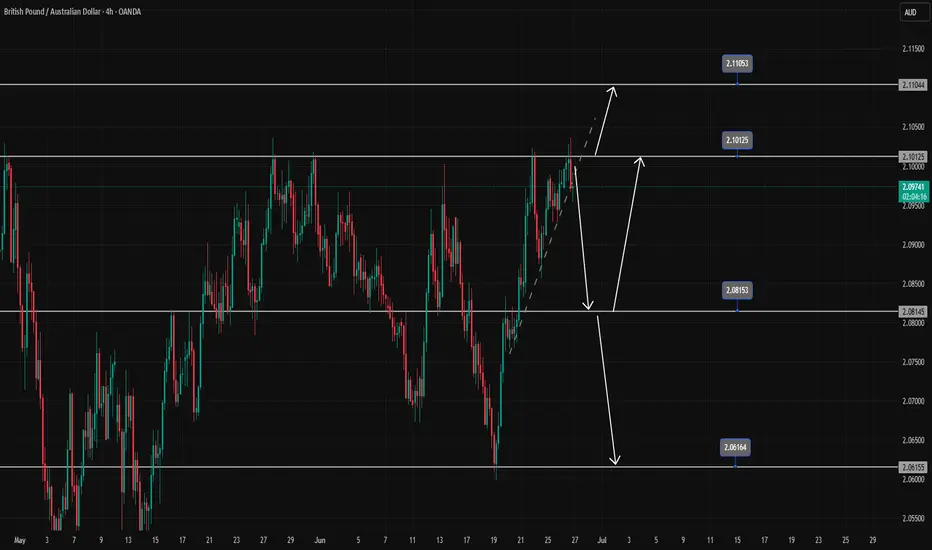
GBPAUD Refuses to Make New Weekly HighsFailed to trade above the resistance zone of 2.101
Currently, the weak reaction at the trendline suggests that it will be difficult for the pair to push higher.
If the trendline breaks, the downtrend may extend toward 2.08100 — a level where buyers are likely to step back into the market.
We are waiting for further price action around the 2.081 support zone to look for new trade signals.
If this level is broken, 2.061 will become the next target for all SELL positions.
On the contrary, if the price bounces from 2.081, strong buying momentum could emerge and potentially break through the 2.101 resistance, targeting 2.110.
take profit smashedlast post highlighted the buy i was on and now target 🎯 has been smashed. Seeing more opportunities on both buy and sell

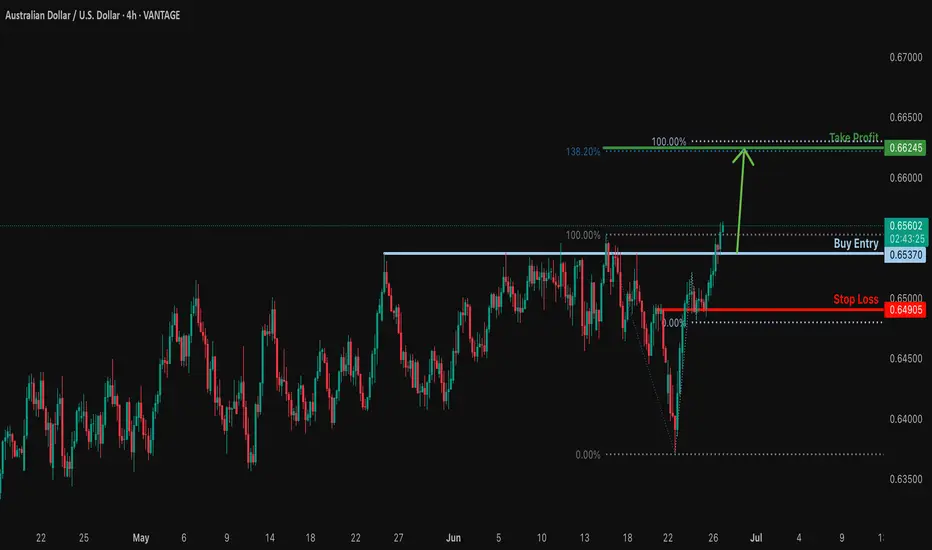
Potential bullish rise?AUD/USD is reacting off the resistance level which is a pullback resistance and could rise from this level to our take profit.
Entry: 0.6537
Why we like it:
There is a pullback resistance level.
Stop loss: 0.6490
Why we like it:
There is an overlap support level.
Take profit: 0.6624
Why we like it:
There is a resistance level that aligns with the 138.2% Fibonacci extension and the 100% Fibonacci projection.
Enjoying your TradingView experience? Review us!
Please be advised that the information presented on TradingView is provided to Vantage (‘Vantage Global Limited’, ‘we’) by a third-party provider (‘Everest Fortune Group’). Please be reminded that you are solely responsible for the trading decisions on your account. There is a very high degree of risk involved in trading. Any information and/or content is intended entirely for research, educational and informational purposes only and does not constitute investment or consultation advice or investment strategy. The information is not tailored to the investment needs of any specific person and therefore does not involve a consideration of any of the investment objectives, financial situation or needs of any viewer that may receive it. Kindly also note that past performance is not a reliable indicator of future results. Actual results may differ materially from those anticipated in forward-looking or past performance statements. We assume no liability as to the accuracy or completeness of any of the information and/or content provided herein and the Company cannot be held responsible for any omission, mistake nor for any loss or damage including without limitation to any loss of profit which may arise from reliance on any information supplied by Everest Fortune Group.
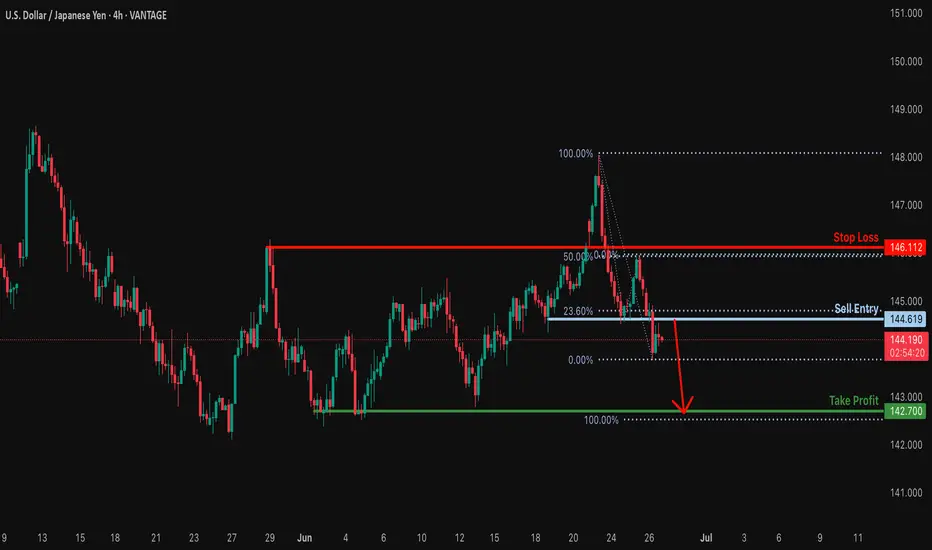
Bearish drop off pullback resistance?USD/JPY is rising towards the resistance level which is a pullback resistance that lines up with the 23.6% Fibonacci retracement and could drop from this level to our take profit.
Entry: 144.61
Why we like it:
There is a pullback resistance level that aligns with the 23.6% Fibonacci retracement.
Stop loss: 146.11
Why we like it:
There is a pullback resistance level that aligns with the 50% Fibonacci retracement.
Take profit: 142.70
Why we like it:
There is a pullback support level that aligns with the 100% Fibonacci projection.
Enjoying your TradingView experience? Review us!
Please be advised that the information presented on TradingView is provided to Vantage (‘Vantage Global Limited’, ‘we’) by a third-party provider (‘Everest Fortune Group’). Please be reminded that you are solely responsible for the trading decisions on your account. There is a very high degree of risk involved in trading. Any information and/or content is intended entirely for research, educational and informational purposes only and does not constitute investment or consultation advice or investment strategy. The information is not tailored to the investment needs of any specific person and therefore does not involve a consideration of any of the investment objectives, financial situation or needs of any viewer that may receive it. Kindly also note that past performance is not a reliable indicator of future results. Actual results may differ materially from those anticipated in forward-looking or past performance statements. We assume no liability as to the accuracy or completeness of any of the information and/or content provided herein and the Company cannot be held responsible for any omission, mistake nor for any loss or damage including without limitation to any loss of profit which may arise from reliance on any information supplied by Everest Fortune Group.
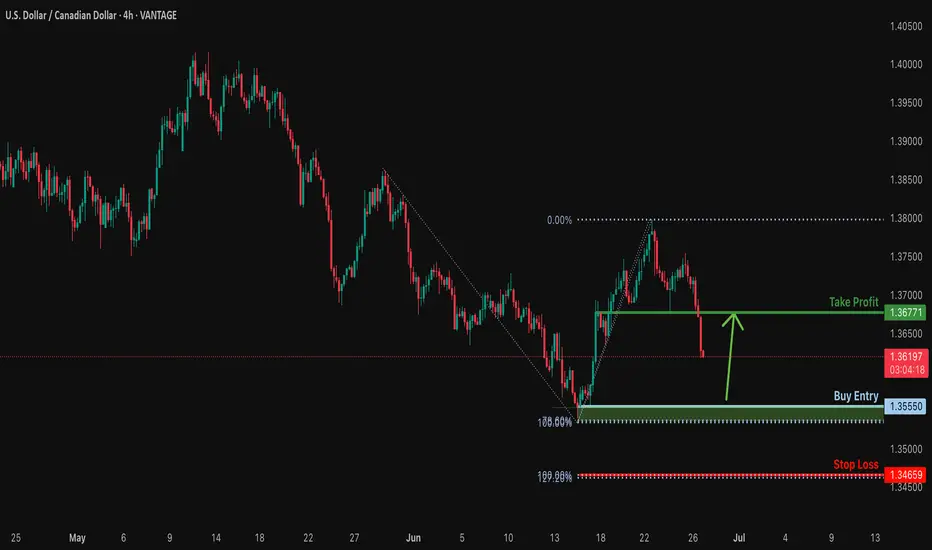
Bullish reversal?USD/CAD is falling towards a support level, which acts as a pullback support just above the 78.6% Fibonacci projection. A bounce from this level could indicate the formation of a double bottom pattern, potentially leading to a price rise toward our take profit target.
Entry: 1.3555
Why we like it:
There is a pullback support levle.
Stop loss: 1.3465
Why we like it:
There is a support level that lines up with the 127.2% Fibonacci extension and the 100% Fibonacci projection.
Take profit: 1.3677
Why we like it:
There is a pullback resistance.
Enjoying your TradingView experience? Review us!
Please be advised that the information presented on TradingView is provided to Vantage (‘Vantage Global Limited’, ‘we’) by a third-party provider (‘Everest Fortune Group’). Please be reminded that you are solely responsible for the trading decisions on your account. There is a very high degree of risk involved in trading. Any information and/or content is intended entirely for research, educational and informational purposes only and does not constitute investment or consultation advice or investment strategy. The information is not tailored to the investment needs of any specific person and therefore does not involve a consideration of any of the investment objectives, financial situation or needs of any viewer that may receive it. Kindly also note that past performance is not a reliable indicator of future results. Actual results may differ materially from those anticipated in forward-looking or past performance statements. We assume no liability as to the accuracy or completeness of any of the information and/or content provided herein and the Company cannot be held responsible for any omission, mistake nor for any loss or damage including without limitation to any loss of profit which may arise from reliance on any information supplied by Everest Fortune Group.
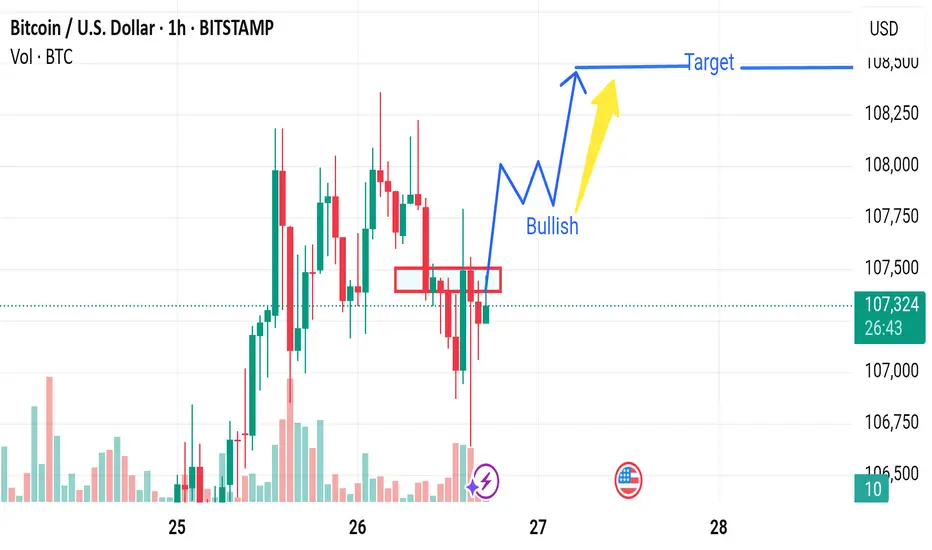
Market next target 📉 Disruption: Bearish Outlook Contradiction
1. Resistance Zone Rejection:
The price action is repeatedly failing near the 107,800–108,000 resistance zone.
The chart shows several long upper wicks, indicating strong selling pressure when BTC tries to move higher.
2. False Breakout Risk:
The recent bullish candle with a long lower wick could be a bull trap—designed to lure buyers before a reversal.
Price may retest the red box (support turned resistance) and fail to hold above it.
3. Volume Analysis:
Despite a small recovery, volume is not increasing significantly, which is not typical of a strong bullish move.
A lack of strong buyer volume could indicate exhaustion.
4. Lower High Structure:
The chart is still forming lower highs, a sign of a downtrend continuation unless it breaks above 108,000 convincingly.
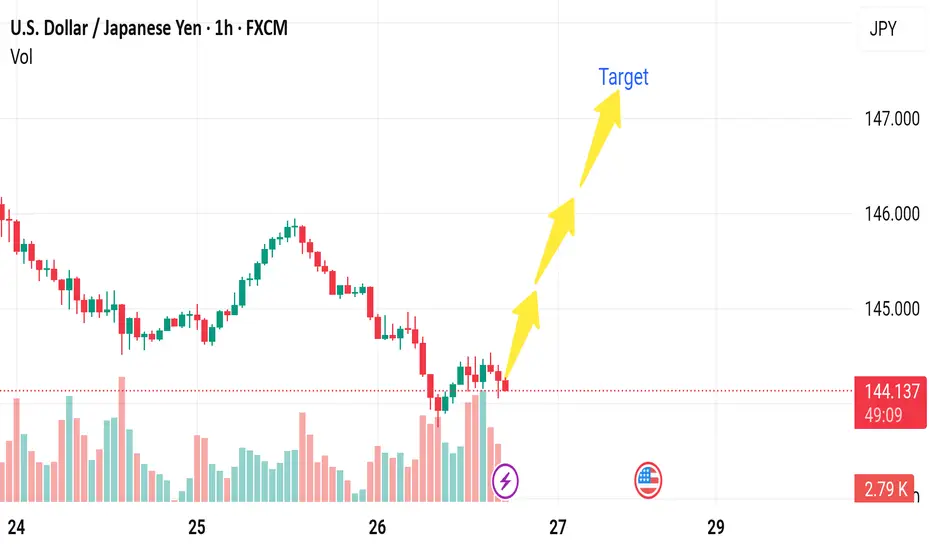
Market next move Disruption of the Bullish USD/JPY Analysis
1. Weak Bullish Momentum
The current bullish attempt is showing small-bodied candles with low follow-through.
Disruption: This suggests a lack of conviction from buyers. If there’s no strong bounce soon, it could indicate distribution rather than accumulation.
2. Volume Imbalance
Notice the recent spike in bearish volume (red bars), especially during the last price drop.
Disruption: Volume is supporting the downtrend, not the rebound. This suggests sellers are still in control.
3. Lower High Structure
The price recently failed to form a higher high and continues forming lower highs and lower lows.
Disruption: This pattern is a classic sign of a continuing bearish trend, contradicting the bullish target.
4. Fundamental Headwinds
The U.S. economic icon (flag) suggests an upcoming high-impact event — likely NFP, GDP, or rate decision.
Disruption: If U.S. data is weak or if there's talk of the Fed pausing rate hikes, USD could weaken, pushing USD/JPY further below 144.000.
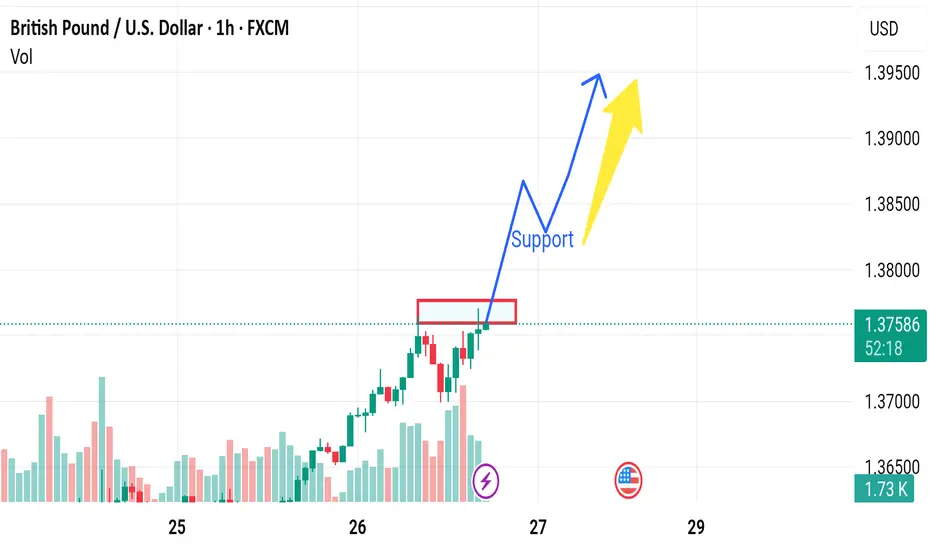
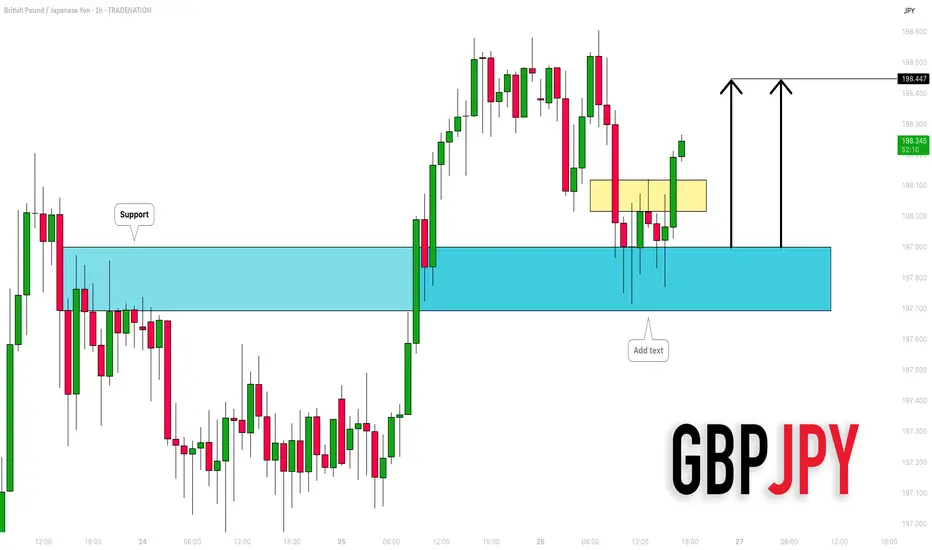
Market next target 🔁 Disruption of the Current Bullish Analysis
1. Resistance Rejection Likelihood
The chart suggests a breakout above resistance will turn the red box into support.
Disruption: The price is currently at a key resistance zone, and multiple rejections in this area previously suggest selling pressure.
We could see a double top formation or a false breakout trapping bulls.
Look for wicks or long upper shadows indicating weakness.
2. Volume Divergence
Recent bullish candles show declining or inconsistent volume.
Disruption: A strong bullish breakout requires rising volume. If volume doesn't confirm price action, this move may lack conviction and reverse sharply.
3. Overbought Conditions
After a strong uptrend, RSI or Stochastic indicators (not shown, but implied) could be entering overbought territory.
Disruption: This suggests limited upside and a potential for mean reversion or correction.
4. Bearish Candlestick Pattern Watch
Watch closely for a bearish engulfing, shooting star, or evening star at this resistance zone.
Disruption: Any bearish reversal pattern here would strongly contradict the bullish breakout thesis.
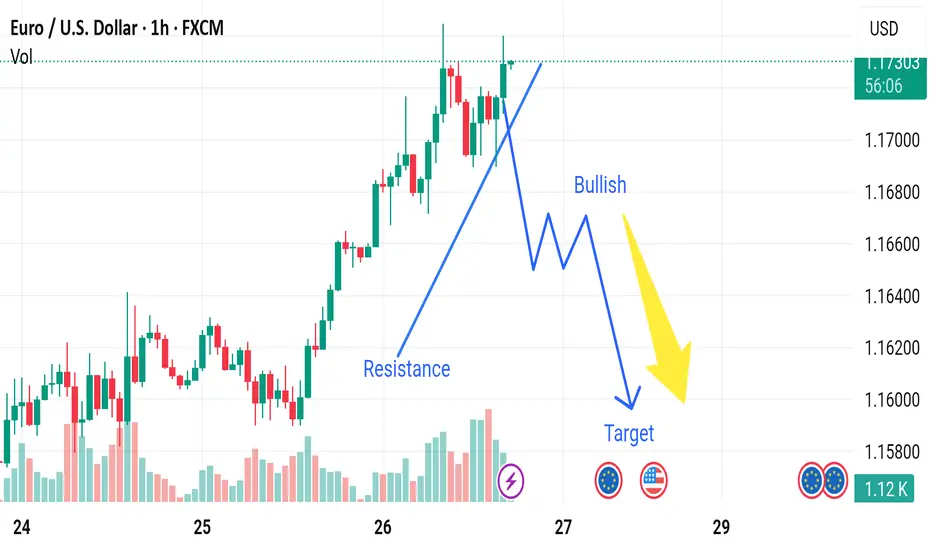
Market next move
🔁 Disruption of the Current Analysis
1. False Breakout Scenario
The chart assumes a bullish move breaking resistance before a bearish reversal.
Disruption: This could be a false breakout, where the price appears to break above resistance but lacks strong volume and momentum. Traders get trapped long, and the price quickly reverses below resistance, invalidating the bullish leg entirely.
2. Stronger Uptrend Continuation
Despite calling for a bearish target, the overall trend appears strong with higher highs and higher lows.
Disruption: Instead of a retracement, EUR/USD could break through the resistance zone convincingly, possibly reaching 1.1750–1.1800, supported by:
Increasing volume
Bullish candles closing above resistance
No signs of bearish divergence on RSI/MACD (if added)
3. Fundamental Factors
The chart ignores macro data.
Disruption: If upcoming EU economic data is stronger than expected, or if US data disappoints, the euro could strengthen further.
Upcoming events with the euro and US flags suggest possible volatility.
4. Volume Contradiction
Recent bullish candles are supported by strong volume, suggesting accumulation.
Disruption: If smart money is accumulating positions, this would support further bullish continuation, not reversal.
#AUDUSD 4H 📉#AUDUSD 4H Sell Setup – Bearish Shift in Play
AUDUSD has tapped into buy-side liquidity at 0.65713, triggering a sharp rejection and signaling a potential Market Structure Reversal (MSR). Price is now approaching a key Order Block (OB) zone, aligning with prevailing bearish order flow.
🔻 Sell Zone: 0.65400 – 0.65000
❌ Stop Loss: Above 0.65713 (Liquidity Level)
🎯 Target: 0.6432
This setup reflects strong rejection from premium pricing and confirmation of bearish momentum. Smart money dynamics suggest a continuation to the downside as price respects resistance and structure.

#XAUUSD #GOLD 30Min 📉📈 #XAUUSD 30m Analysis – Dual Setup Scenario
We’re monitoring two potential trade setups depending on how price reacts at key levels:
🔴 Sell Setup:
Price is entering a Sell-Side Order Block Zone between 3350–3360, aligned with a Fair Value Gap (FVG). This premium zone is likely to act as strong resistance, with potential rejection targeting downside liquidity near 3310 — an ideal area for short positions.
🟢 Buy Setup:
If price sweeps below and taps into the Liquidity Zone / Demand Area around 3305–3311, we’ll watch for a bullish reversal from this discount zone. This area offers a favorable setup for long entries, aligning with institutional buying levels.
📌 Be sure to mark these key zones on your chart for enhanced clarity and execution.
💬 What’s your outlook on Gold? Share your thoughts below 👇

DXY Short-term rebound quite likely.The U.S. Dollar index (DXY) has been trading within almost a 3-year Channel Down, which has assisted us in choosing the right levels to sell high and buy low.
Despite being now on its 2nd major Bearish Leg, we see a short-term bounce possibly up to August quite likely based on the previous major Bearish Leg. As you see, the current setup resembles the April 13 023 Low after which the price rebounded short-term just above the 0.786 Fibonacci level, only to get rejected later and complete the bottom on the 1.1 Fib extension.
Even the 1W RSI sequences between the two fractals are identical. Therefore, before diving below 96.000, we believe a 100.000 test is quite likely.
-------------------------------------------------------------------------------
** Please LIKE 👍, FOLLOW ✅, SHARE 🙌 and COMMENT ✍ if you enjoy this idea! Also share your ideas and charts in the comments section below! This is best way to keep it relevant, support us, keep the content here free and allow the idea to reach as many people as possible. **
-------------------------------------------------------------------------------
💸💸💸💸💸💸
👇 👇 👇 👇 👇 👇

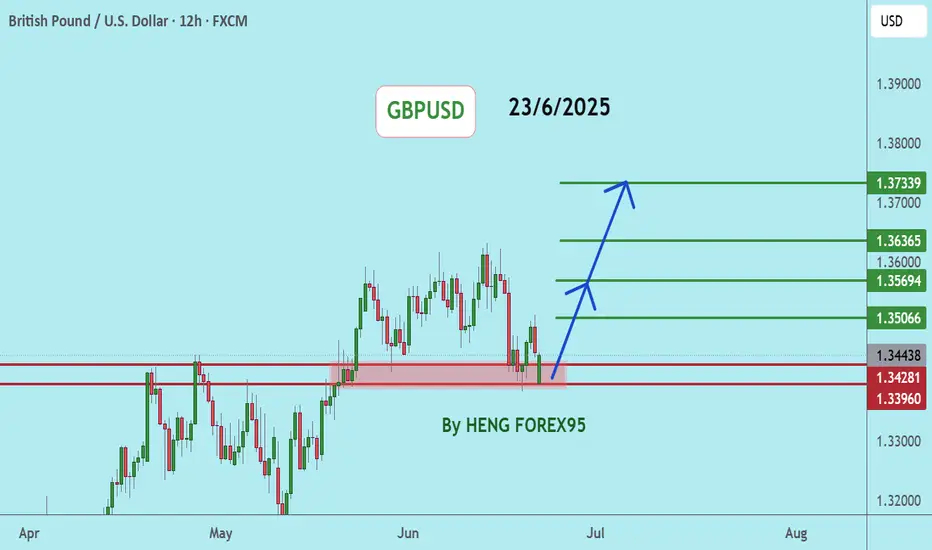
GBPUSDGBPUSD price is near the support zone 1.33917. If the price cannot break through 1.33917, it is expected that the price will have a chance to bounce back. Consider buying in the red zone.
🔥Trading futures, forex, CFDs and stocks carries a risk of loss.
Please consider carefully whether such trading is suitable for you.
>>GooD Luck 😊
❤️ Like and subscribe to never miss a new idea!
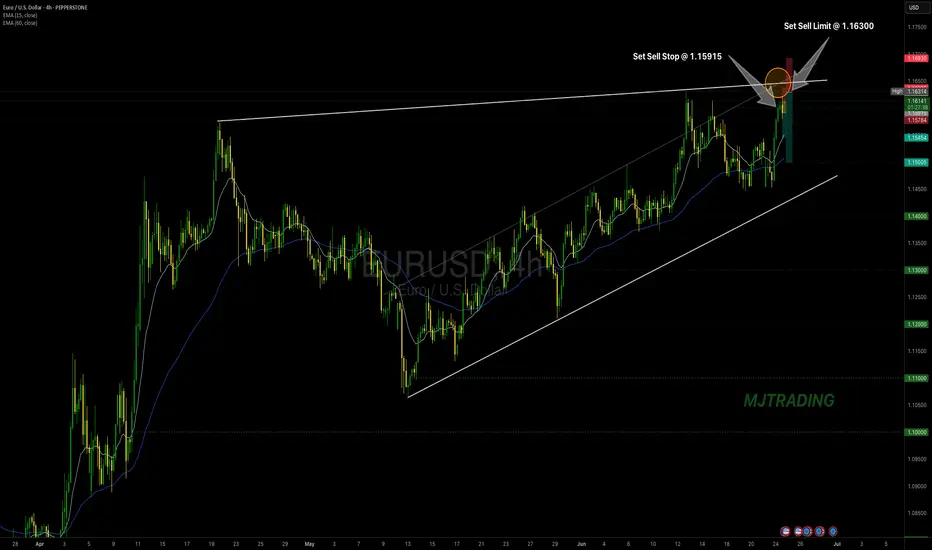
EURUSD Sell SetupBy: MJTrading:
EUR/USD has rallied into a significant resistance zone, approaching the upper boundary of a rising wedge/channel pattern. The price is now hovering around a key confluence zone, where trendline resistance and horizontal supply intersect ( 1.16300 —1.16500 )
There are to possible scenarios:
1) If the price Rejects directly from previous High
🔹 Position 1: Sell Stop @ 1.15915
🛑 Stop Loss: 1.6375
🎯 Take Profit: 1.5454
R/R:1
isk Level: Medium
2) If price tries to reach the boundary of the wedge or make a Fake breakout:
🔹🔹 Position 2: Sell Limit @ 1.16300
🛑 Stop Loss: 1.6930
🎯 Take Profit: 1.5000
R/R:2
Risk Level: Low
📌 This zone offers a high-probability reversal setup
📉 Why it Matters:
Price action shows signs of exhaustion after a parabolic move.
EMA structure is stretched, hinting at a potential pullback.
Lets ZOOM OUT:
Daily Chart:
ZOOM IN:
Stay disciplined, let price come to you, and manage risk.
—
#EURUSD #ForexSetup #TradingStrategy #TechnicalAnalysis #ChartPattern #FXTrading #ShortTrade #MJTrading #BearishReversal #PriceAction #SwingTrade #ForexIdeas #Trendlines #BreakoutOrFakeout #RiskReward
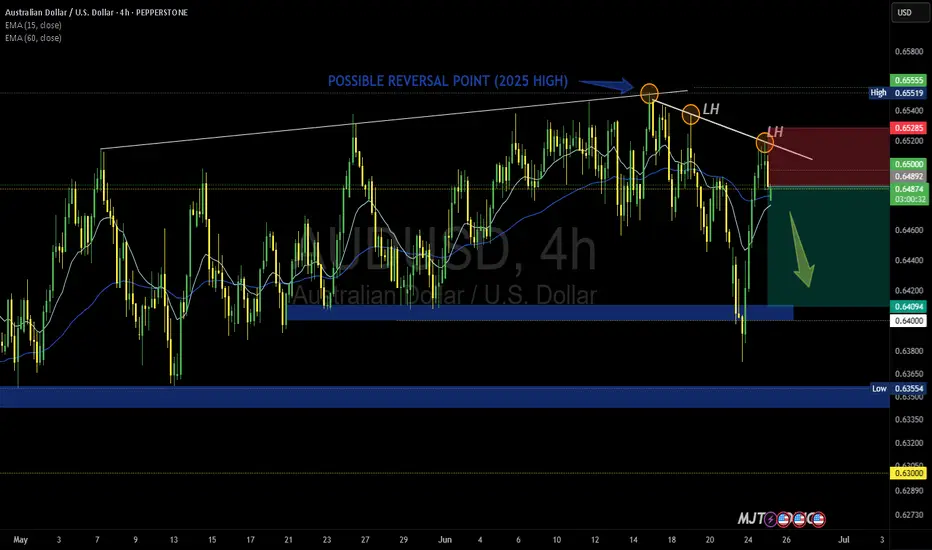
AUD/USD – Rejection at 2025 High?By: MJTrading
📉 AUD/USD – Rejection at 2025 High?
The Aussie is struggling at its 2025 high, printing successive lower highs (LH) and flirting with the 60-period EMA. With momentum leaning bearish, a short opportunity opens up near 0.64878, targeting the 0.64094 support zone. Confirmation from the EMA breakdown and rejection wicks strengthens the setup. Stop-loss above 0.65285 protects against a breakout trap.
Entry: 0.64883
Stop Loss: 0.65285
TP1: 0.64500
TP2: 0.64100
#Hashtags: #AUDUSD #ForexTrading #TechnicalAnalysis #ReversalSetup #BearishBias #LowerHighs #EMARejection #ShortThePop #PriceAction
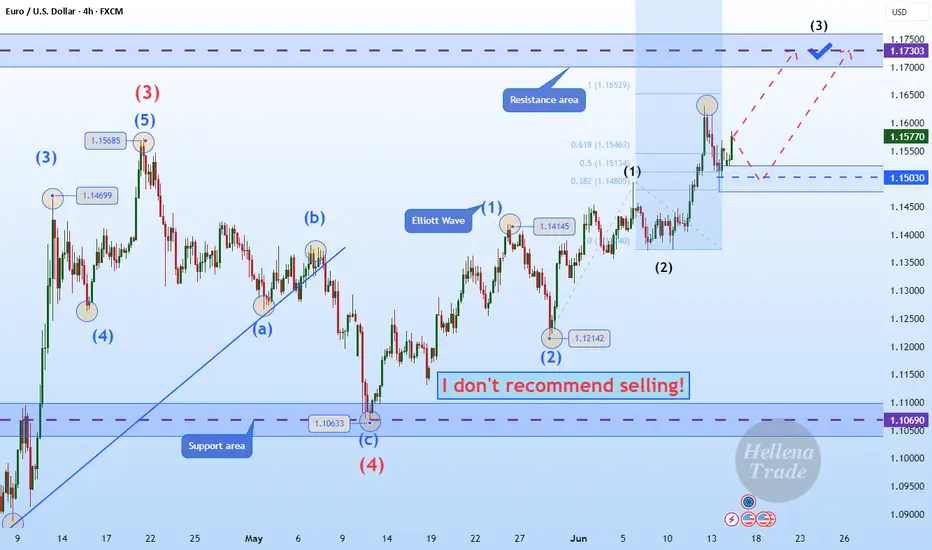
Hellena | EUR/USD (4H): LONG to the resistance area 1.17300.Colleagues, I believe that the upward five-wave impulse is not over yet. At the moment, I see the formation of wave “3” of the lower order and wave “3” of the middle order, which means that the upward movement will continue at least to the resistance area of 1.17300. This area is located between two levels (1.16529-1.18252) of Fibonacci extension.
A correction is possible — be careful.
Manage your capital correctly and competently! Only enter trades based on reliable patterns!