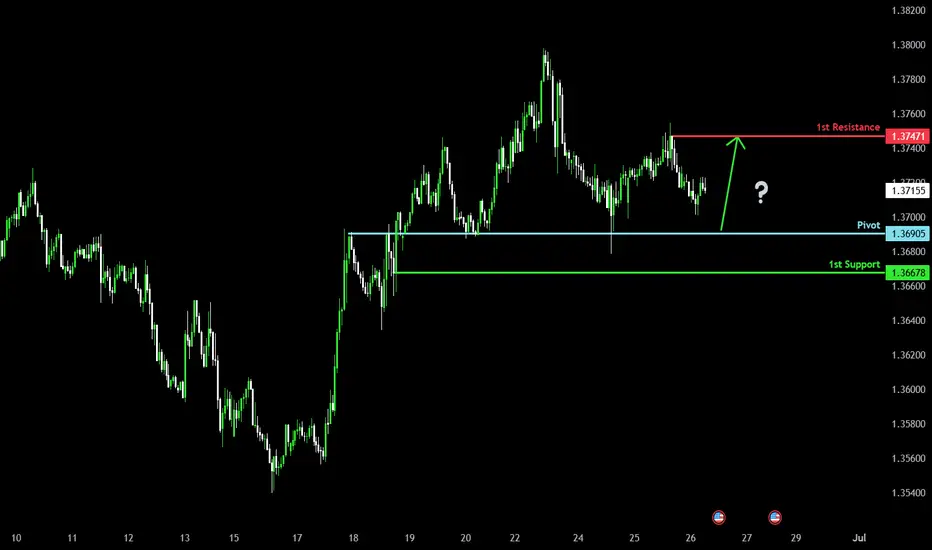
Falling towards major support?The Loonie (USD/CAD) is falling towards the pivot, which has been identified as an overlap support and could bounce to the 1st resistance.
Pivot: 1.3690
1st Support: 1.3667
1st Resistance: 1.3747
Risk Warning:
Trading Forex and CFDs carries a high level of risk to your capital and you should only trade with money you can afford to lose. Trading Forex and CFDs may not be suitable for all investors, so please ensure that you fully understand the risks involved and seek independent advice if necessary.
Disclaimer:
The above opinions given constitute general market commentary, and do not constitute the opinion or advice of IC Markets or any form of personal or investment advice.
Any opinions, news, research, analyses, prices, other information, or links to third-party sites contained on this website are provided on an "as-is" basis, are intended only to be informative, is not an advice nor a recommendation, nor research, or a record of our trading prices, or an offer of, or solicitation for a transaction in any financial instrument and thus should not be treated as such. The information provided does not involve any specific investment objectives, financial situation and needs of any specific person who may receive it. Please be aware, that past performance is not a reliable indicator of future performance and/or results. Past Performance or Forward-looking scenarios based upon the reasonable beliefs of the third-party provider are not a guarantee of future performance. Actual results may differ materially from those anticipated in forward-looking or past performance statements. IC Markets makes no representation or warranty and assumes no liability as to the accuracy or completeness of the information provided, nor any loss arising from any investment based on a recommendation, forecast or any information supplied by any third-party.
Forexsignals
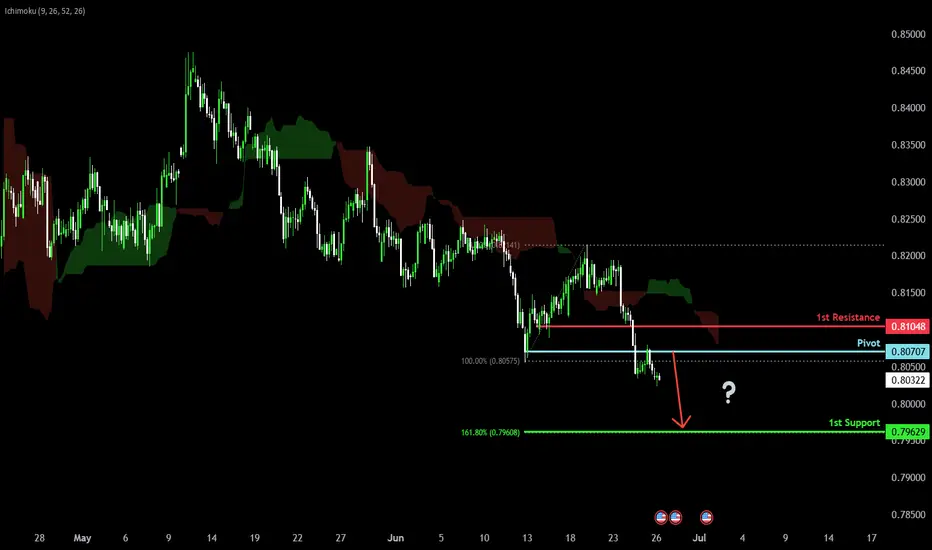
Bearish continuation?The Swissie (USD/CHF) has rejected off the pivot which has been identified as a pullback resistance and could drop to the 1st support.
Pivot: 0.8070
1st Support: 0.7962
1st Resistance: 0.8104
Risk Warning:
Trading Forex and CFDs carries a high level of risk to your capital and you should only trade with money you can afford to lose. Trading Forex and CFDs may not be suitable for all investors, so please ensure that you fully understand the risks involved and seek independent advice if necessary.
Disclaimer:
The above opinions given constitute general market commentary, and do not constitute the opinion or advice of IC Markets or any form of personal or investment advice.
Any opinions, news, research, analyses, prices, other information, or links to third-party sites contained on this website are provided on an "as-is" basis, are intended only to be informative, is not an advice nor a recommendation, nor research, or a record of our trading prices, or an offer of, or solicitation for a transaction in any financial instrument and thus should not be treated as such. The information provided does not involve any specific investment objectives, financial situation and needs of any specific person who may receive it. Please be aware, that past performance is not a reliable indicator of future performance and/or results. Past Performance or Forward-looking scenarios based upon the reasonable beliefs of the third-party provider are not a guarantee of future performance. Actual results may differ materially from those anticipated in forward-looking or past performance statements. IC Markets makes no representation or warranty and assumes no liability as to the accuracy or completeness of the information provided, nor any loss arising from any investment based on a recommendation, forecast or any information supplied by any third-party.
Could the price reverse from here?The Cable (GBP?USD) is reacting off the pivot and could reverse to the 1st support which acts as a pullback support.
Pivot: 1.3710
1st Support: 1.3620
1st Resistance: 1.3799
Risk Warning:
Trading Forex and CFDs carries a high level of risk to your capital and you should only trade with money you can afford to lose. Trading Forex and CFDs may not be suitable for all investors, so please ensure that you fully understand the risks involved and seek independent advice if necessary.
Disclaimer:
The above opinions given constitute general market commentary, and do not constitute the opinion or advice of IC Markets or any form of personal or investment advice.
Any opinions, news, research, analyses, prices, other information, or links to third-party sites contained on this website are provided on an "as-is" basis, are intended only to be informative, is not an advice nor a recommendation, nor research, or a record of our trading prices, or an offer of, or solicitation for a transaction in any financial instrument and thus should not be treated as such. The information provided does not involve any specific investment objectives, financial situation and needs of any specific person who may receive it. Please be aware, that past performance is not a reliable indicator of future performance and/or results. Past Performance or Forward-looking scenarios based upon the reasonable beliefs of the third-party provider are not a guarantee of future performance. Actual results may differ materially from those anticipated in forward-looking or past performance statements. IC Markets makes no representation or warranty and assumes no liability as to the accuracy or completeness of the information provided, nor any loss arising from any investment based on a recommendation, forecast or any information supplied by any third-party.

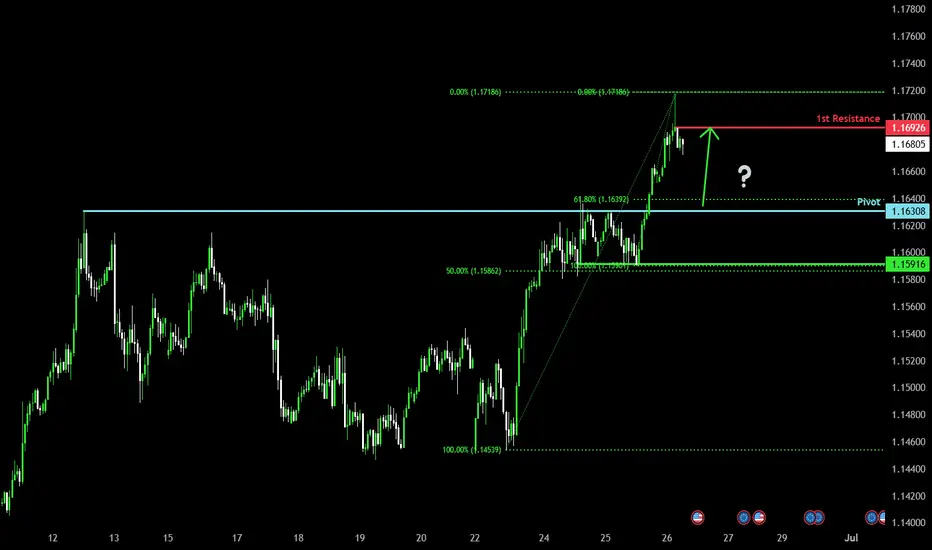
Bullish continuation for the Fiber?The price is falling towards the pivot point, which is a pullback support, and could bounce to the 1st resistance, which is also a pullback resistance.
Pivot: 1.1630
1st Support: 1.1591
1st Resistance: 1.1692
Risk Warning:
Trading Forex and CFDs carries a high level of risk to your capital and you should only trade with money you can afford to lose. Trading Forex and CFDs may not be suitable for all investors, so please ensure that you fully understand the risks involved and seek independent advice if necessary.
Disclaimer:
The above opinions given constitute general market commentary, and do not constitute the opinion or advice of IC Markets or any form of personal or investment advice.
Any opinions, news, research, analyses, prices, other information, or links to third-party sites contained on this website are provided on an "as-is" basis, are intended only to be informative, is not an advice nor a recommendation, nor research, or a record of our trading prices, or an offer of, or solicitation for a transaction in any financial instrument and thus should not be treated as such. The information provided does not involve any specific investment objectives, financial situation and needs of any specific person who may receive it. Please be aware, that past performance is not a reliable indicator of future performance and/or results. Past Performance or Forward-looking scenarios based upon the reasonable beliefs of the third-party provider are not a guarantee of future performance. Actual results may differ materially from those anticipated in forward-looking or past performance statements. IC Markets makes no representation or warranty and assumes no liability as to the accuracy or completeness of the information provided, nor any loss arising from any investment based on a recommendation, forecast or any information supplied by any third-party.
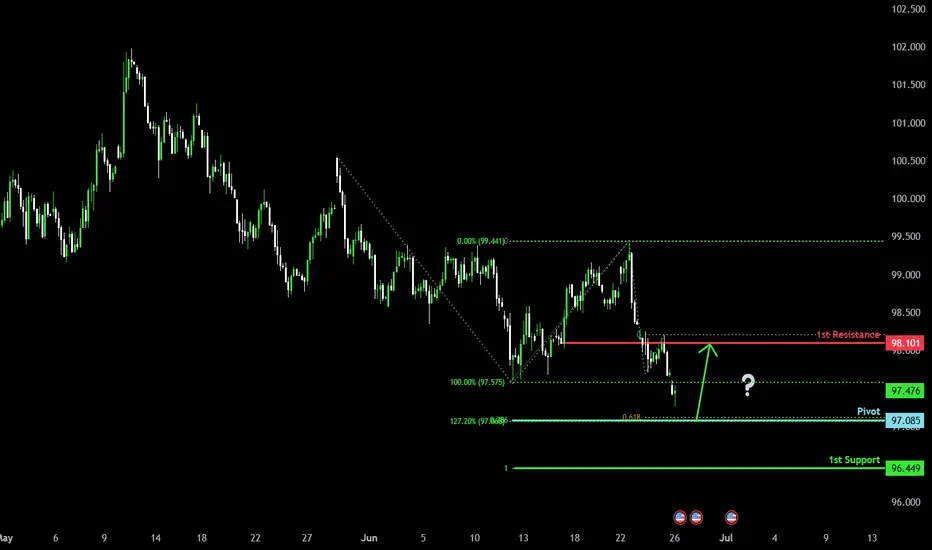
Potential bulllish reveresal?The US Dollar Index (DXY) is falling towards the pivot, which aligns with the Fibonacci confluence and could reverse to the 1st resistance.
Pivot: 97.08
1st Support: 96.44
1st Resistance: 98.10
Risk Warning:
Trading Forex and CFDs carries a high level of risk to your capital and you should only trade with money you can afford to lose. Trading Forex and CFDs may not be suitable for all investors, so please ensure that you fully understand the risks involved and seek independent advice if necessary.
Disclaimer:
The above opinions given constitute general market commentary, and do not constitute the opinion or advice of IC Markets or any form of personal or investment advice.
Any opinions, news, research, analyses, prices, other information, or links to third-party sites contained on this website are provided on an "as-is" basis, are intended only to be informative, is not an advice nor a recommendation, nor research, or a record of our trading prices, or an offer of, or solicitation for a transaction in any financial instrument and thus should not be treated as such. The information provided does not involve any specific investment objectives, financial situation and needs of any specific person who may receive it. Please be aware, that past performance is not a reliable indicator of future performance and/or results. Past Performance or Forward-looking scenarios based upon the reasonable beliefs of the third-party provider are not a guarantee of future performance. Actual results may differ materially from those anticipated in forward-looking or past performance statements. IC Markets makes no representation or warranty and assumes no liability as to the accuracy or completeness of the information provided, nor any loss arising from any investment based on a recommendation, forecast or any information supplied by any third-party.
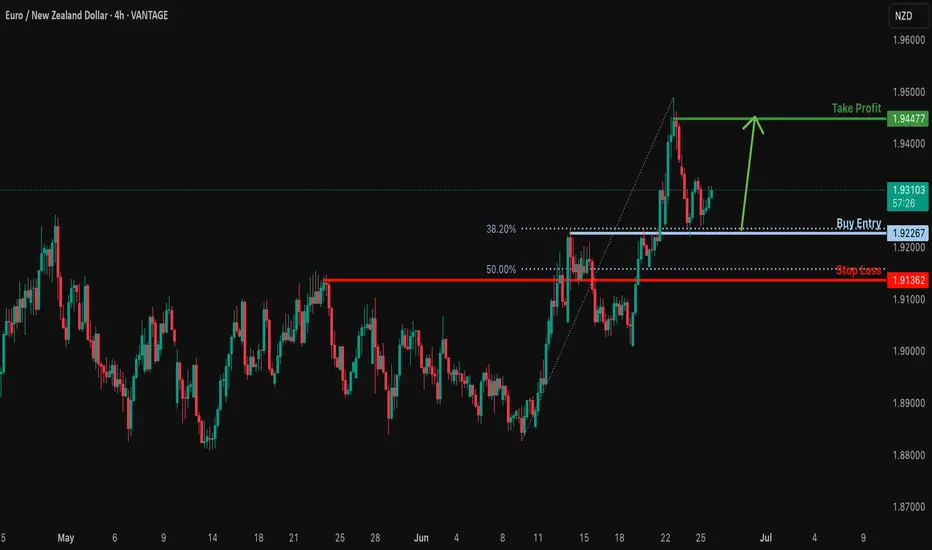
Potential bullish rise?EUR/NZD has bounced off the support level which is a pullback support that aligns with the 38.2% Fibonacci retracement and could rise from this level to our take profit.
Entry: 1.92267
Why we like it:
There is a pullback support level that lines up with the 38.2% Fibonacci retracement.
Stop loss: 1.91362
Why we like it:
There is a pullback support level that lines up with the 50% Fibonacci retracement.
Take profit: 1.94477
Why we like it:
There is a pullback resistance level.
Enjoying your TradingView experience? Review us!
Please be advised that the information presented on TradingView is provided to Vantage (‘Vantage Global Limited’, ‘we’) by a third-party provider (‘Everest Fortune Group’). Please be reminded that you are solely responsible for the trading decisions on your account. There is a very high degree of risk involved in trading. Any information and/or content is intended entirely for research, educational and informational purposes only and does not constitute investment or consultation advice or investment strategy. The information is not tailored to the investment needs of any specific person and therefore does not involve a consideration of any of the investment objectives, financial situation or needs of any viewer that may receive it. Kindly also note that past performance is not a reliable indicator of future results. Actual results may differ materially from those anticipated in forward-looking or past performance statements. We assume no liability as to the accuracy or completeness of any of the information and/or content provided herein and the Company cannot be held responsible for any omission, mistake nor for any loss or damage including without limitation to any loss of profit which may arise from reliance on any information supplied by Everest Fortune Group.
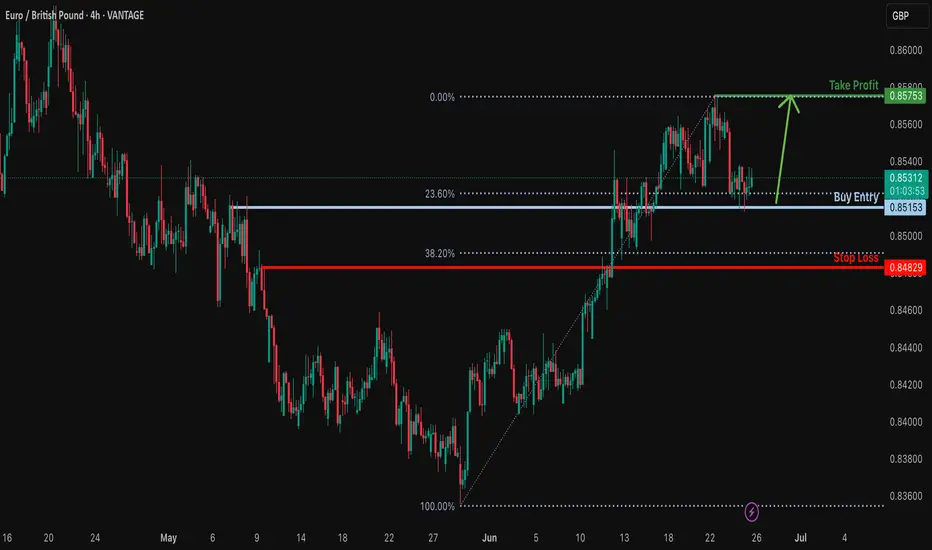
Bullish bounce off overlap support?EUR/GBP is reacting off the support level which is an overlap support that lines up with the 23.6% Fibonacci retracement and could rise from this level to our take profit.
Entry: 0.8515
Why we like it:
There is an overlap support level that aligns with the 23.6% Fibonacci retracement.
Stop loss: 0.8482
Why we like it:
There is a pullback support level that is slightly below the 38.2% Fibonacci retracement.
Take profit: 0.8575
Why we like it:
There is a pullback resistance level.
Enjoying your TradingView experience? Review us!
Please be advised that the information presented on TradingView is provided to Vantage (‘Vantage Global Limited’, ‘we’) by a third-party provider (‘Everest Fortune Group’). Please be reminded that you are solely responsible for the trading decisions on your account. There is a very high degree of risk involved in trading. Any information and/or content is intended entirely for research, educational and informational purposes only and does not constitute investment or consultation advice or investment strategy. The information is not tailored to the investment needs of any specific person and therefore does not involve a consideration of any of the investment objectives, financial situation or needs of any viewer that may receive it. Kindly also note that past performance is not a reliable indicator of future results. Actual results may differ materially from those anticipated in forward-looking or past performance statements. We assume no liability as to the accuracy or completeness of any of the information and/or content provided herein and the Company cannot be held responsible for any omission, mistake nor for any loss or damage including without limitation to any loss of profit which may arise from reliance on any information supplied by Everest Fortune Group.
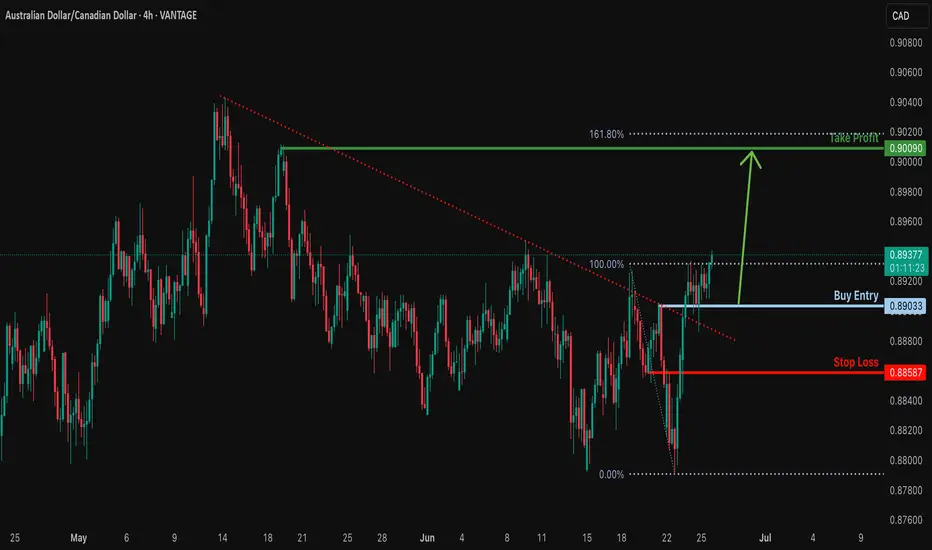
Bullish momentum to extend?AUD/CAD has bounced off the support level which is a pullback support and could potentially rise from this level to our take profit.
Entry: 0.89033
Why we like it:
There is a pullback support level.
Stop loss: 0.8858
Why we like it:
There is a pullback support level.
Take profit: 0.9009
Why we like it:
There is a pullback resistance that is slightly below the 161.8% Fibonacci extension.
Enjoying your TradingView experience? Review us!
Please be advised that the information presented on TradingView is provided to Vantage (‘Vantage Global Limited’, ‘we’) by a third-party provider (‘Everest Fortune Group’). Please be reminded that you are solely responsible for the trading decisions on your account. There is a very high degree of risk involved in trading. Any information and/or content is intended entirely for research, educational and informational purposes only and does not constitute investment or consultation advice or investment strategy. The information is not tailored to the investment needs of any specific person and therefore does not involve a consideration of any of the investment objectives, financial situation or needs of any viewer that may receive it. Kindly also note that past performance is not a reliable indicator of future results. Actual results may differ materially from those anticipated in forward-looking or past performance statements. We assume no liability as to the accuracy or completeness of any of the information and/or content provided herein and the Company cannot be held responsible for any omission, mistake nor for any loss or damage including without limitation to any loss of profit which may arise from reliance on any information supplied by Everest Fortune Group.
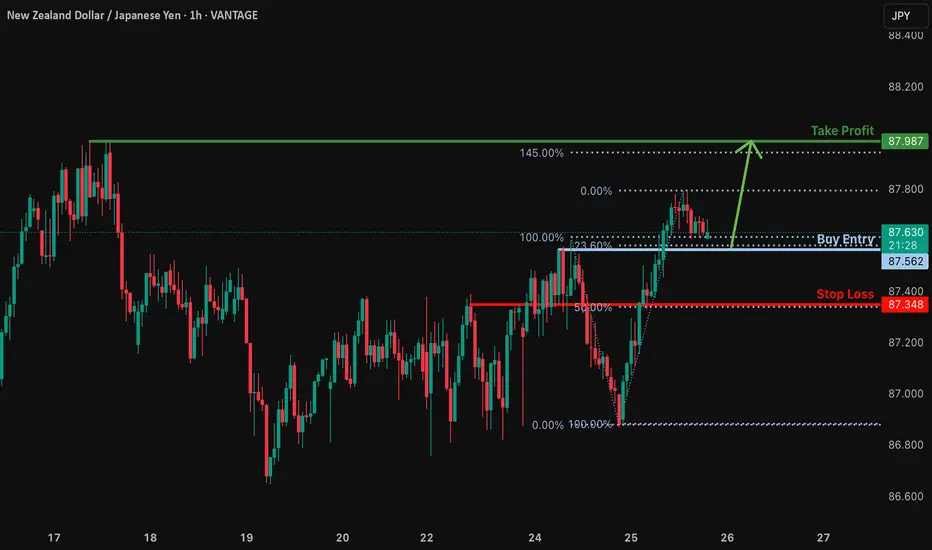
Bullish bounce?NZD/JPY is falling towards the support level which is a pullback support that lines up with the 23.6% Fibonacci retracement and could bounce from this level to our take profit.
Entry: 87.562
Why we like it:
There is a pullback support level that aligns with the 23.6% Fibonacci retracement.
Stop loss: 87.34
Why we like it:
There is a pullback support that aligns with the 50% Fibonacci retracement.
Take profit: 87.98
Why we like it:
There is a pullback resistance level that lines up with the 145% Fibonacci extension.
Enjoying your TradingView experience? Review us!
Please be advised that the information presented on TradingView is provided to Vantage (‘Vantage Global Limited’, ‘we’) by a third-party provider (‘Everest Fortune Group’). Please be reminded that you are solely responsible for the trading decisions on your account. There is a very high degree of risk involved in trading. Any information and/or content is intended entirely for research, educational and informational purposes only and does not constitute investment or consultation advice or investment strategy. The information is not tailored to the investment needs of any specific person and therefore does not involve a consideration of any of the investment objectives, financial situation or needs of any viewer that may receive it. Kindly also note that past performance is not a reliable indicator of future results. Actual results may differ materially from those anticipated in forward-looking or past performance statements. We assume no liability as to the accuracy or completeness of any of the information and/or content provided herein and the Company cannot be held responsible for any omission, mistake nor for any loss or damage including without limitation to any loss of profit which may arise from reliance on any information supplied by Everest Fortune Group.
Market next move 🔻 Bearish Disruption Analysis
1. False Breakout / Bull Trap
The price might briefly break above the red resistance zone (highlighted), triggering buy orders.
However, instead of continuing higher, sellers step in aggressively, pushing the price back below resistance.
This would form a fakeout or bull trap, catching breakout buyers off-guard.
2. Volume Divergence
Look at the volume at the breakout: if the breakout occurs on declining or weak volume, it's a warning sign that the move lacks conviction.
The breakout may not sustain without strong volume backing it.
3. Lower High Formation
If the price fails to make a higher high above the previous peak (~3,340-3,345), and reverses downward, it indicates buying exhaustion.
4. MACRO/FUNDAMENTAL Trigger
Sudden news (e.g., strong USD data, interest rate hike comments from the Fed, or geopolitical tension easing) could cause a sharp sell-off in gold.
This would invalidate the bullish pattern entirely.
5. Bearish Price Target
If the disruption plays out, price could drop back to 3,300 or below, especially if support is weak.
A confirmed lower low below 3,310 would suggest a larger bearish structure

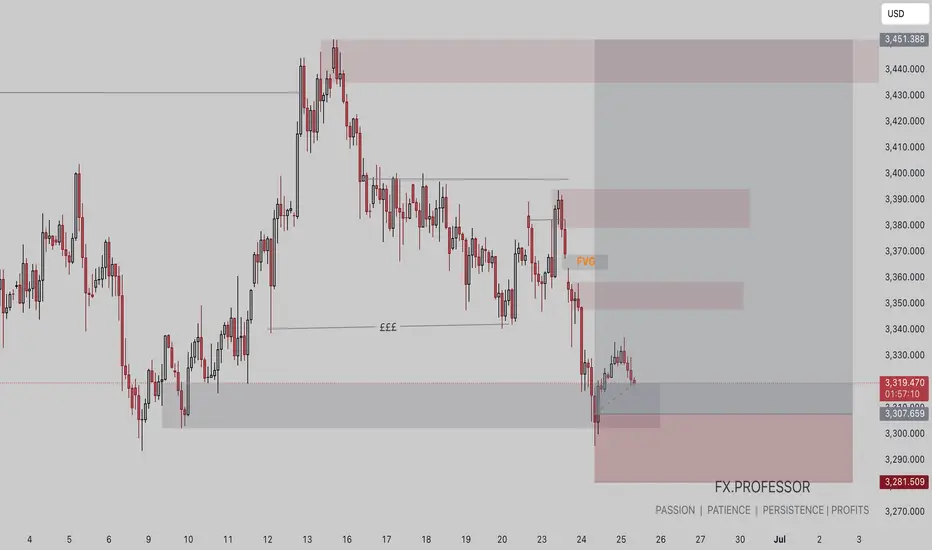
GOLDCurrently on a buy trade on Gold but we also have 2 supply levels above as our POI where we could be watching closely for sell opportunities. Personally, i prefer the extreme POI because it has FVG right below it which i expect to be filled up so my bias on GOLD is buy to sell.
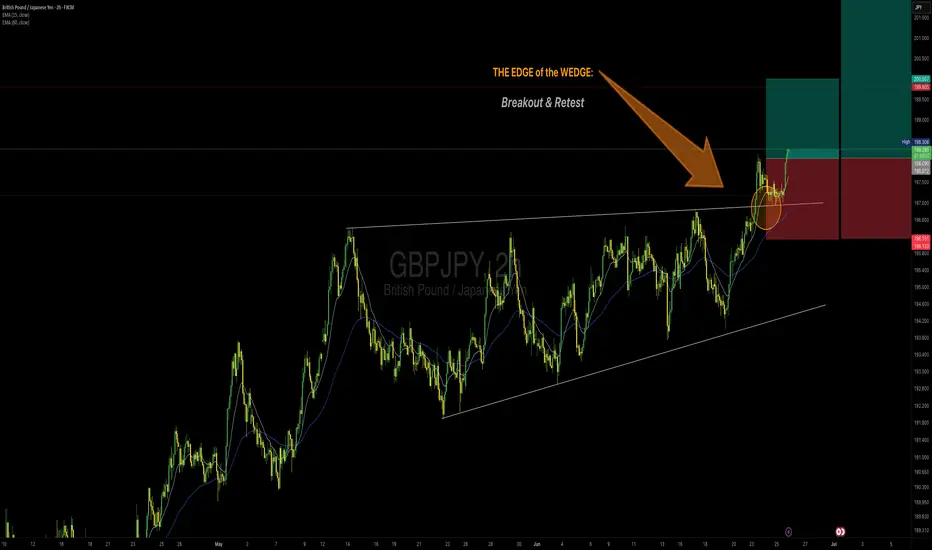
Edge of the Wedge || GBPJPY
Simply Breakout and retest of the Edge of the Wedge
Entry: 198
Tp1: 200
TP2: 202
TP3: 204
SL: 196
A classic trend following setup
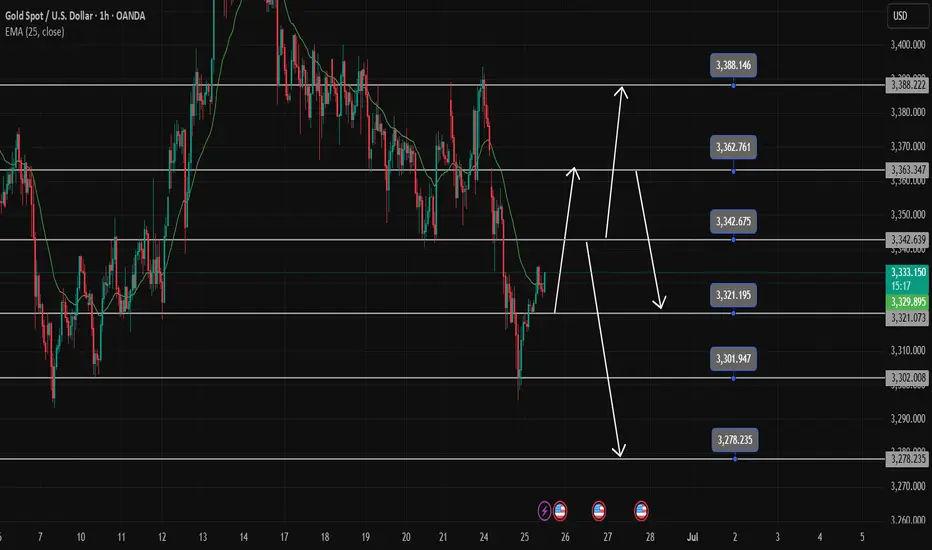
Gold Trading Strategy June 25The Daily Candle shows a strong selling force breaking out of the 3-day accumulation zone. Gold touches the support zone of 3296 and bounces back as analyzed yesterday. Today, it is difficult for the bullish force to return, there is a possibility of an increase in the Asian session and the European session, and the US session will return with the Selling force.
The recovery from 3296 towards 3342, some selling force may appear around 3342, forming a strong bearish structure. The bearish wave structure will weaken if it breaks 3342. The 3363 area still has a reaction but the bearish wave structure is no longer strong.
The market closed above 3363 confirming the downtrend break and heading towards the resistance zone of 3388. The bottom support of 3302 will help to temporarily stop the price decline before heading towards the target of 3278.
Support: 3321-3302-3278
Resistance: 3342-3363-3388
Break out: 3342-3322
Recommended trading signal
BUY GOLD 3302-3300 SL 3297
SELL GOLD 3363-3365 SL 3369
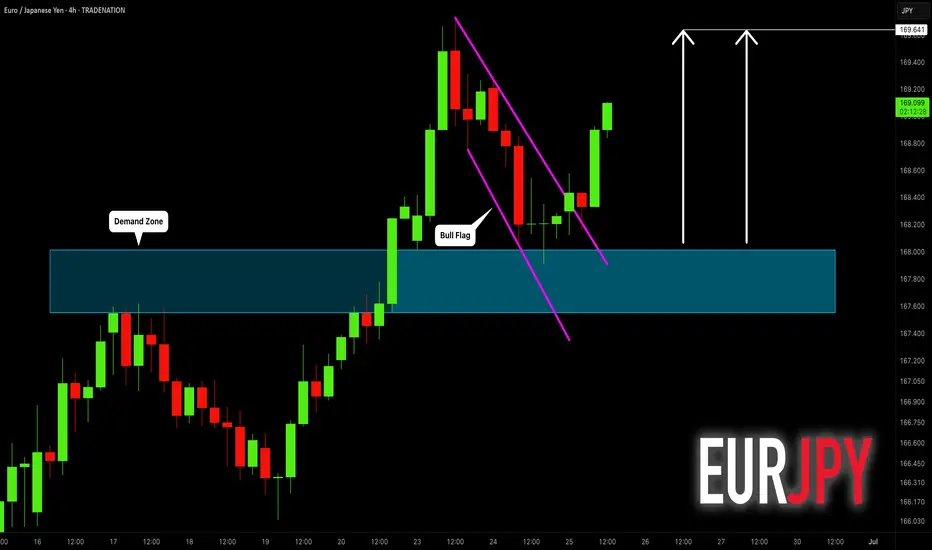
EURJPY: Bullish Trend Continues 🇪🇺🇯🇵
EURJPY shows a strength after a test of a significant demand zone.
Bullish breakout of a resistance line of a flag pattern provides
a strong trend-following signal.
Goal - 169.64
❤️Please, support my work with like, thank you!❤️
I am part of Trade Nation's Influencer program and receive a monthly fee for using their TradingView charts in my analysis.
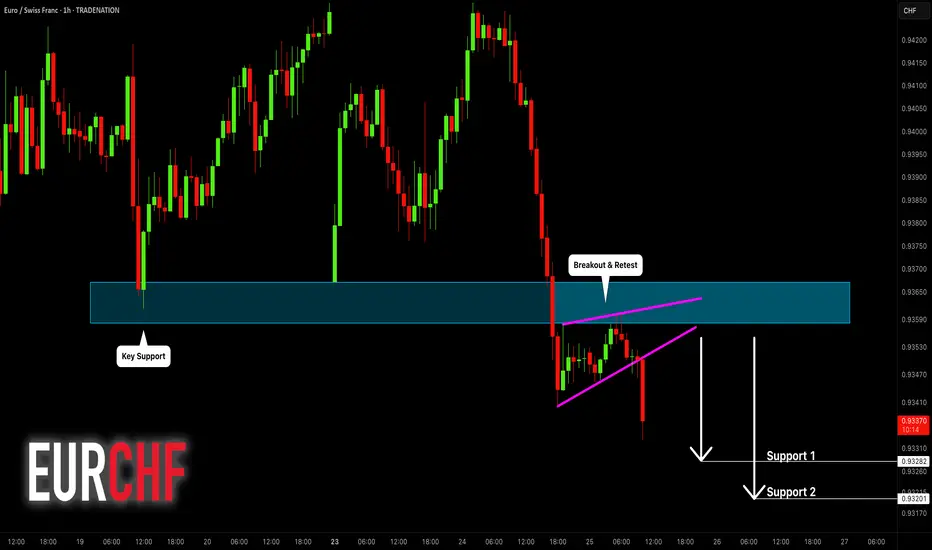
EURCHF: Bearish Continuation After Breakout 🇪🇺🇨🇭
EURCHF violated a significant horizontal support.
Retesting that, a bearish flag pattern was formed.
Its support violation provides a strong intraday confirmation.
The pair may drop lower at least to 0.9328
❤️Please, support my work with like, thank you!❤️
I am part of Trade Nation's Influencer program and receive a monthly fee for using their TradingView charts in my analysis.
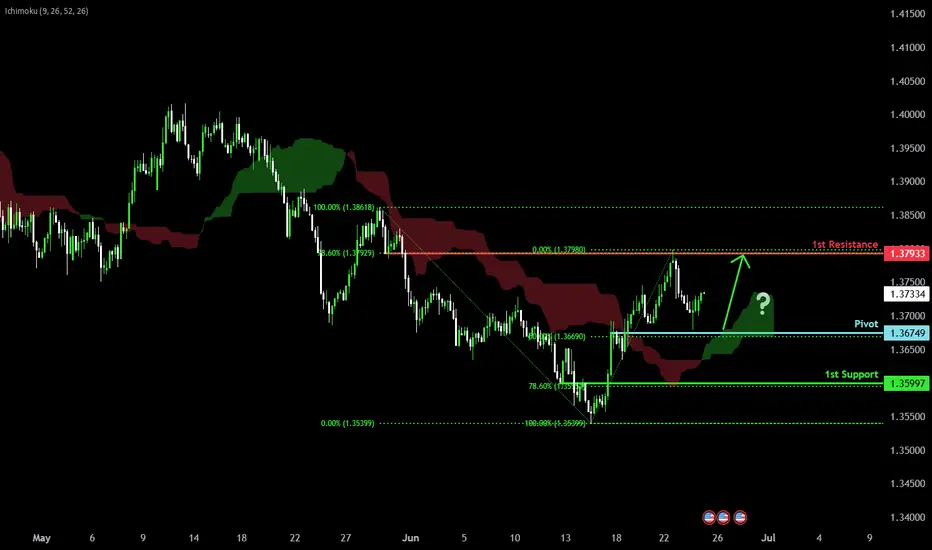
Bullish bounce off pullback support?The Loonie (USD/CAD) has bounced of the pivot and could rise to the 1st resistance which acts as a pullback resistance.
Pivot: 1.3674
1st Support: 1.3599
1st Resistance: 1.3793
Risk Warning:
Trading Forex and CFDs carries a high level of risk to your capital and you should only trade with money you can afford to lose. Trading Forex and CFDs may not be suitable for all investors, so please ensure that you fully understand the risks involved and seek independent advice if necessary.
Disclaimer:
The above opinions given constitute general market commentary, and do not constitute the opinion or advice of IC Markets or any form of personal or investment advice.
Any opinions, news, research, analyses, prices, other information, or links to third-party sites contained on this website are provided on an "as-is" basis, are intended only to be informative, is not an advice nor a recommendation, nor research, or a record of our trading prices, or an offer of, or solicitation for a transaction in any financial instrument and thus should not be treated as such. The information provided does not involve any specific investment objectives, financial situation and needs of any specific person who may receive it. Please be aware, that past performance is not a reliable indicator of future performance and/or results. Past Performance or Forward-looking scenarios based upon the reasonable beliefs of the third-party provider are not a guarantee of future performance. Actual results may differ materially from those anticipated in forward-looking or past performance statements. IC Markets makes no representation or warranty and assumes no liability as to the accuracy or completeness of the information provided, nor any loss arising from any investment based on a recommendation, forecast or any information supplied by any third-party.
Bullish bounce?USD/JPY is falling towards the pivot which is an overlap support and could bounce to the 1st resistance that lines up with the 23.6% Fibonacci retracement.
Pivot: 144.35
1st Support: 143.09
1st Resistance: 145.29
Risk Warning:
Trading Forex and CFDs carries a high level of risk to your capital and you should only trade with money you can afford to lose. Trading Forex and CFDs may not be suitable for all investors, so please ensure that you fully understand the risks involved and seek independent advice if necessary.
Disclaimer:
The above opinions given constitute general market commentary, and do not constitute the opinion or advice of IC Markets or any form of personal or investment advice.
Any opinions, news, research, analyses, prices, other information, or links to third-party sites contained on this website are provided on an "as-is" basis, are intended only to be informative, is not an advice nor a recommendation, nor research, or a record of our trading prices, or an offer of, or solicitation for a transaction in any financial instrument and thus should not be treated as such. The information provided does not involve any specific investment objectives, financial situation and needs of any specific person who may receive it. Please be aware, that past performance is not a reliable indicator of future performance and/or results. Past Performance or Forward-looking scenarios based upon the reasonable beliefs of the third-party provider are not a guarantee of future performance. Actual results may differ materially from those anticipated in forward-looking or past performance statements. IC Markets makes no representation or warranty and assumes no liability as to the accuracy or completeness of the information provided, nor any loss arising from any investment based on a recommendation, forecast or any information supplied by any third-party.

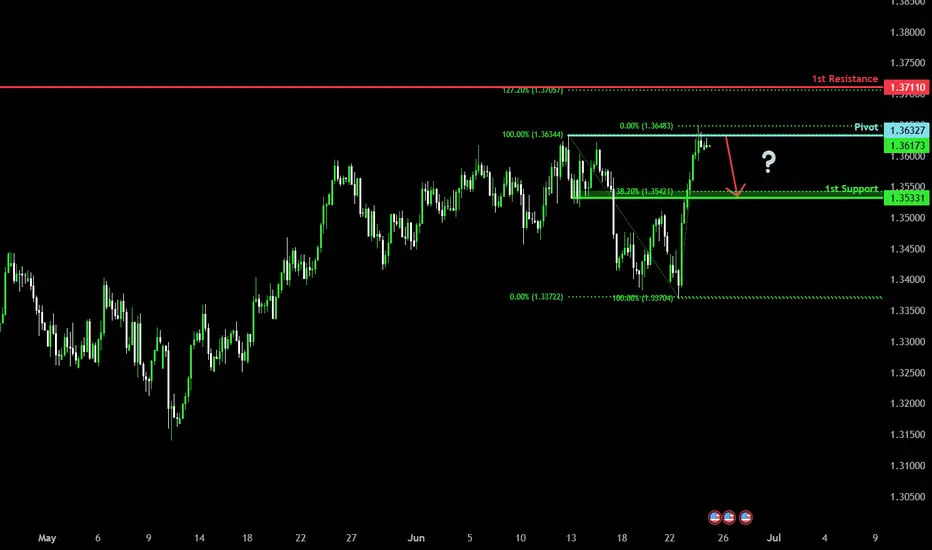
Bearish reversal off pullback resistance?The Cable (GBP/USD) is reacting off the pivot and could drop to the 1st support which is a pullback support.
Pivot: 1.3632
1st Support: 1.3533
1st Resistance: 1.2711
Risk Warning:
Trading Forex and CFDs carries a high level of risk to your capital and you should only trade with money you can afford to lose. Trading Forex and CFDs may not be suitable for all investors, so please ensure that you fully understand the risks involved and seek independent advice if necessary.
Disclaimer:
The above opinions given constitute general market commentary, and do not constitute the opinion or advice of IC Markets or any form of personal or investment advice.
Any opinions, news, research, analyses, prices, other information, or links to third-party sites contained on this website are provided on an "as-is" basis, are intended only to be informative, is not an advice nor a recommendation, nor research, or a record of our trading prices, or an offer of, or solicitation for a transaction in any financial instrument and thus should not be treated as such. The information provided does not involve any specific investment objectives, financial situation and needs of any specific person who may receive it. Please be aware, that past performance is not a reliable indicator of future performance and/or results. Past Performance or Forward-looking scenarios based upon the reasonable beliefs of the third-party provider are not a guarantee of future performance. Actual results may differ materially from those anticipated in forward-looking or past performance statements. IC Markets makes no representation or warranty and assumes no liability as to the accuracy or completeness of the information provided, nor any loss arising from any investment based on a recommendation, forecast or any information supplied by any third-party.
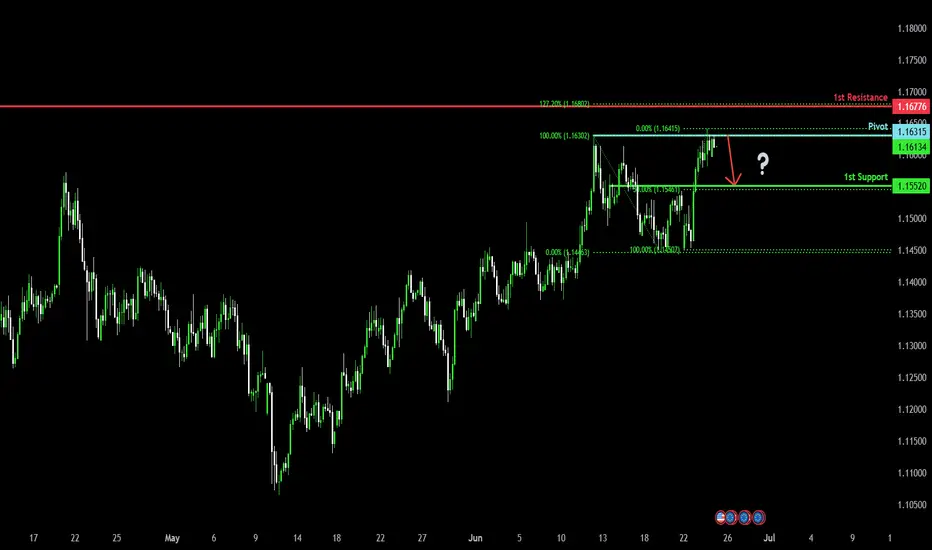
Could the Fiber reverse from here?The price is reacting off the pivot which is a pullback resistance and could drop from this level to the 1st 50% Fibonacci support.
Pivot: 1.1631
1st Support: 1.1552
1st Resistance: 1.1677
Risk Warning:
Trading Forex and CFDs carries a high level of risk to your capital and you should only trade with money you can afford to lose. Trading Forex and CFDs may not be suitable for all investors, so please ensure that you fully understand the risks involved and seek independent advice if necessary.
Disclaimer:
The above opinions given constitute general market commentary, and do not constitute the opinion or advice of IC Markets or any form of personal or investment advice.
Any opinions, news, research, analyses, prices, other information, or links to third-party sites contained on this website are provided on an "as-is" basis, are intended only to be informative, is not an advice nor a recommendation, nor research, or a record of our trading prices, or an offer of, or solicitation for a transaction in any financial instrument and thus should not be treated as such. The information provided does not involve any specific investment objectives, financial situation and needs of any specific person who may receive it. Please be aware, that past performance is not a reliable indicator of future performance and/or results. Past Performance or Forward-looking scenarios based upon the reasonable beliefs of the third-party provider are not a guarantee of future performance. Actual results may differ materially from those anticipated in forward-looking or past performance statements. IC Markets makes no representation or warranty and assumes no liability as to the accuracy or completeness of the information provided, nor any loss arising from any investment based on a recommendation, forecast or any information supplied by any third-party.
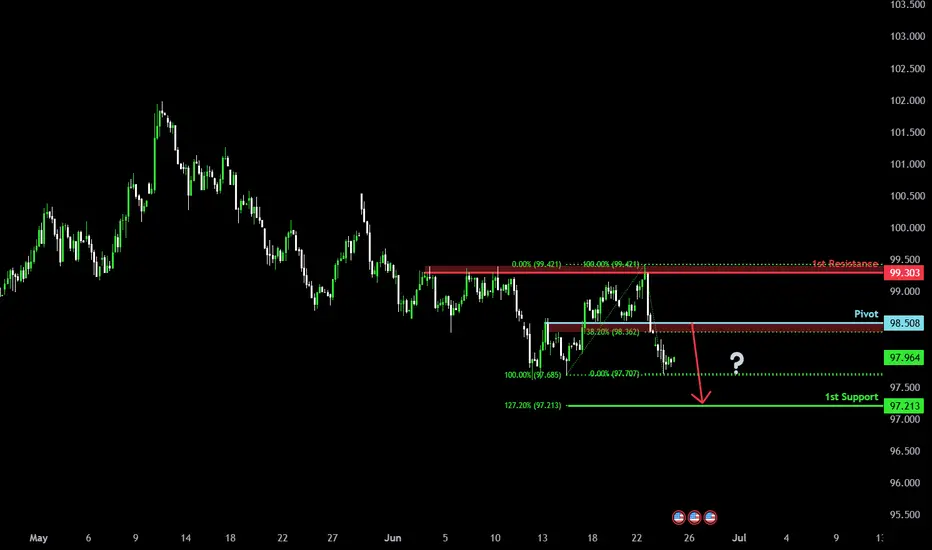
Overlap resistance ahead?The US Dollar Index (DXY) is rising towards the pivot, which is an overlap resistance and could reverse to the 1st support that lines up with the 127.2% Fibonacci extension.
Pivot: 98.50
1st Support: 97.21
1st Resistance: 99.30
Risk Warning:
Trading Forex and CFDs carries a high level of risk to your capital and you should only trade with money you can afford to lose. Trading Forex and CFDs may not be suitable for all investors, so please ensure that you fully understand the risks involved and seek independent advice if necessary.
Disclaimer:
The above opinions given constitute general market commentary, and do not constitute the opinion or advice of IC Markets or any form of personal or investment advice.
Any opinions, news, research, analyses, prices, other information, or links to third-party sites contained on this website are provided on an "as-is" basis, are intended only to be informative, is not an advice nor a recommendation, nor research, or a record of our trading prices, or an offer of, or solicitation for a transaction in any financial instrument and thus should not be treated as such. The information provided does not involve any specific investment objectives, financial situation and needs of any specific person who may receive it. Please be aware, that past performance is not a reliable indicator of future performance and/or results. Past Performance or Forward-looking scenarios based upon the reasonable beliefs of the third-party provider are not a guarantee of future performance. Actual results may differ materially from those anticipated in forward-looking or past performance statements. IC Markets makes no representation or warranty and assumes no liability as to the accuracy or completeness of the information provided, nor any loss arising from any investment based on a recommendation, forecast or any information supplied by any third-party.
Gold Holding Strong – Eyes on $3400 and Beyond! (READ)By analyzing the gold chart on the 4-hour timeframe, we can see that after our last analysis, the price corrected down to $3341, then rallied back up to $3399. Currently, gold is trading around $3373, and if it manages to hold above $3355, we can expect further upside movement.
Potential bullish targets are $3400, $3417, $3450, and $3468.

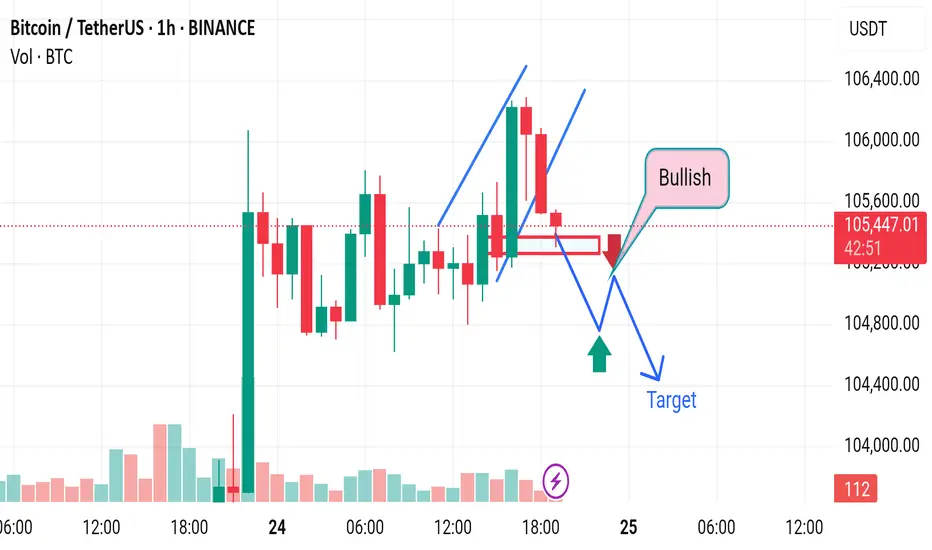
Market next target ⚠️ Disruption Analysis – BTC/USDT
1. False Bullish Narrative
The chart labels the structure as “Bullish”, yet recent price action shows:
A strong rejection near 106,000.
Followed by multiple red candles with increasing volume — a common sign of sell pressure re-entering the market.
The bullish label may be premature or misleading based on this momentum shift.
2. Bearish Structure Developing
The price is starting to form a lower high after the sharp drop.
The outlined path resembles a head-and-shoulders pattern in early development, often preceding a bearish breakdown.
The breakdown could lead directly to the "Target" zone or even below if momentum increases.
3. Volume Divergence
The volume spike during the pump was not sustained. Post-spike, volume is declining on green candles, suggesting buyers are exhausted.
Sellers are likely using liquidity at the top to exit positions, not initiate new longs.
4. Support Turned Resistance
The red boxes mark failed support zones which now may act as resistance.
If price attempts to retest these zones and fails, it would confirm bearish control and validate the downward path toward the target (104,400–104,000).
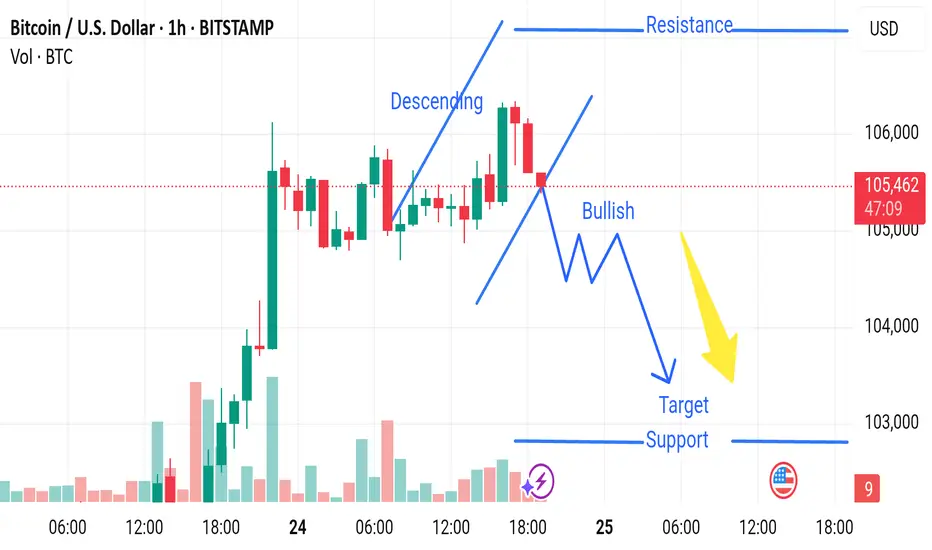
Market next target ⚠️ Disruption Analysis – BTC/USD
1. Questionable Bullish Bias
The chart labels the structure as "Bullish," but the current setup looks more like a potential distribution phase than a healthy continuation pattern.
The price is moving sideways with declining volume, suggesting buyers are losing strength.
2. Volume Discrepancy
Notice the spike in volume during the sharp move up, followed by flat candles and lower volume.
This is typical of a "pump and fade" structure, where large players exit after a rapid price move, leaving retail traders with poor entries.
3. Resistance Not Clearly Broken
Price failed to sustain above 105,800–106,000, indicating that the resistance zone remains valid.
The recent rejection candles near this level suggest sellers are active and overhead pressure is strong.
4. Descending Into Compression
The blue "descending" structure before the sideways move may signal a bearish flag or a pause before further downside—not necessarily a bullish sign.
5. False Reversal Warning
The bullish pattern drawn with zig-zags (implying consolidation before continuation) could actually be setting up a bull trap.
If price fakes a bounce and then breaks below 104,800, a sharper decline toward the 103,000 target could accelerate quickly.