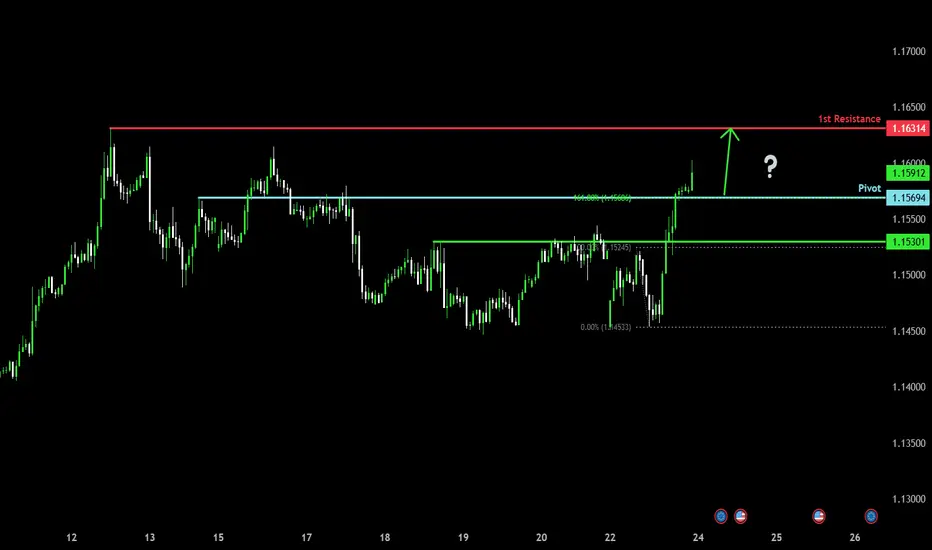
Bullish rise?The Fiber (EUR/USD) has broken out of the pivot and could rise to the 1st resistance.
Pivot: 1.1569
1st Support: 1.1530
1st Resistance: 1.1631
Risk Warning:
Trading Forex and CFDs carries a high level of risk to your capital and you should only trade with money you can afford to lose. Trading Forex and CFDs may not be suitable for all investors, so please ensure that you fully understand the risks involved and seek independent advice if necessary.
Disclaimer:
The above opinions given constitute general market commentary, and do not constitute the opinion or advice of IC Markets or any form of personal or investment advice.
Any opinions, news, research, analyses, prices, other information, or links to third-party sites contained on this website are provided on an "as-is" basis, are intended only to be informative, is not an advice nor a recommendation, nor research, or a record of our trading prices, or an offer of, or solicitation for a transaction in any financial instrument and thus should not be treated as such. The information provided does not involve any specific investment objectives, financial situation and needs of any specific person who may receive it. Please be aware, that past performance is not a reliable indicator of future performance and/or results. Past Performance or Forward-looking scenarios based upon the reasonable beliefs of the third-party provider are not a guarantee of future performance. Actual results may differ materially from those anticipated in forward-looking or past performance statements. IC Markets makes no representation or warranty and assumes no liability as to the accuracy or completeness of the information provided, nor any loss arising from any investment based on a recommendation, forecast or any information supplied by any third-party.
Forexsignals
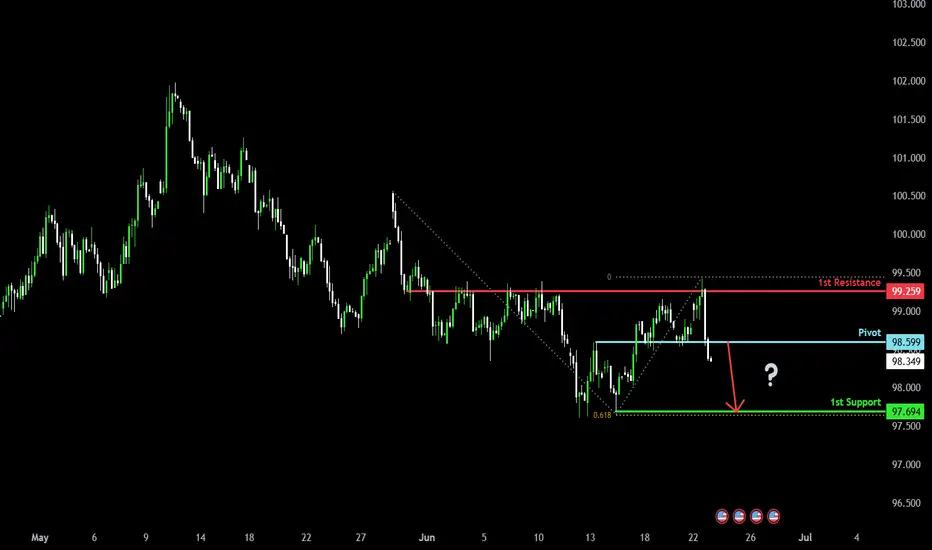
Bearish drop?US Dollar Index (DXY) has reacted off the pivot and could drop to the 1st support.
Pivot: 98.59
1st Support: 97.69
1st Resistance: 99.25
Risk Warning:
Trading Forex and CFDs carries a high level of risk to your capital and you should only trade with money you can afford to lose. Trading Forex and CFDs may not be suitable for all investors, so please ensure that you fully understand the risks involved and seek independent advice if necessary.
Disclaimer:
The above opinions given constitute general market commentary, and do not constitute the opinion or advice of IC Markets or any form of personal or investment advice.
Any opinions, news, research, analyses, prices, other information, or links to third-party sites contained on this website are provided on an "as-is" basis, are intended only to be informative, is not an advice nor a recommendation, nor research, or a record of our trading prices, or an offer of, or solicitation for a transaction in any financial instrument and thus should not be treated as such. The information provided does not involve any specific investment objectives, financial situation and needs of any specific person who may receive it. Please be aware, that past performance is not a reliable indicator of future performance and/or results. Past Performance or Forward-looking scenarios based upon the reasonable beliefs of the third-party provider are not a guarantee of future performance. Actual results may differ materially from those anticipated in forward-looking or past performance statements. IC Markets makes no representation or warranty and assumes no liability as to the accuracy or completeness of the information provided, nor any loss arising from any investment based on a recommendation, forecast or any information supplied by any third-party.
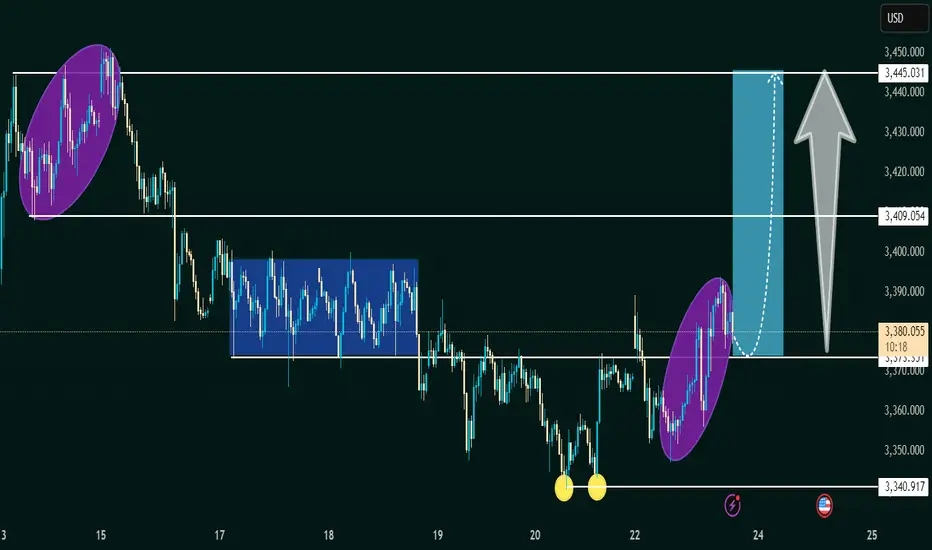
XAU/USD Double Bottom Breakout Bullish Momentum Incoming!XAU/USD Double Bottom Breakout 💥 | 🚀 Bullish Momentum Incoming!
Analysis:
🟡 Double Bottom Pattern: Two clear lows have formed around the $3,340 support, signaling a potential reversal.
🟦 Accumulation Zone: The price consolidated in a range, indicating strong buying interest before the breakout.
🟣 Bullish Momentum: Recent aggressive bullish candles show strong buying pressure.
📈 Breakout & Retest Zone: If the price holds above $3,370, a bullish continuation toward $3,409 and possibly $3,445 is expected.
🧭 Target Area: Marked with a blue box, the upside potential is clearly projected.
Conclusion:
A successful retest of the breakout level may lead to a strong bullish run. Keep an eye on $3,370 as the pivot zone. 🎯
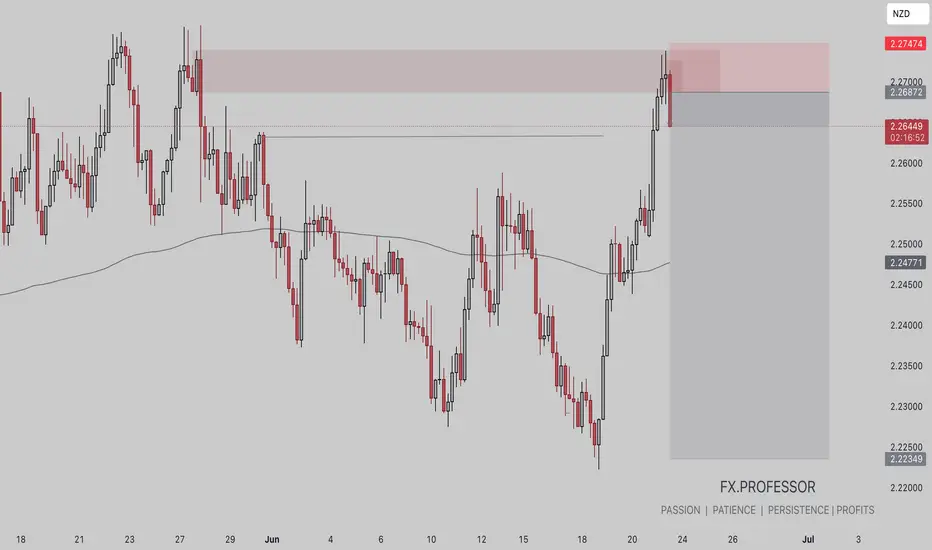
GBPNZD BUY BIAS • Supply Zone (Red Box):
Price tapped into a clearly defined supply area around 2.27000–2.27474, indicating potential for bearish reversal.
• Rejection Candles:
Bearish rejection formed at the top of the zone with clear upper wicks, suggesting selling pressure.
• 200 EMA (Curved Line):
Price rallied into the supply from below the EMA, increasing the probability of a mean reversion move.
• Risk/Reward Box:
A short trade is shown with:
• Entry: Just under 2.27000
• Stop Loss: -2.27474
• Target: 2.22349, aligning with previous structure and EMA
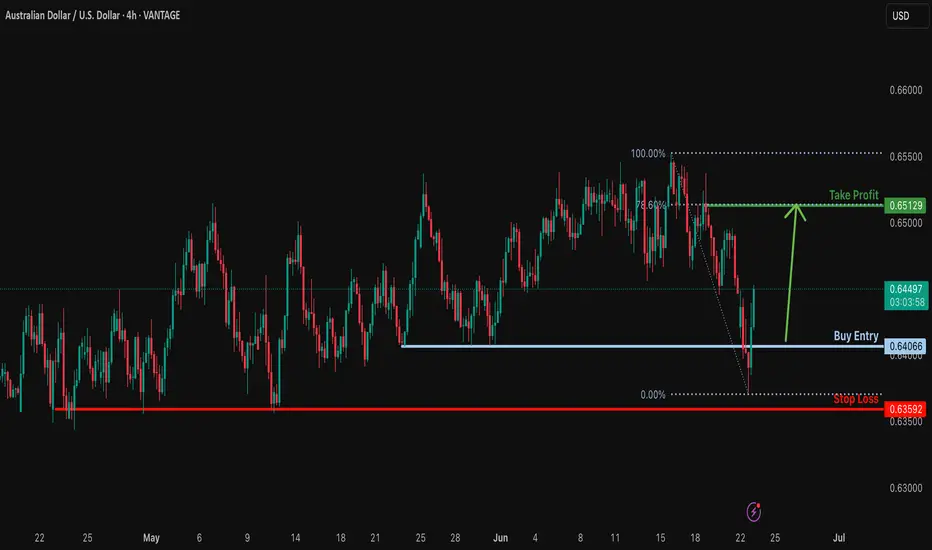
Potential bullish rise?AUD/USD has bounced off the support level which is a pullback support and could rise from this level to our take profit.
Entry: 0.6406
Why we like it:
There is a pullback support level.
Stop loss: 0.6359
Why we like it:
There is a pullback support level.
Take profit: 0.6512
Why we like it:
There is a pullback resistance level that lines up with the 78.6% Fibonacci retracement.
njoying your TradingView experience? Review us!
Please be advised that the information presented on TradingView is provided to Vantage (‘Vantage Global Limited’, ‘we’) by a third-party provider (‘Everest Fortune Group’). Please be reminded that you are solely responsible for the trading decisions on your account. There is a very high degree of risk involved in trading. Any information and/or content is intended entirely for research, educational and informational purposes only and does not constitute investment or consultation advice or investment strategy. The information is not tailored to the investment needs of any specific person and therefore does not involve a consideration of any of the investment objectives, financial situation or needs of any viewer that may receive it. Kindly also note that past performance is not a reliable indicator of future results. Actual results may differ materially from those anticipated in forward-looking or past performance statements. We assume no liability as to the accuracy or completeness of any of the information and/or content provided herein and the Company cannot be held responsible for any omission, mistake nor for any loss or damage including without limitation to any loss of profit which may arise from reliance on any information supplied by Everest Fortune Group.
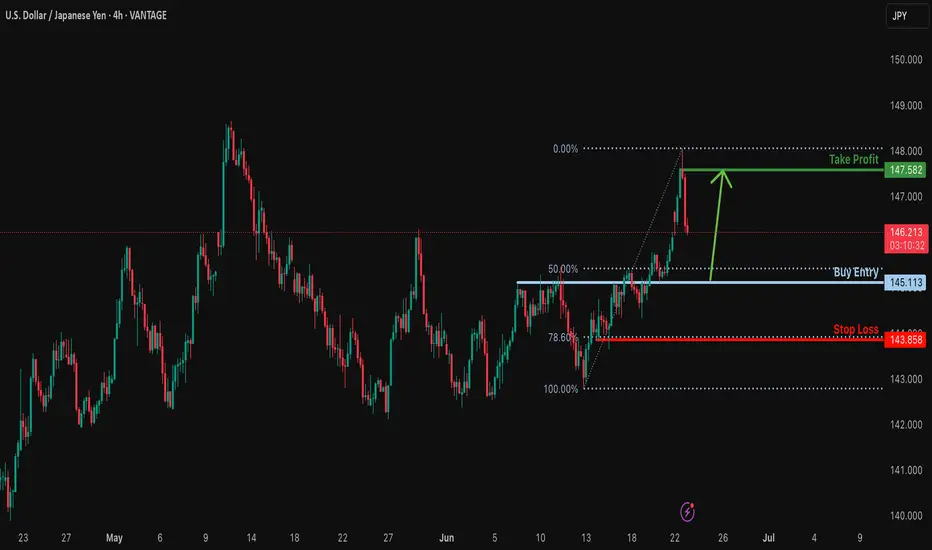
Falling towards pullback support?USD/JPY is falling towards the support level which is a pullback support that is slightly below the 50% Fibonacci retracement and could bounce from this level to our take profit.
Entry: 145.11
Why we like it:
There is a pullback support level that is slightly below the 50% Fibonacci retracement.
Stop loss: 143.85
Why we like it:
There is a pullback support level that lines up with the 78.6% Fibonacci retracement.
Take profit: 147.58
Why we like it:
There is a pullback resistance level.
njoying your TradingView experience? Review us!
Please be advised that the information presented on TradingView is provided to Vantage (‘Vantage Global Limited’, ‘we’) by a third-party provider (‘Everest Fortune Group’). Please be reminded that you are solely responsible for the trading decisions on your account. There is a very high degree of risk involved in trading. Any information and/or content is intended entirely for research, educational and informational purposes only and does not constitute investment or consultation advice or investment strategy. The information is not tailored to the investment needs of any specific person and therefore does not involve a consideration of any of the investment objectives, financial situation or needs of any viewer that may receive it. Kindly also note that past performance is not a reliable indicator of future results. Actual results may differ materially from those anticipated in forward-looking or past performance statements. We assume no liability as to the accuracy or completeness of any of the information and/or content provided herein and the Company cannot be held responsible for any omission, mistake nor for any loss or damage including without limitation to any loss of profit which may arise from reliance on any information supplied by Everest Fortune Group.
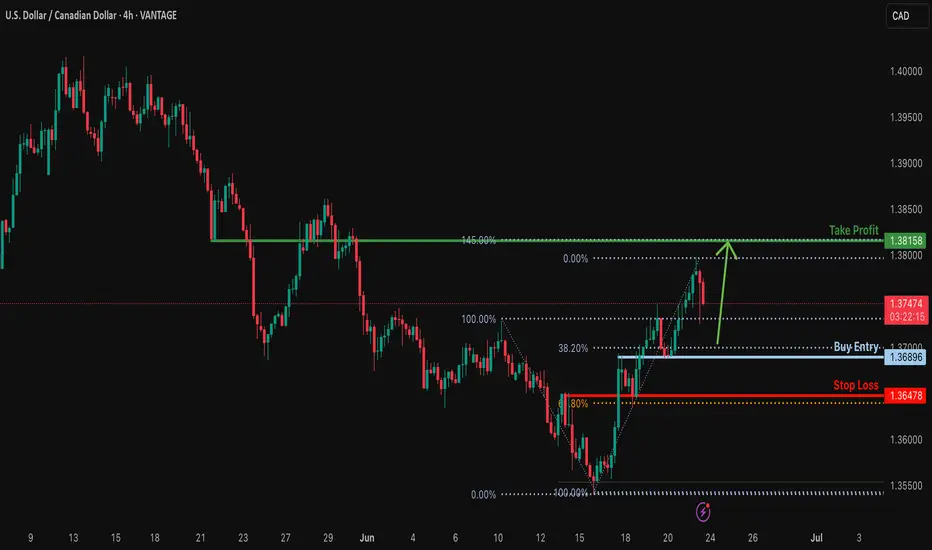
Bullish bounce off overlap support?USD/CAD is falling towards the support level which is an overlap support that lines up with the 38.2% Fibonacci retracement an could bounce from this level to our take profit.
Entry: 1.3689
Why we like it:
There is an overlap support level that lines up with the 38.2% Fibonacci retracement.
Stop loss: 1.3647
Why we like it:
There is an overlap support level that lines up with the 61.8% Fibonacci retracement.
Take profit: 1.3815
Why we like it:
There is a pullback resistance level that aligns with the 145% Fibonacci extension.
Enjoying your TradingView experience? Review us!
Please be advised that the information presented on TradingView is provided to Vantage (‘Vantage Global Limited’, ‘we’) by a third-party provider (‘Everest Fortune Group’). Please be reminded that you are solely responsible for the trading decisions on your account. There is a very high degree of risk involved in trading. Any information and/or content is intended entirely for research, educational and informational purposes only and does not constitute investment or consultation advice or investment strategy. The information is not tailored to the investment needs of any specific person and therefore does not involve a consideration of any of the investment objectives, financial situation or needs of any viewer that may receive it. Kindly also note that past performance is not a reliable indicator of future results. Actual results may differ materially from those anticipated in forward-looking or past performance statements. We assume no liability as to the accuracy or completeness of any of the information and/or content provided herein and the Company cannot be held responsible for any omission, mistake nor for any loss or damage including without limitation to any loss of profit which may arise from reliance on any information supplied by Everest Fortune Group.
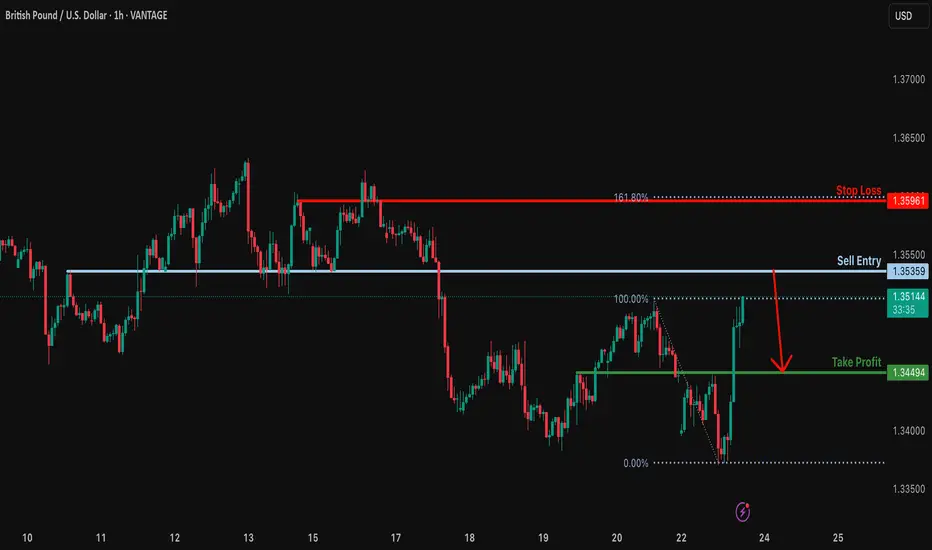
Major resistance ahead?GBP/USD is rising towards the resistance level which is an overlap resistance and could reverse from this level to our take profit.
Entry: 1.3535
Why we like it:
There is an overlap resistance level.
Stop loss: 1.3449
Why we like it:
There is a pullback resistance level that lines up with the 161.8% Fibonacci extension.
Take profit: 1.3449
Why we like it:
There is a pullback support level.
Enjoying your TradingView experience? Review us!
Please be advised that the information presented on TradingView is provided to Vantage (‘Vantage Global Limited’, ‘we’) by a third-party provider (‘Everest Fortune Group’). Please be reminded that you are solely responsible for the trading decisions on your account. There is a very high degree of risk involved in trading. Any information and/or content is intended entirely for research, educational and informational purposes only and does not constitute investment or consultation advice or investment strategy. The information is not tailored to the investment needs of any specific person and therefore does not involve a consideration of any of the investment objectives, financial situation or needs of any viewer that may receive it. Kindly also note that past performance is not a reliable indicator of future results. Actual results may differ materially from those anticipated in forward-looking or past performance statements. We assume no liability as to the accuracy or completeness of any of the information and/or content provided herein and the Company cannot be held responsible for any omission, mistake nor for any loss or damage including without limitation to any loss of profit which may arise from reliance on any information supplied by Everest Fortune Group.
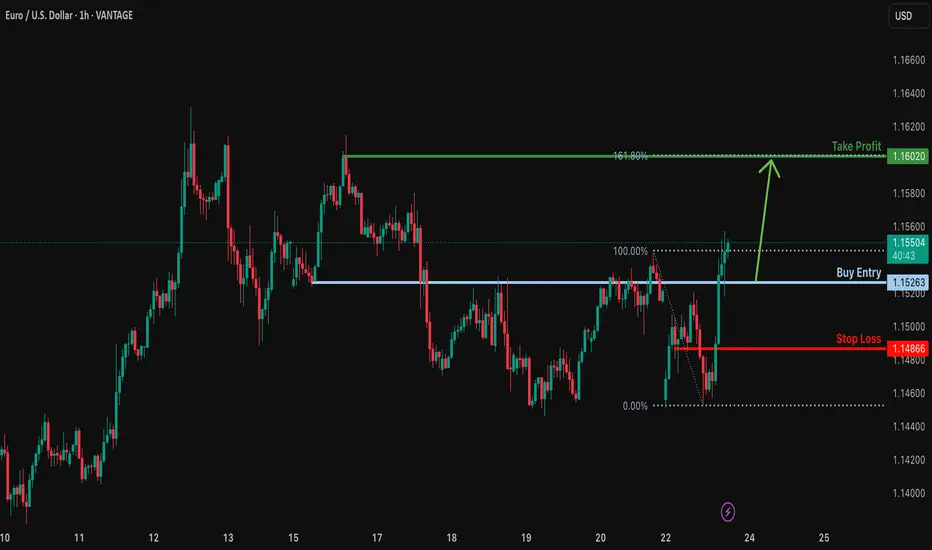
Bullish rise?EUR/USD is falling towards the support level which is an overlap support and could bounce from this level too ur take profit.
Entry: 1.1526
Why we like it:
There is an overlap support level.
Stop loss: 1.1486
Why we like it:
There is a pullback support level.
Take profit: 1.1602
Why we like it:
There is a pullback resistance level that aligns with the 161.8% Fibonacci extension.
Enjoying your TradingView experience? Review us!
Please be advised that the information presented on TradingView is provided to Vantage (‘Vantage Global Limited’, ‘we’) by a third-party provider (‘Everest Fortune Group’). Please be reminded that you are solely responsible for the trading decisions on your account. There is a very high degree of risk involved in trading. Any information and/or content is intended entirely for research, educational and informational purposes only and does not constitute investment or consultation advice or investment strategy. The information is not tailored to the investment needs of any specific person and therefore does not involve a consideration of any of the investment objectives, financial situation or needs of any viewer that may receive it. Kindly also note that past performance is not a reliable indicator of future results. Actual results may differ materially from those anticipated in forward-looking or past performance statements. We assume no liability as to the accuracy or completeness of any of the information and/or content provided herein and the Company cannot be held responsible for any omission, mistake nor for any loss or damage including without limitation to any loss of profit which may arise from reliance on any information supplied by Everest Fortune Group.
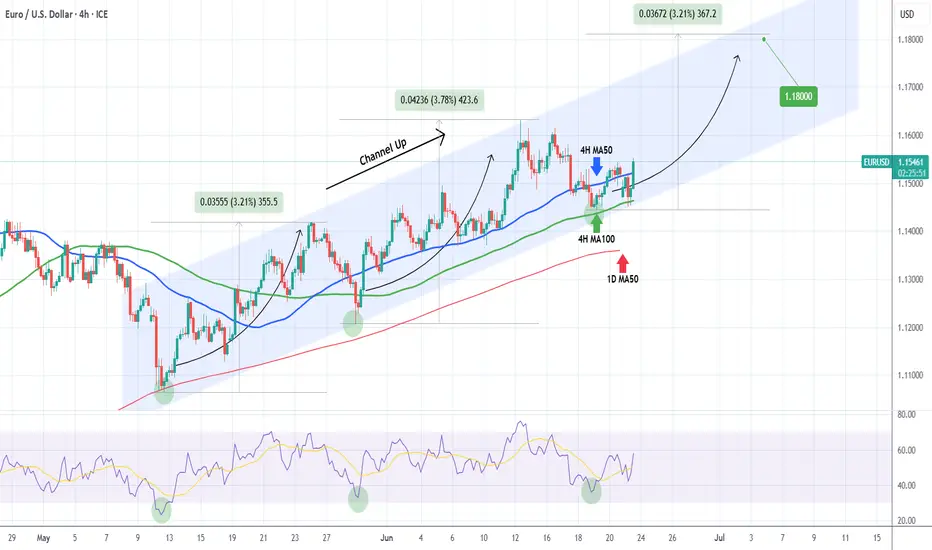
EURUSD Channel Up formed bottom. Heavily bullish.The EURUSD pair has been trading within a Channel Up since the May 12 Low. Today it hit its 4H MA100 (green trend-line) for the first time since May 12 and having just broken also above its 4H MA50 (blue trend-line), it confirmed that the pattern has already priced its bottom.
This is initiating the new Bullish Leg and based on the previous two, it should grow by at least +3.21%. We have a modest short-term Target at 1.1800.
-------------------------------------------------------------------------------
** Please LIKE 👍, FOLLOW ✅, SHARE 🙌 and COMMENT ✍ if you enjoy this idea! Also share your ideas and charts in the comments section below! This is best way to keep it relevant, support us, keep the content here free and allow the idea to reach as many people as possible. **
-------------------------------------------------------------------------------
Disclosure: I am part of Trade Nation's Influencer program and receive a monthly fee for using their TradingView charts in my analysis.
💸💸💸💸💸💸
👇 👇 👇 👇 👇 👇
GBPCHF: Pullback From Support 🇬🇧🇨🇭
GBPCHF is going to pull back from a wide daily support cluster.
I see a strong intraday bullish confirmation and a bullish
imbalance candle after the news.
Goal - 1.0986
❤️Please, support my work with like, thank you!❤️
I am part of Trade Nation's Influencer program and receive a monthly fee for using their TradingView charts in my analysis.
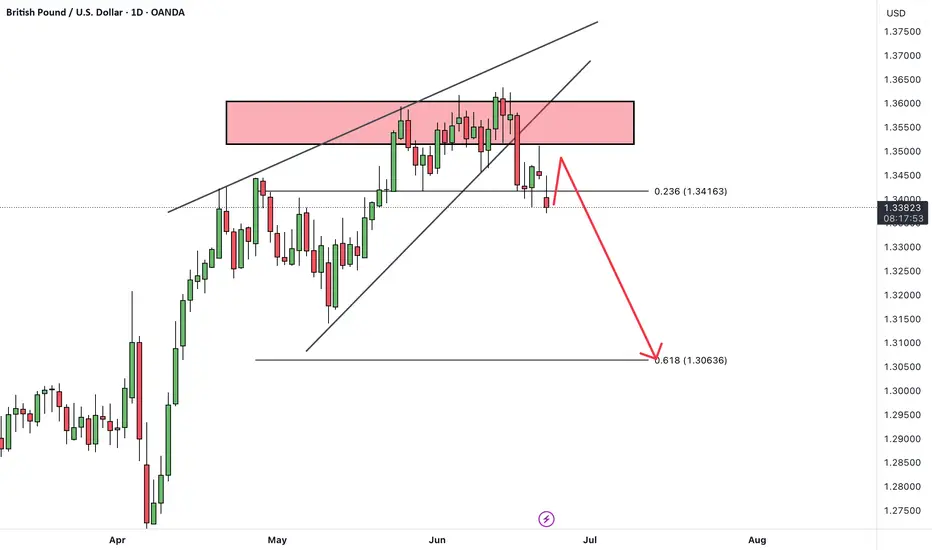
GBPUSDHello Traders! 👋
What are your thoughts on GBPUSD?
On the GBPUSD chart, we can see that the price has repeatedly tested a key resistance zone but failed to break above it, resulting in multiple rejections.
After forming a rising wedge pattern, the pair has broken down below the wedge, and is now completing a pullback toward the broken trendline.
We expect that after some consolidation in this area and completion of the pullback, the price will likely resume its decline toward lower targets.
As long as price remains below the resistance zone and broken trendline, the bearish scenario remains valid.
Is the pullback complete and ready for the next leg down? Share your view below! 🤔👇
Don’t forget to like and share your thoughts in the comments! ❤️
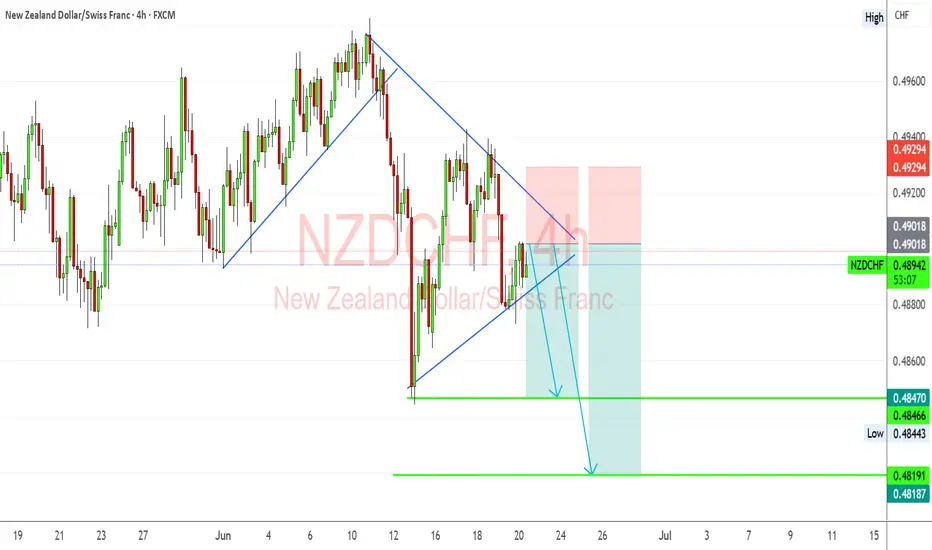
NZDCHF Analysis – “Kiwi Faces Uphill Battle Against Safe-Haven FNZDCHF Price has formed a bearish pennant / triangle after a strong drop from the highs around 0.4960.
Rejection seen from the trendline resistance at ~0.4900, suggesting limited bullish momentum.
Bearish targets are mapped to:
0.4847 (first support)
0.4819 (deeper bearish target)
Two bearish scenarios drawn, both suggesting downside pressure is likely if support breaks.
Structure Bias: Bearish as long as below ~0.4905
📊 Current Bias: Bearish
🧩 Key Fundamentals Driving NZDCHF
NZD Side (Mixed to Weak):
RBNZ held rates at 5.50%, but no additional hawkish surprises. Kiwi is underperforming against safe-havens despite resilience.
Mixed Chinese influence: Some recent recovery in China’s retail/consumption data (e.g., 618 festival) but not strong enough to fuel Kiwi strength.
Risk sentiment: Global geopolitical tensions (Israel-Iran, Ukraine) are pressuring high-beta currencies like NZD.
CHF Side (Strengthening):
Swiss Franc bid on risk-off: CHF is strengthening as a safe-haven due to escalating geopolitical concerns and volatile global markets.
SNB not cutting yet: Recent SNB assessment indicates gradual, patient stance. The central bank may ease later in 2025, but no urgency.
European proximity flows: CHF benefits from proximity to EU and low volatility in domestic economy.
⚠️ Risks That May Reverse the Trend
Surprise RBNZ hawkish speech or inflation spike
Risk-on reversal boosting NZD
Unexpected SNB rate cut or dovish surprise
🗓️ Key News to Watch
🇳🇿 NZ Trade Balance and inflation expectations
🇨🇭 Swiss inflation data and SNB commentary
Global sentiment drivers: Middle East headlines, equity volatility
🏁 Which Asset May Lead?
NZDCHF may lag behind NZDJPY or AUDCHF in volatility but offers a cleaner risk-off signal. If CHF strength and Kiwi weakness persist, this pair can trend with limited noise.
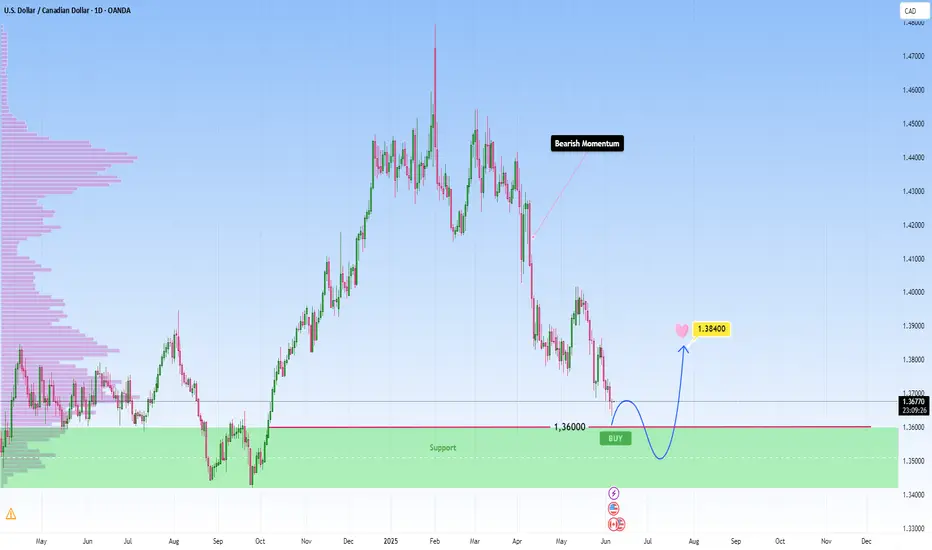
Bearish momentum to meet support on USDCAD: Looking for a bounceEvening, just wanted to share what I’m seeing on the USDCAD chart
Price on USDCAD has been in clear bearish momentum, but we’re now approaching a strong support zone, that’s held firm multiple times before, as I marked it on my chart. Price is approaching the zone again and I am taking it into account for a potential bounce.
I’ll be watching for bullish confirmation as usual requirement before entering. If that support holds, I’m targeting 1.38400 , totally achievable if momentum shifts.
BUT, if this zone breaks with momentum, I’ll reassess it and stay flexible.
💡 Reminder: Patience is power, no entry until price shows me something worth reacting to. This is not financial advice.
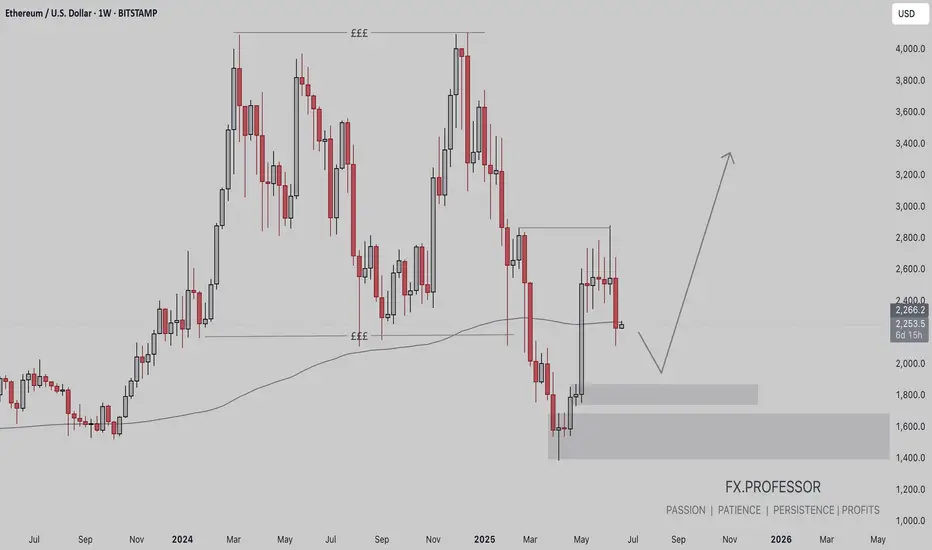
ETH BUY BIASEthereum (ETH/USD) – Weekly Chart Summary
• Current Price: ~$2,250
• Trend: Bearish structure with lower highs and lower lows
• Key Zones:
• Support (Demand): $1,800–$2,000 and $1,400–$1,700
• Resistance: $2,800–$3,600 (liquidity zone)
• 200-Week MA: Acting as dynamic support near current levels
• Outlook: Potential drop into demand zones, followed by a strong bullish reversal targeting the $3,200–$3,600 region
• Risk: Failure to hold $1,800 could trigger deeper losses
📈 Bias: Wait for price to reach key demand zones before entering long positions.
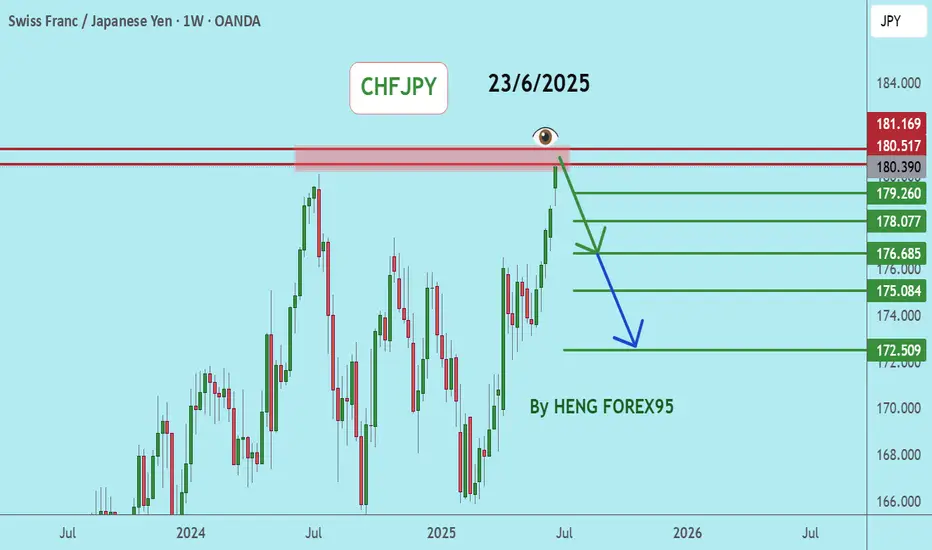
CHFJPYCHFJPY price has a chance to adjust to 180.517-181.169 level. If the price cannot break through 181.169 level, it is expected that the price will drop. Consider selling in the red zone.
🔥Trading futures, forex, CFDs and stocks carries a risk of loss.
Please consider carefully whether such trading is suitable for you.
>>GooD Luck 😊
❤️ Like and subscribe to never miss a new idea!
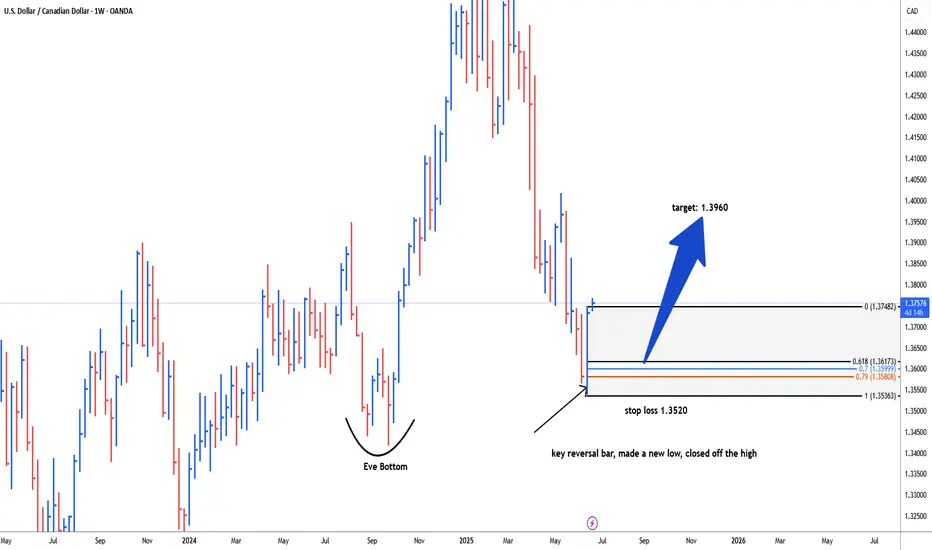
USDCAD possible bullish reversal for 1.3960#usdcad weekly key reversal bar, made a new low, closed off the high, early indication for reversal. It's better to wait for correction 61.8 fib level, 79.0 fib level and 79.0 fib level to reduce/secure drawdwon i.e. 1.3622-1.3585 is the area of interest for long trade. stop loss below key reversal bar i.e. 1.3520. target level: 1.3960
NZDCAD: Confirmed Bearish Trap?! 🇳🇿🇨🇦
There is a high chance that NZDCAD will bounce
after a false violation of a significant daily support cluster.
A formation of a bullish imbalance candle on an hourly time frame
leaves a strong bullish clue.
Goal - 0.818
❤️Please, support my work with like, thank you!❤️
I am part of Trade Nation's Influencer program and receive a monthly fee for using their TradingView charts in my analysis.
#XAUUSD #GOLD 4H#XAUUSD 4H Trade Update
Gold continues to respect its bullish market structure, with clear Breaks of Structure (BOS) and formation of higher lows. Currently, price is consolidating around a key ascending trendline and demand zone.
📍 Entry Zone: 3,340 – 3,345
🎯 Targets: 3,370 / 3,390 / 3,400
❌ Stop-Loss: Below 3,315
This setup was shared yesterday and has since been perfectly activated as price tapped into our marked demand zone.
#Gold #Silver #ForexTrading #XAUUSD #PriceAction

Bullish rise?The Loonie (USD/CAD) has reacted off the pivot and could potentially rise to the 1st resistance which acts as a pullback resistance.
Pivot: 1.3697
1st Support: 1.3561
1st Resistance: 1.3843
Risk Warning:
Trading Forex and CFDs carries a high level of risk to your capital and you should only trade with money you can afford to lose. Trading Forex and CFDs may not be suitable for all investors, so please ensure that you fully understand the risks involved and seek independent advice if necessary.
Disclaimer:
The above opinions given constitute general market commentary, and do not constitute the opinion or advice of IC Markets or any form of personal or investment advice.
Any opinions, news, research, analyses, prices, other information, or links to third-party sites contained on this website are provided on an "as-is" basis, are intended only to be informative, is not an advice nor a recommendation, nor research, or a record of our trading prices, or an offer of, or solicitation for a transaction in any financial instrument and thus should not be treated as such. The information provided does not involve any specific investment objectives, financial situation and needs of any specific person who may receive it. Please be aware, that past performance is not a reliable indicator of future performance and/or results. Past Performance or Forward-looking scenarios based upon the reasonable beliefs of the third-party provider are not a guarantee of future performance. Actual results may differ materially from those anticipated in forward-looking or past performance statements. IC Markets makes no representation or warranty and assumes no liability as to the accuracy or completeness of the information provided, nor any loss arising from any investment based on a recommendation, forecast or any information supplied by any third-party.
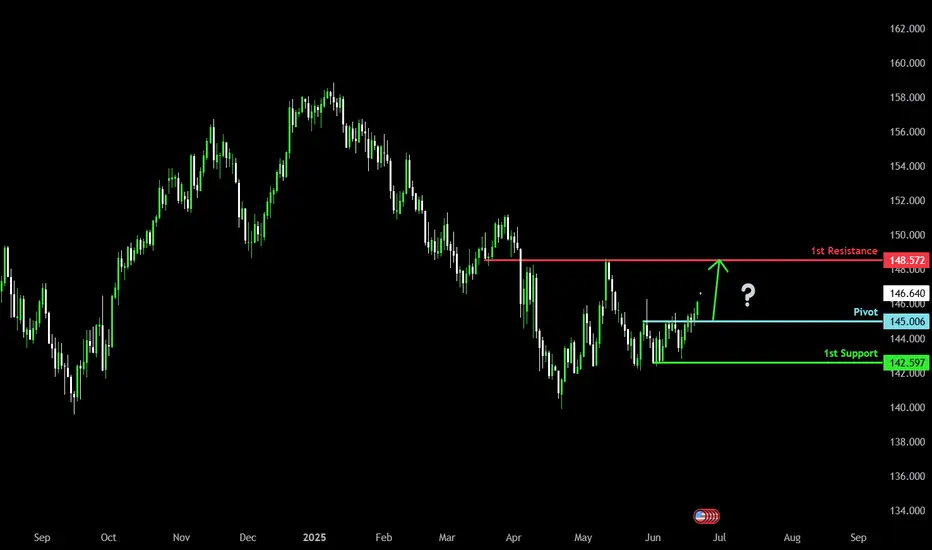
Potential bullish rise?USD/JPY has reacted off the pivot which is a pullback support and could rise to the 1st resistance which is a pullback resistance.
Pivot: 145.00
1st Support: 142.59
1st Resistance: 148.57
Risk Warning:
Trading Forex and CFDs carries a high level of risk to your capital and you should only trade with money you can afford to lose. Trading Forex and CFDs may not be suitable for all investors, so please ensure that you fully understand the risks involved and seek independent advice if necessary.
Disclaimer:
The above opinions given constitute general market commentary, and do not constitute the opinion or advice of IC Markets or any form of personal or investment advice.
Any opinions, news, research, analyses, prices, other information, or links to third-party sites contained on this website are provided on an "as-is" basis, are intended only to be informative, is not an advice nor a recommendation, nor research, or a record of our trading prices, or an offer of, or solicitation for a transaction in any financial instrument and thus should not be treated as such. The information provided does not involve any specific investment objectives, financial situation and needs of any specific person who may receive it. Please be aware, that past performance is not a reliable indicator of future performance and/or results. Past Performance or Forward-looking scenarios based upon the reasonable beliefs of the third-party provider are not a guarantee of future performance. Actual results may differ materially from those anticipated in forward-looking or past performance statements. IC Markets makes no representation or warranty and assumes no liability as to the accuracy or completeness of the information provided, nor any loss arising from any investment based on a recommendation, forecast or any information supplied by any third-party.
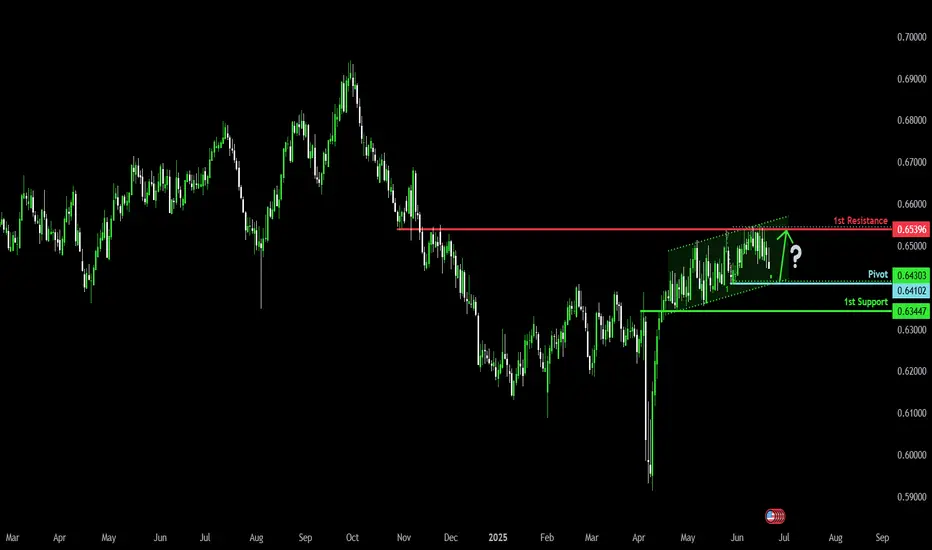
Could the Aussie bounce from here?The price is falling towards the pivot and could bounce to the 1st resistance.
Pivot: 0.6410
1st Support: 0.6344
1st Resistance: 0.6539
Risk Warning:
Trading Forex and CFDs carries a high level of risk to your capital and you should only trade with money you can afford to lose. Trading Forex and CFDs may not be suitable for all investors, so please ensure that you fully understand the risks involved and seek independent advice if necessary.
Disclaimer:
The above opinions given constitute general market commentary, and do not constitute the opinion or advice of IC Markets or any form of personal or investment advice.
Any opinions, news, research, analyses, prices, other information, or links to third-party sites contained on this website are provided on an "as-is" basis, are intended only to be informative, is not an advice nor a recommendation, nor research, or a record of our trading prices, or an offer of, or solicitation for a transaction in any financial instrument and thus should not be treated as such. The information provided does not involve any specific investment objectives, financial situation and needs of any specific person who may receive it. Please be aware, that past performance is not a reliable indicator of future performance and/or results. Past Performance or Forward-looking scenarios based upon the reasonable beliefs of the third-party provider are not a guarantee of future performance. Actual results may differ materially from those anticipated in forward-looking or past performance statements. IC Markets makes no representation or warranty and assumes no liability as to the accuracy or completeness of the information provided, nor any loss arising from any investment based on a recommendation, forecast or any information supplied by any third-party.
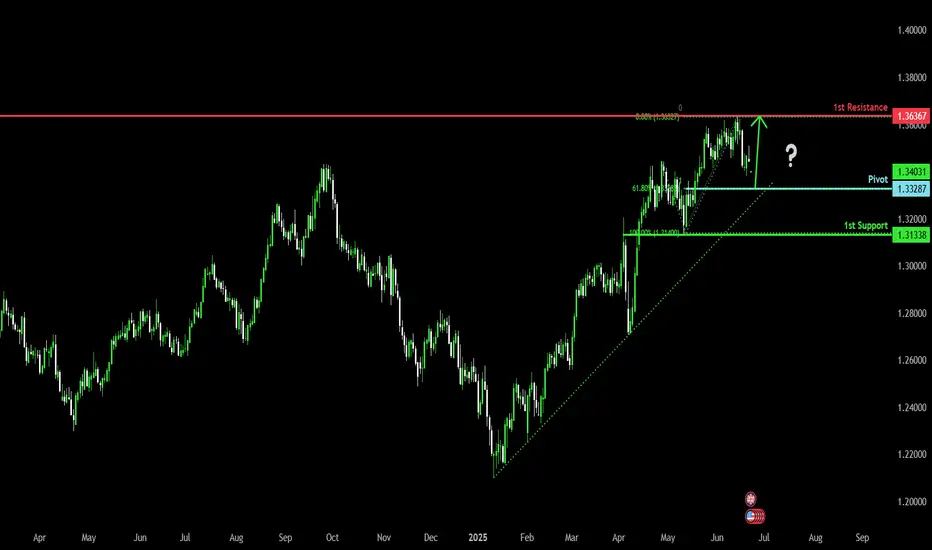
Bullish bounce?The Cable (GBP/USD) is falling towards the pivot and could bounce to the 1st resistance.
Pivot: 1.3328
1st Support: 1.3133
1st Resistance: 1.3636
Risk Warning:
Trading Forex and CFDs carries a high level of risk to your capital and you should only trade with money you can afford to lose. Trading Forex and CFDs may not be suitable for all investors, so please ensure that you fully understand the risks involved and seek independent advice if necessary.
Disclaimer:
The above opinions given constitute general market commentary, and do not constitute the opinion or advice of IC Markets or any form of personal or investment advice.
Any opinions, news, research, analyses, prices, other information, or links to third-party sites contained on this website are provided on an "as-is" basis, are intended only to be informative, is not an advice nor a recommendation, nor research, or a record of our trading prices, or an offer of, or solicitation for a transaction in any financial instrument and thus should not be treated as such. The information provided does not involve any specific investment objectives, financial situation and needs of any specific person who may receive it. Please be aware, that past performance is not a reliable indicator of future performance and/or results. Past Performance or Forward-looking scenarios based upon the reasonable beliefs of the third-party provider are not a guarantee of future performance. Actual results may differ materially from those anticipated in forward-looking or past performance statements. IC Markets makes no representation or warranty and assumes no liability as to the accuracy or completeness of the information provided, nor any loss arising from any investment based on a recommendation, forecast or any information supplied by any third-party.