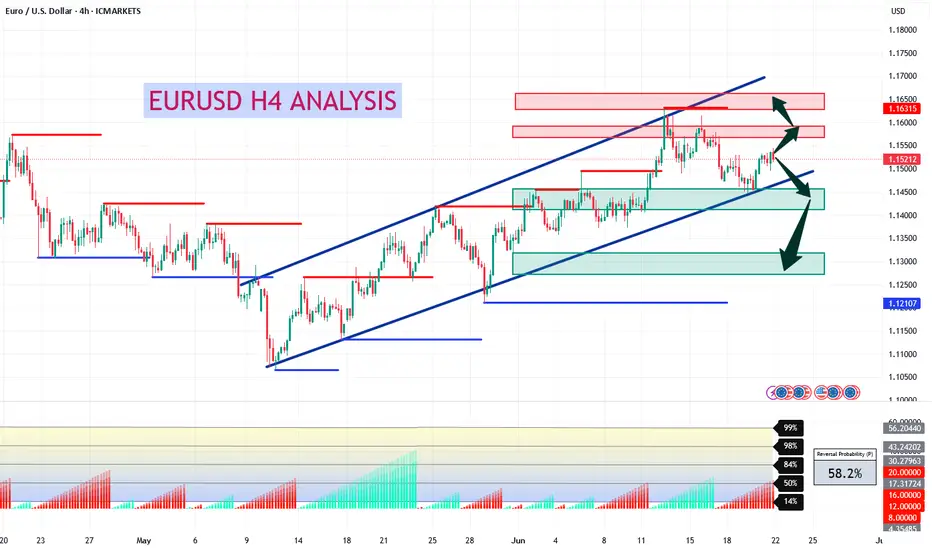
EURUSD H4 AnalysisEURUSD Showing a bullish Flag. If it breaks this zone above, Most probably can fly up to 1.15818 and higher to 1.16322. If no, Can rally between 1.14320, 1.13067 or even lower. Trading Analysis from 23-06-25 to 27-06-25. Take your risk under control and wait for market to break support or resistance on smaller time frame. Best of luck everyone and happy trading.🤗
Forexsignals
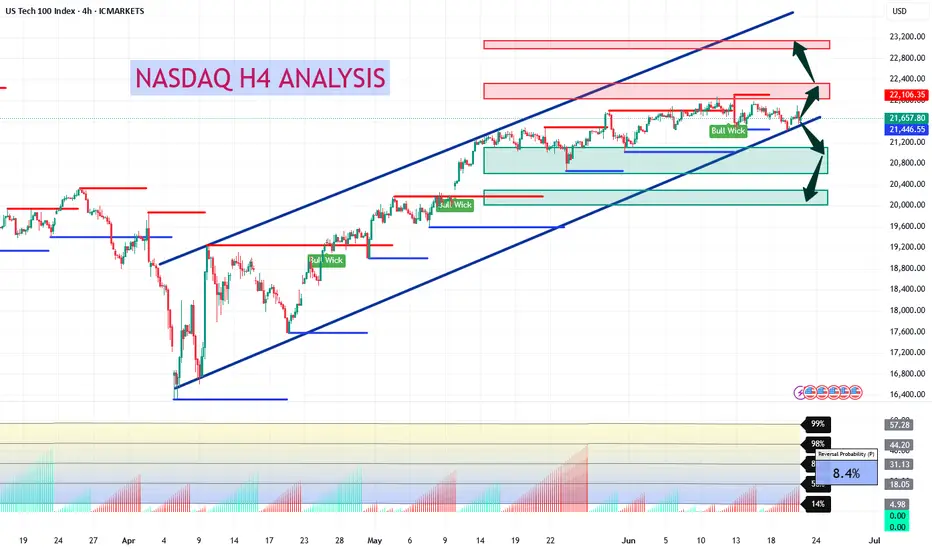
USTECH H4 AnalysisUSTECH Showing a bullish Flag. If it breaks this zone above, Most probably can fly up to 22,106.35 and higher TO 23,200. If no, Can rally between 20,800, 20,400 or even lower. Trading Analysis from 23-06-25 to 27-06-25. Take your risk under control and wait for market to break support or resistance on smaller time frame. Best of luck everyone and happy trading.🤗
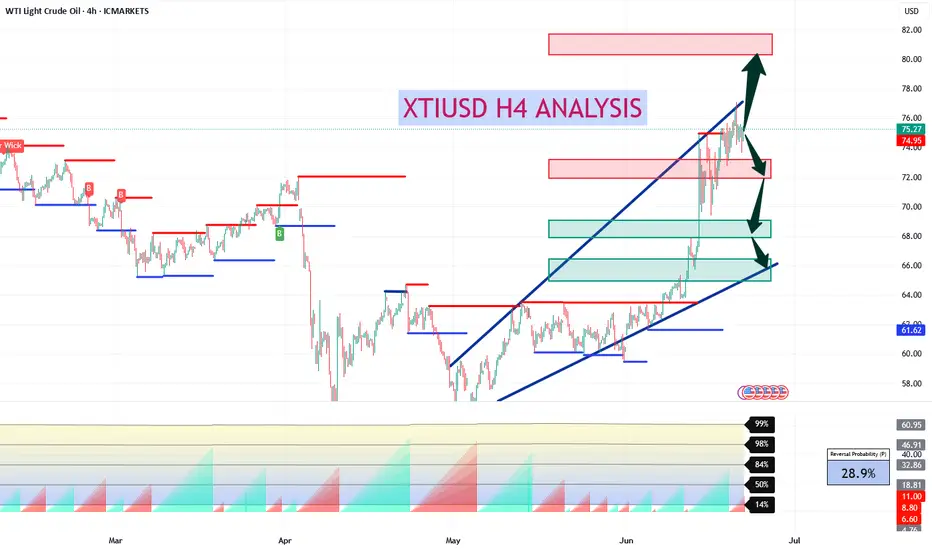
XTIUSD H4 AnalysisXTIUSD Showing a bearish Flag. If it breaks this zone above, Most probably can fly upto 81.00 and higher. If no, Can rally between 72, 68 or even 66. Trading Analysis from 23-06-25 to 27-06-25. Take your risk under control and wait for market to break support or resistance on smaller time frame. Best of luck everyone and happy trading.🤗
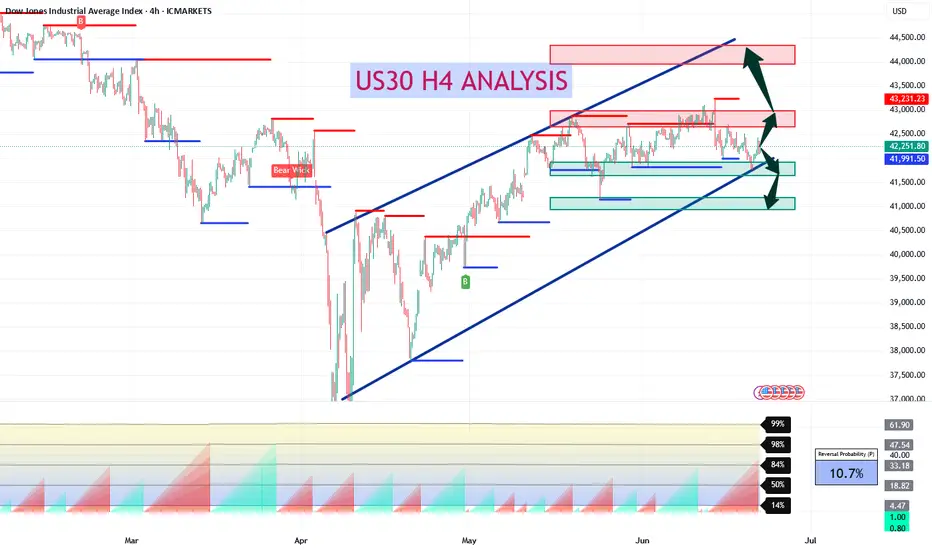
US30 H4 AnalysisUS30 Showing a bullish Flag to 42,762. If it breaks this zone, Most probably can fly upto 44,000 and higher. Trading Analysis from 23-06-25 to 27-06-25. Take your risk under control and wait for market to break support or resistance on smaller time frame. Best of luck everyone and happy trading.🤗
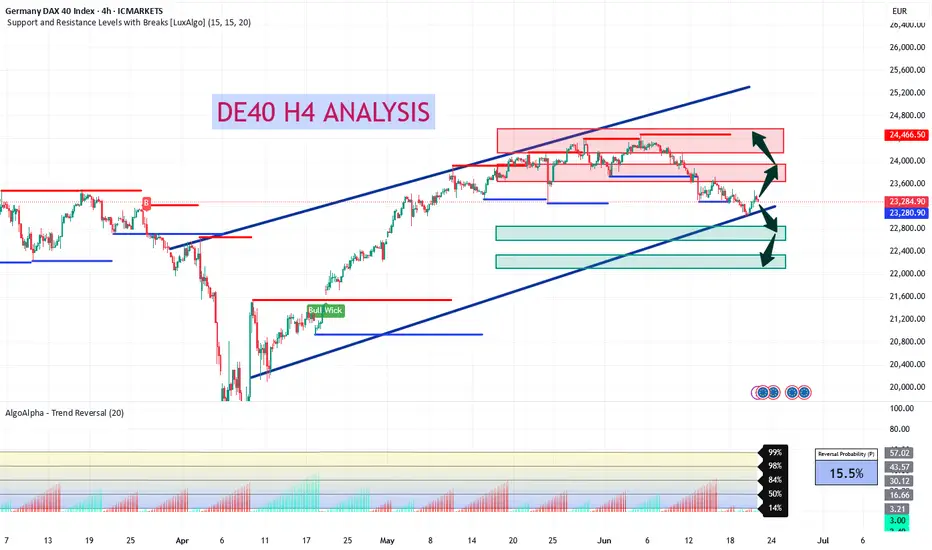
DE40 H4 Analysis 23 Jul to 27 Jul - Bullish FlagDE40 Showing a bullish Flag 23,735 - 23,800. If it breaks this zone, Most probably can fly upto 24,466 and higher. Take your risk under control and wait for market to break support or resistance on smaller time frame. Best of luck everyone and happy trading.🤗
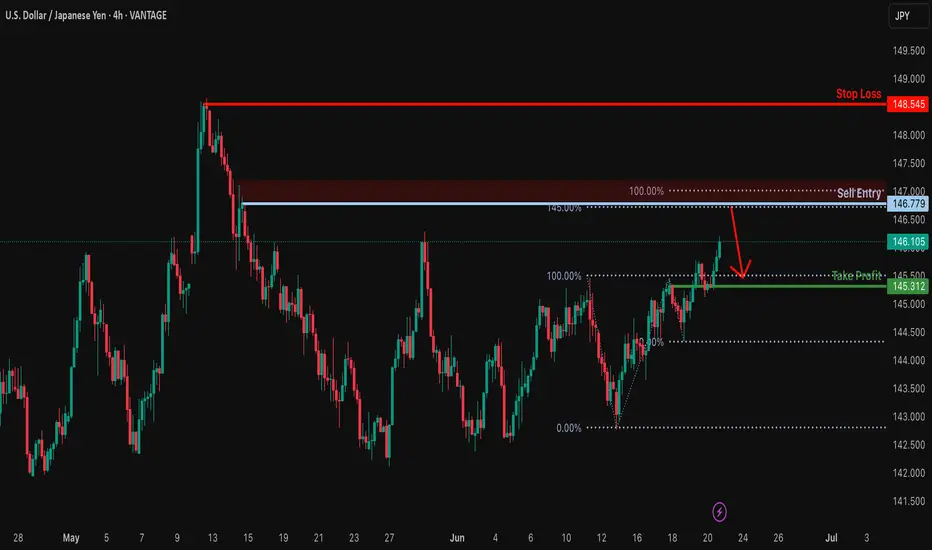
Heading into pullback resistance?USD/JPY is rising towards the resistance level which is a pullback resistance that aligns with the 145% Fibonacci extension and also slightly below the 100% Fibonacci projection and could drop from this level to our take profit.
Entry: 146.77
Why we like it:
There is a pullback resistance level that lines up with the 145% Fibonacci extension and also slightly below the 100% Fibonacci projection.
Stop loss: 148.54
Why we like it:
There is a pullback resistance level.
Take profit: 145.31
Why we like it:
There is an overlap support level.
Enjoying your TradingView experience? Review us!
Please be advised that the information presented on TradingView is provided to Vantage (‘Vantage Global Limited’, ‘we’) by a third-party provider (‘Everest Fortune Group’). Please be reminded that you are solely responsible for the trading decisions on your account. There is a very high degree of risk involved in trading. Any information and/or content is intended entirely for research, educational and informational purposes only and does not constitute investment or consultation advice or investment strategy. The information is not tailored to the investment needs of any specific person and therefore does not involve a consideration of any of the investment objectives, financial situation or needs of any viewer that may receive it. Kindly also note that past performance is not a reliable indicator of future results. Actual results may differ materially from those anticipated in forward-looking or past performance statements. We assume no liability as to the accuracy or completeness of any of the information and/or content provided herein and the Company cannot be held responsible for any omission, mistake nor for any loss or damage including without limitation to any loss of profit which may arise from reliance on any information supplied by Everest Fortune Group.
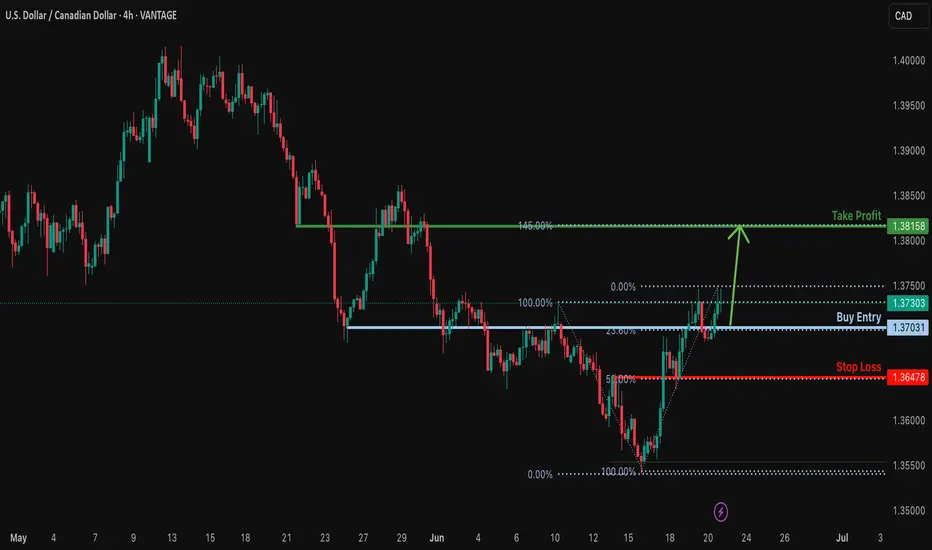
Bullish bounce off pullback support?USD/CAD has bounced off the support level which is a pullback support that lines up with the 23.6% Fibonacci retracement and could rise from this level to our take profit.
Entry: 1.3703
Why we like it:
There is a pullback support level that lines up with the 23.6% Fibonacci retracement.
Stop loss: 1.3647
Why we like it:
There is an overlap support that lines up with the 50% Fibonacci retracement.
Take profit: 1.3815
Why we like it:
There is a pullback resistance that aligns with the 145% Fibonacci extension.
Enjoying your TradingView experience? Review us!
Please be advised that the information presented on TradingView is provided to Vantage (‘Vantage Global Limited’, ‘we’) by a third-party provider (‘Everest Fortune Group’). Please be reminded that you are solely responsible for the trading decisions on your account. There is a very high degree of risk involved in trading. Any information and/or content is intended entirely for research, educational and informational purposes only and does not constitute investment or consultation advice or investment strategy. The information is not tailored to the investment needs of any specific person and therefore does not involve a consideration of any of the investment objectives, financial situation or needs of any viewer that may receive it. Kindly also note that past performance is not a reliable indicator of future results. Actual results may differ materially from those anticipated in forward-looking or past performance statements. We assume no liability as to the accuracy or completeness of any of the information and/or content provided herein and the Company cannot be held responsible for any omission, mistake nor for any loss or damage including without limitation to any loss of profit which may arise from reliance on any information supplied by Everest Fortune Group.
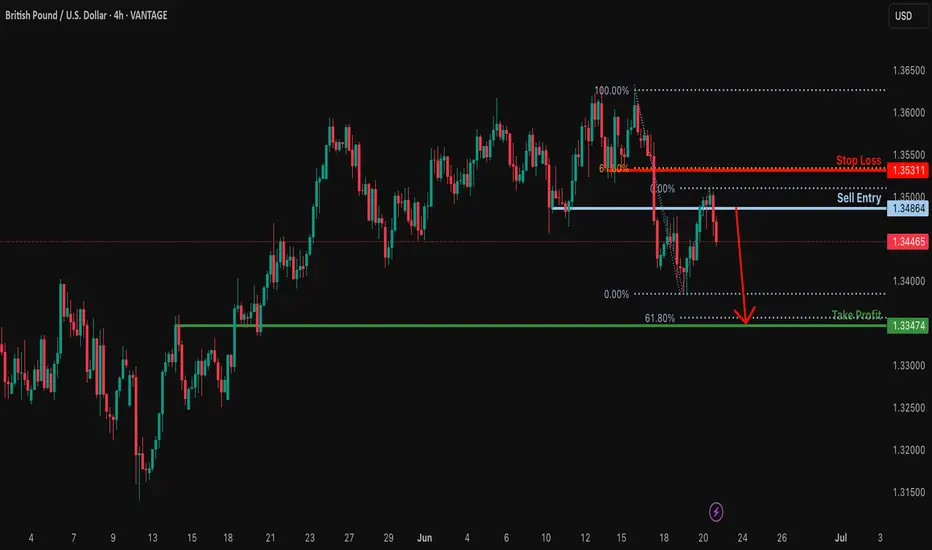
Bearish drop off pullback resistance?GBP/USD has rejected off the resistance level which is a pullback resistance and could drop from this level to our take profit.
Entry: 1.3486
Why we like it:
There is a pullback resistance level.
Stop loss: 1.3531
Why we like it:
There is a pullback resistance level that aligns with the 61.8% Fibonacci retracement.
Take profit: 1.3347
Why we like it:
There is a pullback support level that lines up with the 61.8% Fibonacci projection.
Enjoying your TradingView experience? Review us!
Please be advised that the information presented on TradingView is provided to Vantage (‘Vantage Global Limited’, ‘we’) by a third-party provider (‘Everest Fortune Group’). Please be reminded that you are solely responsible for the trading decisions on your account. There is a very high degree of risk involved in trading. Any information and/or content is intended entirely for research, educational and informational purposes only and does not constitute investment or consultation advice or investment strategy. The information is not tailored to the investment needs of any specific person and therefore does not involve a consideration of any of the investment objectives, financial situation or needs of any viewer that may receive it. Kindly also note that past performance is not a reliable indicator of future results. Actual results may differ materially from those anticipated in forward-looking or past performance statements. We assume no liability as to the accuracy or completeness of any of the information and/or content provided herein and the Company cannot be held responsible for any omission, mistake nor for any loss or damage including without limitation to any loss of profit which may arise from reliance on any information supplied by Everest Fortune Group.
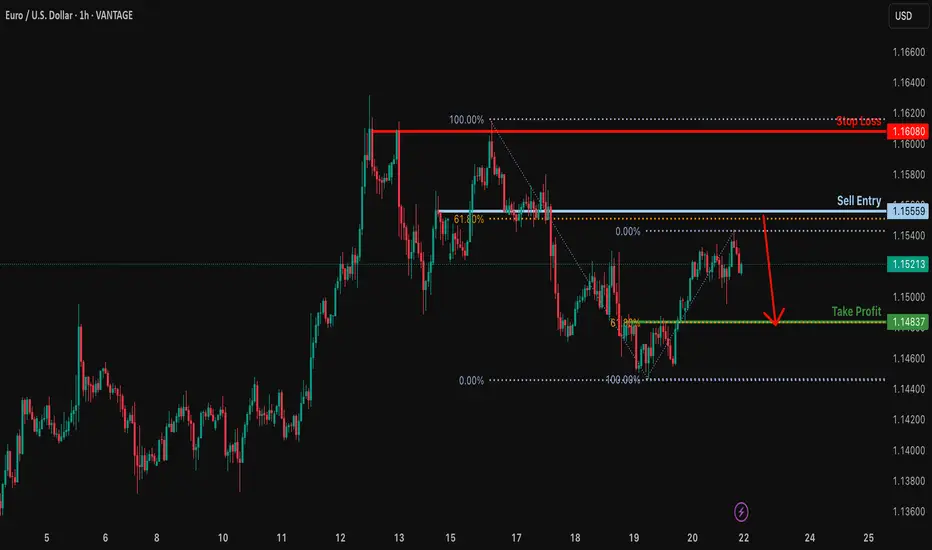
Bearish reversal?EUR/USD is rising towards the resistance level which is a pullback resistance that lines up with the 61.8% Fibonacci retracement and could reverse from this level to our take profit.
Entry: 1.1555
Why we like it:
There is a pullback resistance that lines up with the 61.8% Fibonacci retracement.
Stop loss: 1.1608
Why we like it:
There is a pullback resistance.
Take profit: 1.1483
Why we like it:
There is a pullback support level that aligns with the 61.8% Fibonacci retracement.
Enjoying your TradingView experience? Review us!
Please be advised that the information presented on TradingView is provided to Vantage (‘Vantage Global Limited’, ‘we’) by a third-party provider (‘Everest Fortune Group’). Please be reminded that you are solely responsible for the trading decisions on your account. There is a very high degree of risk involved in trading. Any information and/or content is intended entirely for research, educational and informational purposes only and does not constitute investment or consultation advice or investment strategy. The information is not tailored to the investment needs of any specific person and therefore does not involve a consideration of any of the investment objectives, financial situation or needs of any viewer that may receive it. Kindly also note that past performance is not a reliable indicator of future results. Actual results may differ materially from those anticipated in forward-looking or past performance statements. We assume no liability as to the accuracy or completeness of any of the information and/or content provided herein and the Company cannot be held responsible for any omission, mistake nor for any loss or damage including without limitation to any loss of profit which may arise from reliance on any information supplied by Everest Fortune Group.
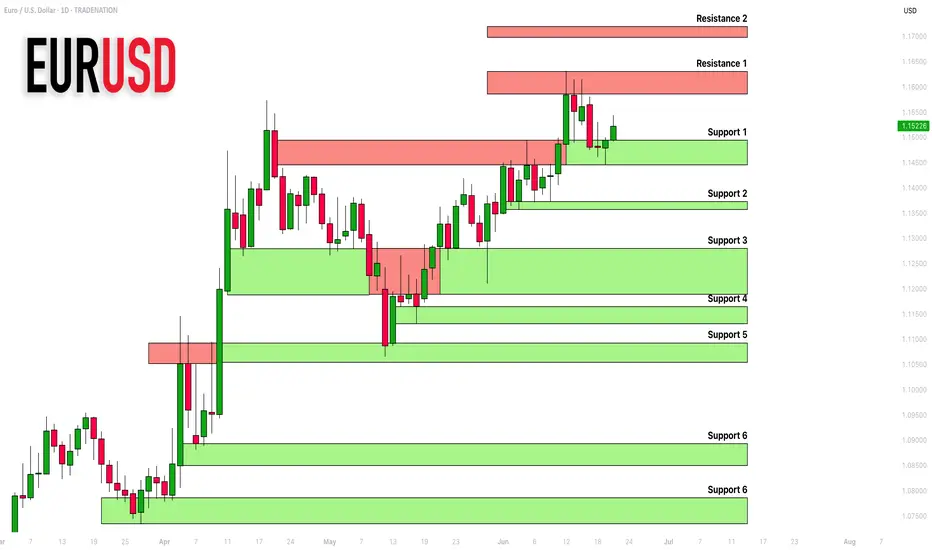
EURUSD: Important Supports & Resistances For Next Week 🇪🇺🇺🇸
Here is my latest structure analysis for EURUSD for next week.
Consider these supports and resistances for breakout/pullback trading.
❤️Please, support my work with like, thank you!❤️
I am part of Trade Nation's Influencer program and receive a monthly fee for using their TradingView charts in my analysis.
EURUSD Gearing Up for Next Leg Up – DXY Weakens After PPI MissToday, key U.S. economic indexes were released, providing fresh insights into inflationary pressures and the state of the labor market:
Core PPI m/m:
Actual: 0.1% | Forecast: 0.3% | Previous: -0.4%
Lower than expected – suggests weaker underlying producer inflation.
PPI m/m:
Actual: 0.1% | Forecast: 0.2% | Previous: -0.5%
Slight miss – overall inflation at the producer level remains soft.
Unemployment Claims:
Actual: 248K | Forecast: 242K | Previous: 247K
Slightly higher than forecast – signaling some cooling in the labor market.
Market Outlook :
These data releases point toward cooling inflation and softness in job growth, which may strengthen the dovish narrative around the Fed’s next move.
DXY Index ( TVC:DXY ) is under pressure, and EURUSD ( FX:EURUSD ) is showing signs of bullish momentum .
-----------------------------------------------------------
Now let's take a look at the EURUSD chart on the 1-hour time frame .
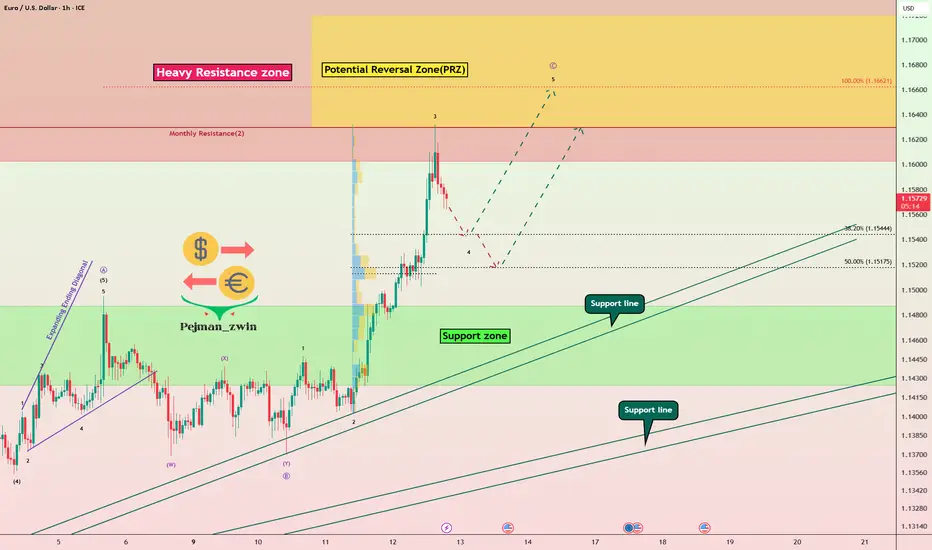
EURUSD is trading near the Heavy Resistance zone($1.182-$1.160) and Monthly Resistance(2) .
In terms of Elliott Wave theory , EURUSD appears to be completing microwave 4 . Microwave 4 could be completed at one of the Fibonacci levels .
I expect EURUSD to attack the Heavy Resistance zone($1.182-$1.160) at least once more after completing microwave 4 and could even rise to the Potential Reversal Zone(PRZ) .
Note: If EURUSD touches $1.1446 , we can expect more dump.
Please respect each other's ideas and express them politely if you agree or disagree.
Euro/U.S. Dollar Analyze (EURUSD), 1-hour time frame.
Be sure to follow the updated ideas.
Do not forget to put a Stop loss for your positions (For every position you want to open).
Please follow your strategy and updates; this is just my Idea, and I will gladly see your ideas in this post.
Please do not forget the ✅' like '✅ button 🙏😊 & Share it with your friends; thanks, and Trade safe.
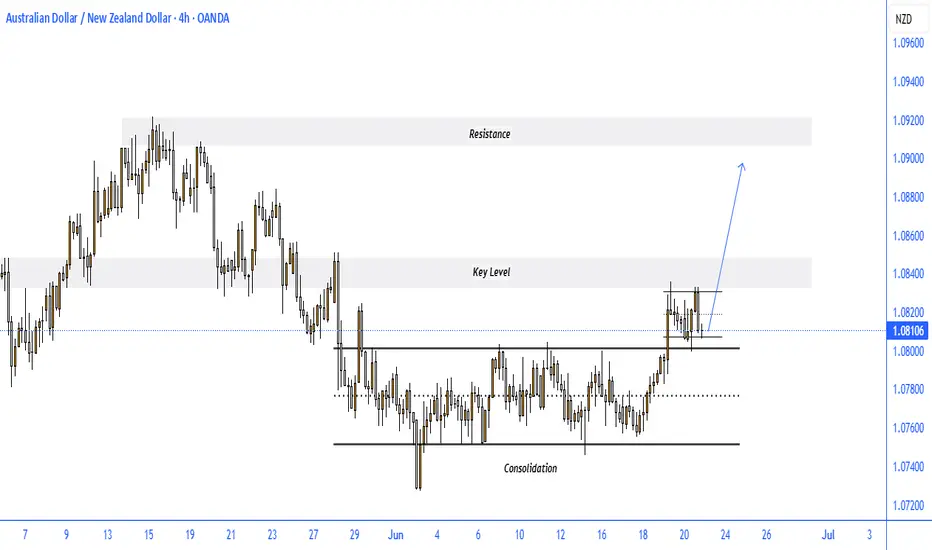
AUDNZD BULLISH SETUPThe 4-hour chart of AUD/NZD shows a strong bullish breakout from a prolonged consolidation phase, followed by a healthy retest of the breakout level, suggesting the pair is gearing up for further upside.
Key Observations:
Consolidation Breakout: After spending several weeks in a tight consolidation range between 1.0760–1.0800, the price has convincingly broken above the range resistance near 1.0810.
Key Level Retest: The breakout zone (previous resistance) is now acting as new support, confirmed by multiple rejections (highlighted area).
Bullish Momentum: Structure is forming higher highs and higher lows, indicating continuation of upward trend.
Upside Target: With the breakout holding, the next logical target lies near the resistance zone around 1.0910, which served as a previous swing high.
Conclusion:
AUD/NZD is showing bullish strength after breaking out of consolidation and holding above the retested key level. As long as 1.0800–1.0810 support holds, the pair remains poised for a bullish continuation toward the 1.0900–1.0920 resistance zone. A break below this level would invalidate the setup and bring price back into the previous range.
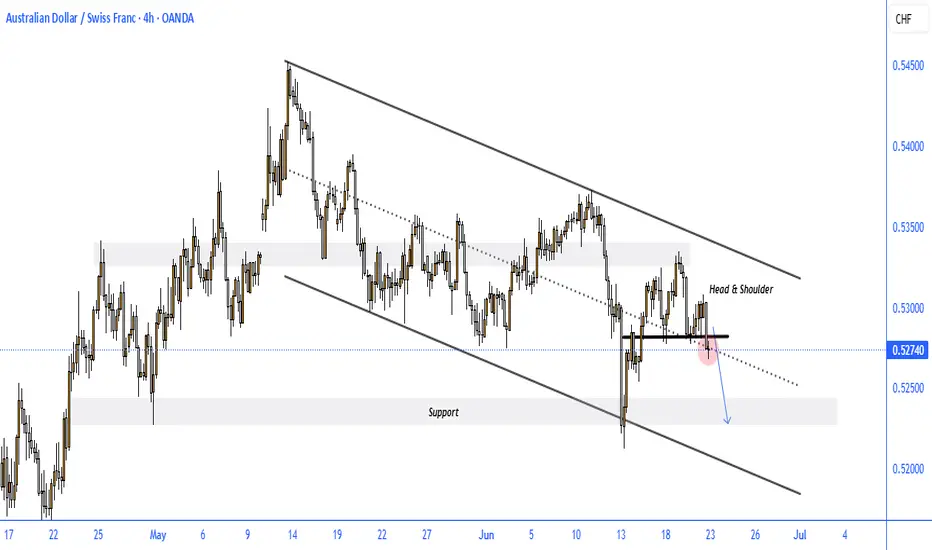
AUDCHF BEARISH SETUPThe AUD/CHF 4-hour chart is presenting a classic Head & Shoulders pattern within a well-defined bearish descending channel, signaling a likely continuation to the downside if neckline support fails.
Key Observations:
Bearish Channel in Play: The broader trend remains bearish, with price action respecting both channel boundaries.
Head & Shoulders Formation: A visible Head & Shoulders pattern has formed near the top of the channel, with the neckline around 0.5275.
Neckline Break Risk: Price is currently testing the neckline area (highlighted in red). A confirmed break below would likely trigger bearish momentum.
Downside Target: A break below the neckline could push AUD/CHF toward the support zone near 0.5220, in line with the lower boundary of the channel.
Trend Structure: Lower highs and lower lows continue to dominate, reinforcing the bearish bias.
Conclusion:
AUD/CHF remains technically weak, and the emerging Head & Shoulders breakdown may act as a strong continuation signal within the existing downtrend channel. A clear close below 0.5270 could open the door for a further drop toward 0.5220. Caution is warranted for bulls unless a significant reversal signal emerges.
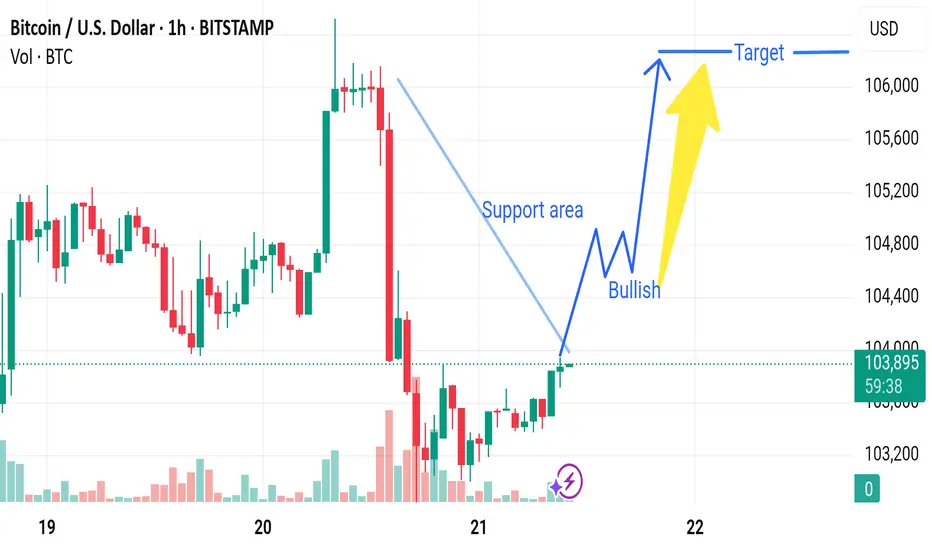
Market next target 🔄 Disruption Analysis:
1. Weak Support Confirmation
The chart marks a "Support area," but there is no strong confirmation (e.g., a hammer or engulfing bullish candle with high volume).
Support zones are more reliable with multiple prior bounces; here, it seems newly identified and not yet validated.
2. Bearish Volume Signature
During the recent decline (before the support), the red volume bars are significantly larger, indicating strong selling pressure.
The recovery candles near support have low volume, which may signal lack of conviction from bulls.
3. Lower Highs Formation
Prior to the drop, we see a series of lower highs, hinting at weakening bullish momentum.
This could suggest a potential bearish continuation, especially if price fails to break above the last local high (~106,000).
4. Possible Bearish Retest
Instead of a bullish breakout, the current price might just be retesting the broken support-turned-resistance.
This is a common bull trap scenario where prices bounce slightly before resuming downward.
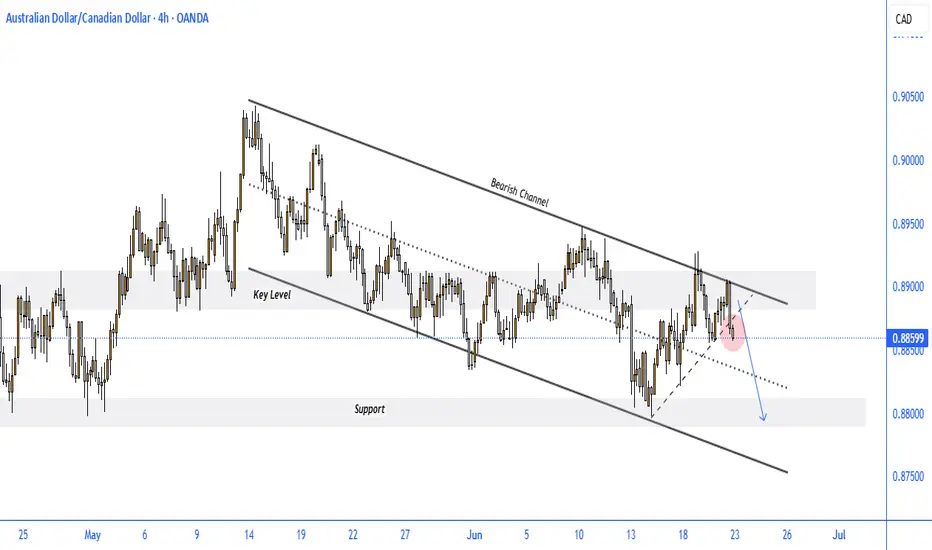
AUDCAD BEARISH SETUPThe 4-hour chart for AUD/CAD shows a well-respected bearish descending channel, where price action remains capped below a strong dynamic resistance. Price recently rejected a key resistance zone near 0.8900, signaling a potential continuation to the downside.
Key Observations:
Bearish Channel Intact: Price continues to respect the upper and lower bounds of the descending channel.
Key Resistance Rejection: The pair tested the 0.8900 resistance area and faced immediate rejection (highlighted in red), forming a lower high.
Break of Trendline: A rising trendline from the recent low has been broken, reinforcing bearish pressure.
Support Zone in Sight: If bearish momentum continues, the next major support lies around 0.8780 – 0.8800, offering a possible target area.
Short-term Setup: Minor upward retracement may retest the broken trendline, but unless 0.8900 is breached, the bias remains strongly bearish.
Conclusion:
AUD/CAD remains under bearish control within the descending channel. The recent rejection from the upper boundary and break of the rising trendline suggest a high-probability move toward the 0.8800 support zone. Traders should look for confirmation of lower highs or bearish engulfing patterns to position short.
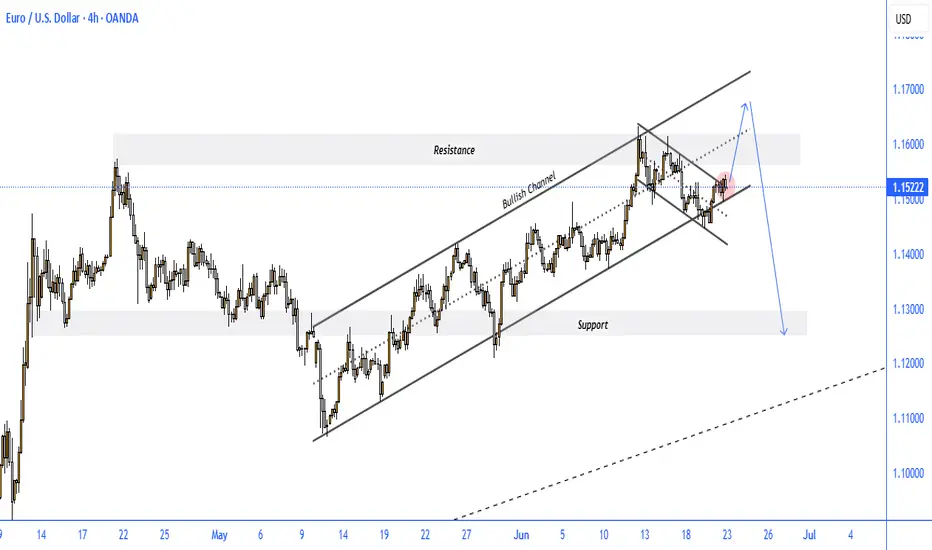
EURUSD BEARISH SETUP
The EUR/USD 4-hour chart reflects a significant technical setup, showing price action within a bullish ascending channel that has recently broken to the downside, forming a falling wedge pattern—typically a bullish continuation signal.
Key Observations:
Bullish Channel Broken: The price broke below the ascending channel earlier this month, signaling initial weakness.
Falling Wedge Formation: A bullish falling wedge has developed, and the pair is now testing its upper boundary near 1.1522, attempting a breakout.
Resistance Zone: The price is approaching a key resistance area between 1.1550 – 1.1600, which aligns with previous highs and the wedge's upper edge.
Scenario Projection:
A temporary bullish breakout toward the resistance zone is expected.
If the pair gets rejected from this resistance, a sharp decline toward the major support area near 1.1300 is likely.
Bearish Confirmation: A clear rejection at the resistance zone followed by a break below the recent minor support (red zone) would confirm the bearish move.
Conclusion:
While short-term bullish momentum may push EUR/USD slightly higher, the confluence of resistance levels suggests a high probability of rejection. Traders should watch for reversal signals in the 1.1550–1.1600 zone, as failure to break higher could lead to a bearish move toward 1.1300 in the coming days.
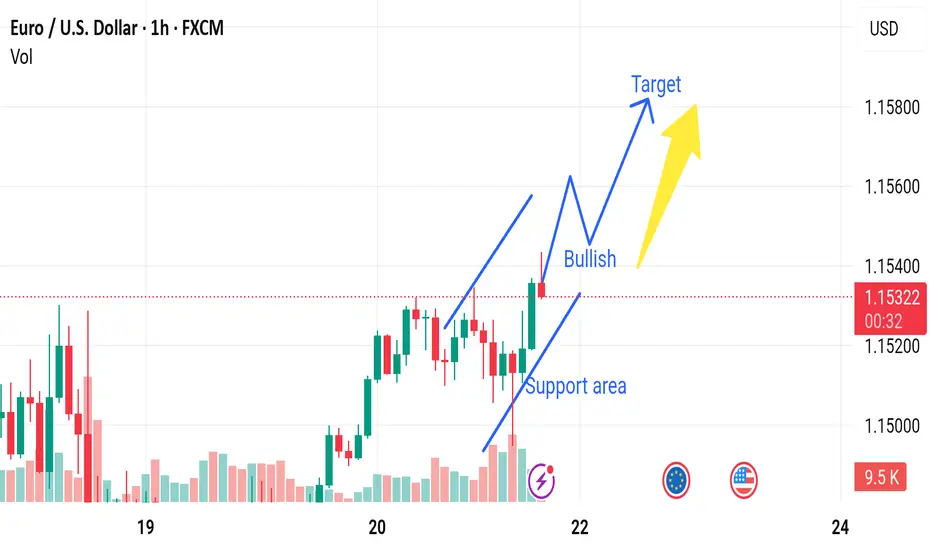
Market next move Disruption to Bullish Scenario:
1. Resistance Zone Around 1.1540 – 1.1550
The price is approaching a psychological and potential resistance level around 1.1540–1.1550.
If the bulls fail to break this zone convincingly, a rejection could lead to a pullback or reversal.
2. Bearish Divergence in Volume
Despite upward movement in price, the volume doesn't show a strong bullish breakout. If momentum weakens while price rises, it might indicate a bearish divergence.
3. Rising Wedge Formation
The current price channel resembles a rising wedge, which is typically a bearish pattern.
A breakdown from this pattern (below the “support area” trendline) could trigger a sell-off toward 1.1500 or lower.
4. Economic Data or News Risk
Any sudden USD strength due to economic reports, Federal Reserve commentary, or geopolitical tension could flip the sentiment instantly.
Icons below the chart hint at upcoming news from the Eurozone or U.S., which could lead to volatility.
5. Overbought Condition
If technical indicators like RSI or MACD (not shown in this chart) are in overbought territory, a correction or profit-taking may happen soon.
Market next move 🔄 Disruption: Bullish Setup Building?
🧠 Problems With Bearish Interpretation:
1. Volume Surge Might Be Re-Accumulation:
Volume at the purple lightning symbol is rising — this could signal buyer interest, not distribution.
Green candles in this zone suggest aggressive buying on dips.
2. Failed Breakdown Earlier:
Price had a strong drop but bounced sharply, recovering nearly all losses.
That type of V-recovery often traps early shorts, leading to a rally.
3. Resistance Retest Might Be Breakout Setup:
The red box marks resistance, but price is consolidating just below it.
That’s typically bullish if no strong rejection occurs — classic “base before breakout.”
4. No Lower Low Yet:
Market structure still holding.
Until price breaks below ~$35.80, the bearish thesis remains speculative.

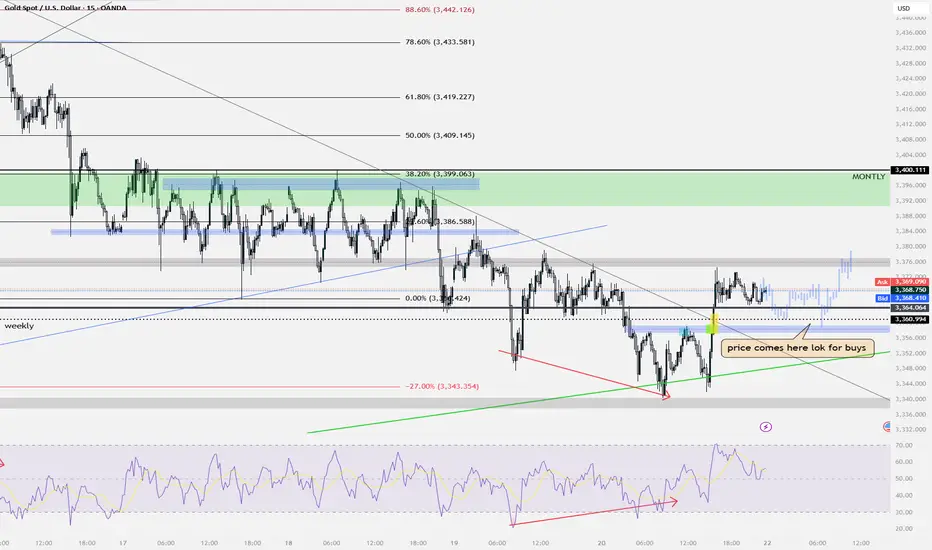
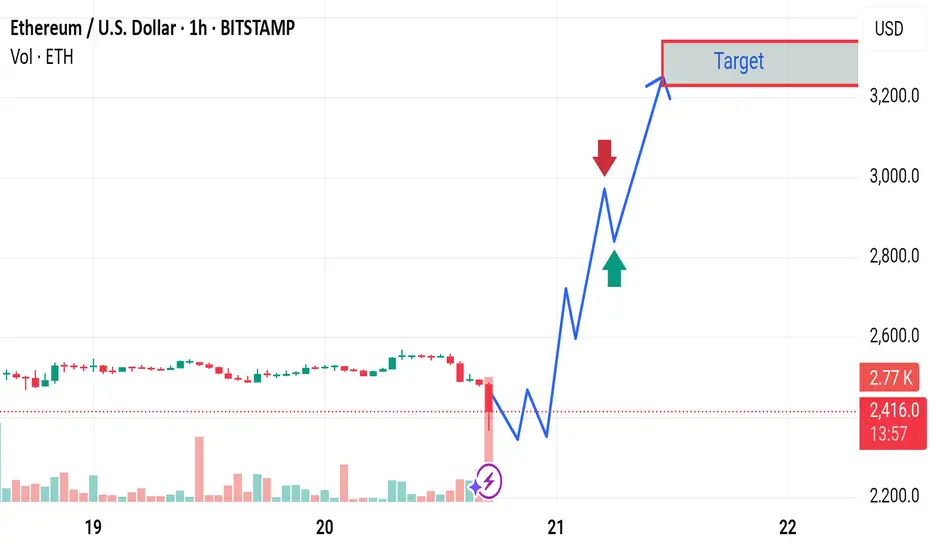
Market next target 📉 Original View (Bearish Outlook):
Predicts a downward move from around $3,370 to the target near $3,250.
Sharp drop illustrated with zigzag downward arrows.
Yellow arrow highlights growing volume — likely interpreted as early selling pressure.
---
🔄 Disruption: Bullish Reversal or Trap Setup
🧠 Problems With Bearish Thesis:
1. Volume Spike Might Indicate Demand:
The yellow arrow highlights a volume surge, but this might be buyer absorption, not selling dominance.
If this volume came during a wick-heavy candle or hammer, it suggests buying interest at lows.
2. No Break of Major Support Yet:
Price is still above $3,350, a key psychological and technical zone.
No clear breakdown has occurred — the downtrend is assumed, not confirmed.
3. Oversold Momentum?
Momentum indicators (not shown) may reveal oversold conditions, making a short-term rebound more probable.

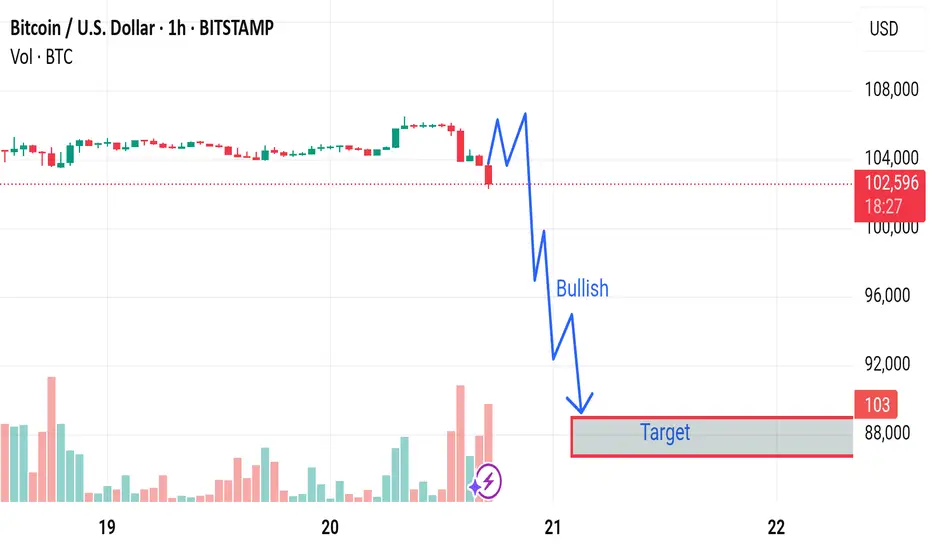
Market next move 🔄 Disrupted Analysis: Bullish Counter-Scenario
🧠 Original Bias:
The chart predicts a strong bearish move, with a target around 88,000 USD.
The label "Bullish" seems misleading as it’s placed in a steep downward move.
---
📉 Issues With the Original Analysis:
1. Volume Misinterpretation:
Increasing red volume could indicate capitulation or a temporary panic sell-off, not necessarily the start of a new trend.
A bounce could follow if buyers step in.
2. Support Zone Ignored:
The analysis overlooks any previous support levels in the 100k–98k range, where buyers may be waiting.
3. No Confirmation for Breakdown:
The chart does not show a completed breakdown of a key structure or trendline.
The blue squiggle assumes a breakdown will happen, but no technical confirmation is visible.
---
📈 Disruption Scenario: Bullish Reversal Possible
Rejection from 102k zone could be a liquidity grab, not the start of a downtrend.
Hidden bullish divergence on RSI or MACD (not shown here) could support a bounce.
Market next forecast 🔄 Disrupted Analysis: Bullish Counter-Scenario
🧠 Original Bias:
The chart predicts a strong bearish move, with a target around 88,000 USD.
The label "Bullish" seems misleading as it’s placed in a steep downward move.
---
📉 Issues With the Original Analysis:
1. Volume Misinterpretation:
Increasing red volume could indicate capitulation or a temporary panic sell-off, not necessarily the start of a new trend.
A bounce could follow if buyers step in.
2. Support Zone Ignored:
The analysis overlooks any previous support levels in the 100k–98k range, where buyers may be waiting.
3. No Confirmation for Breakdown:
The chart does not show a completed breakdown of a key structure or trendline.
The blue squiggle assumes a breakdown will happen, but no technical confirmation is visible.
---
📈 Disruption Scenario: Bullish Reversal Possible
Rejection from 102k zone could be a liquidity grab, not the start of a downtrend.
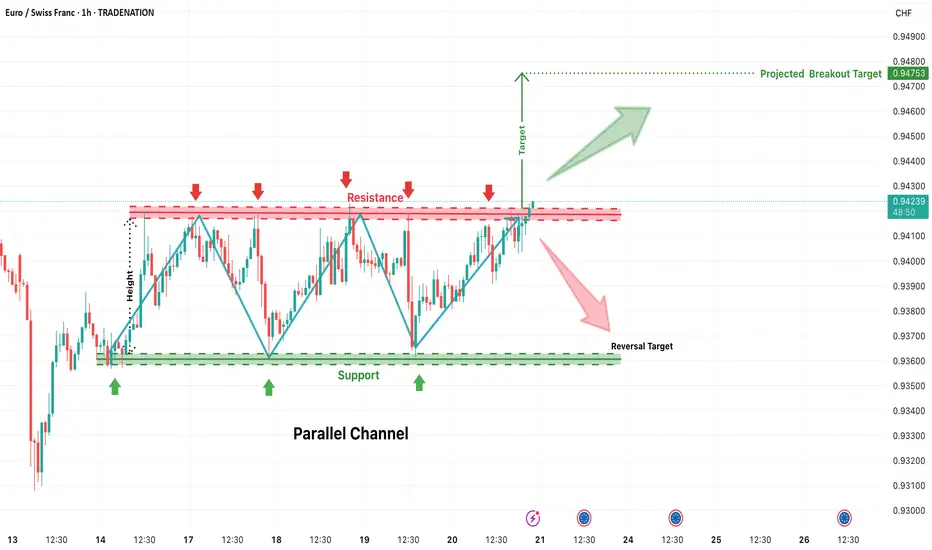
EUR/CHF Parallel Channel Breakout WatchThe EUR/CHF pair has been trading within a well-defined parallel channel on the 1-hour timeframe. The price action is contained between a strong resistance zone near 0.9420–0.9425 (marked in red) and a support zone near 0.9365–0.9370 (marked in green). Multiple rejections from both the top and bottom of the range indicate solid market structure and participation from both buyers and sellers.
This type of formation often leads to explosive moves when the price eventually breaks out of the consolidation range. The current chart shows price testing the upper boundary of the channel once again, and now attempting a bullish breakout.
📈 Bullish Breakout Scenario
If the price sustains above the resistance zone (confirmed breakout), we could see a continuation of bullish momentum toward the projected breakout target near 0.9475. This target is calculated using the height of the channel added to the breakout level, a classic price projection method. A strong candle close above the resistance with volume would validate this move. Traders may look for long entries on breakout confirmation or on a successful retest of the resistance zone as new support.
📉 Bearish Reversal Scenario
However, if the breakout fails and price gets rejected again from the red zone, a sharp reversal back toward the support zone around 0.9370 may occur. This would keep the channel intact and suggest continued range-bound movement. A breakdown below support would then be required for further bearish confirmation, leading toward deeper downside targets.
This setup provides a high-probability opportunity in either direction with clearly defined levels and structure. Wait for breakout confirmation before entering to avoid false moves.
=================================================================
Disclosure: I am part of Trade Nation's Influencer program and receive a monthly fee for using their TradingView charts in my analysis.
=================================================================