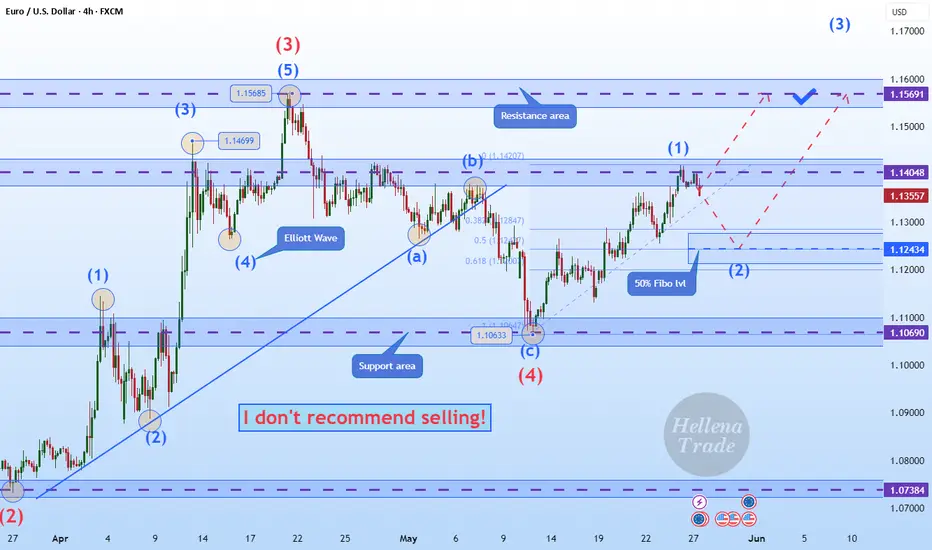
Hellena | EUR/USD (4H): LONG to the resistance area 1.15691.Colleagues, I believe that wave “5” of higher order has actively started an upward movement.
At the moment I see movement in wave “1” of medium order and it means that a correction in wave “2” to the area of 50% Fibonacci level (1.12434) is expected. But I would still advise to consider only upward movement and use pending limit orders.
I see the maximum of wave “3” - resistance area 1.15691 as the target.
Manage your capital correctly and competently! Only enter trades based on reliable patterns!
Forexsignals
USTECPrevious analysis on May 30 found that the price came down to test the support level at 20,693 but could not break through. Now the price has returned to test the resistance level at 21,737-22,139 again. If the price cannot break through the level of 22,139, it is expected that the price will drop. Consider selling in the red zone.
🔥Trading futures, forex, CFDs and stocks carries a risk of loss.
Please consider carefully whether such trading is suitable for you.
>>GooD Luck 😊
❤️ Like and subscribe to never miss a new idea!

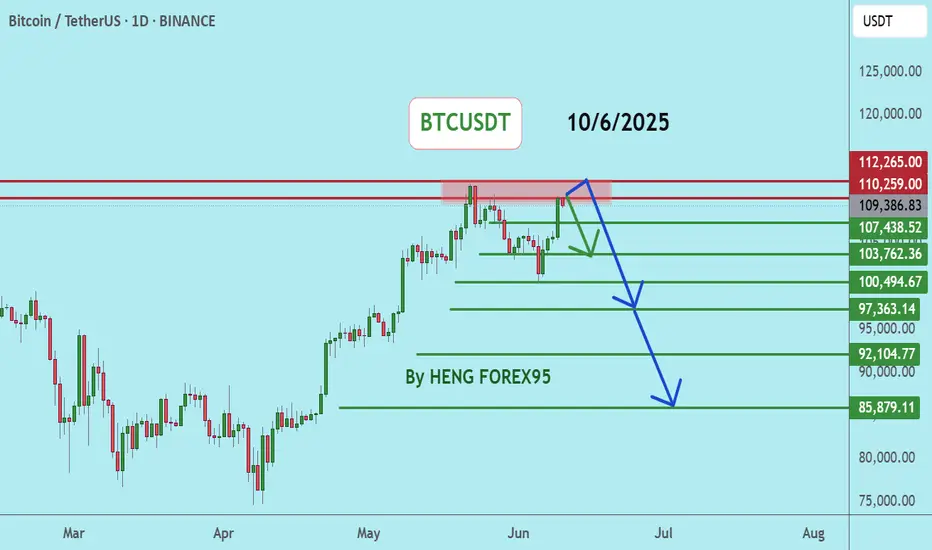
BTCUSDTBTCUSDT price is now near the resistance zone 110259-112265. If the price cannot break through the 112265 level, it is expected that the price will drop. Consider selling the red zone.
🔥Trading futures, forex, CFDs and stocks carries a risk of loss.
Please consider carefully whether such trading is suitable for you.
>>GooD Luck 😊
❤️ Like and subscribe to never miss a new idea!
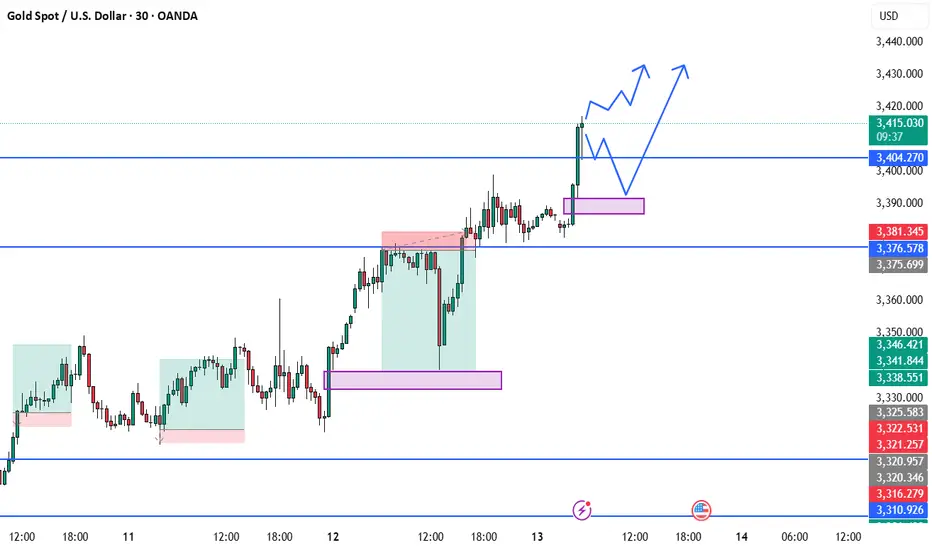
BEST XAUUSD M30 BUY SETUP FOR TODAYGold (XAU/USD) is showcasing strong bullish momentum after breaking above the key resistance zone near $3,404, now acting as fresh support. 🔄 The price formed a bullish structure with clean higher highs and higher lows on the 30-minute chart, confirming buying strength. 🟣 The marked demand zone around $3,392–$3,404 is critical—if price retests and holds this level, we can expect a continuation toward $3,420 and beyond. 🚀📌 Traders should watch for bullish confirmations on pullbacks to this zone for potential long setups. 🧠⚡
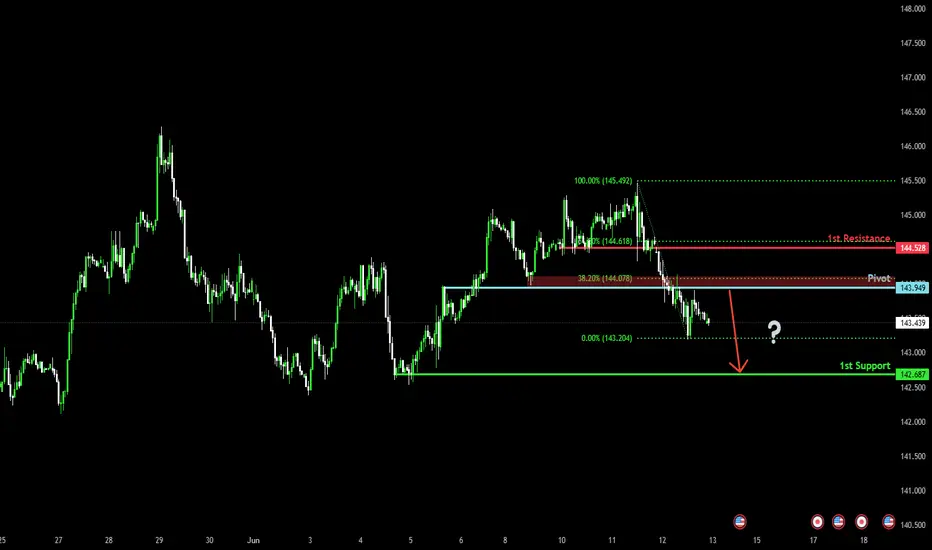
Bearish drop?USD/JPY has rejected off the pivot which is an overlap resistance and could drop to the 1st support.
Pivot: 143.94
1st Support: 142.68
1st Resistance: 144.52
Risk Warning:
Trading Forex and CFDs carries a high level of risk to your capital and you should only trade with money you can afford to lose. Trading Forex and CFDs may not be suitable for all investors, so please ensure that you fully understand the risks involved and seek independent advice if necessary.
Disclaimer:
The above opinions given constitute general market commentary, and do not constitute the opinion or advice of IC Markets or any form of personal or investment advice.
Any opinions, news, research, analyses, prices, other information, or links to third-party sites contained on this website are provided on an "as-is" basis, are intended only to be informative, is not an advice nor a recommendation, nor research, or a record of our trading prices, or an offer of, or solicitation for a transaction in any financial instrument and thus should not be treated as such. The information provided does not involve any specific investment objectives, financial situation and needs of any specific person who may receive it. Please be aware, that past performance is not a reliable indicator of future performance and/or results. Past Performance or Forward-looking scenarios based upon the reasonable beliefs of the third-party provider are not a guarantee of future performance. Actual results may differ materially from those anticipated in forward-looking or past performance statements. IC Markets makes no representation or warranty and assumes no liability as to the accuracy or completeness of the information provided, nor any loss arising from any investment based on a recommendation, forecast or any information supplied by any third-party.
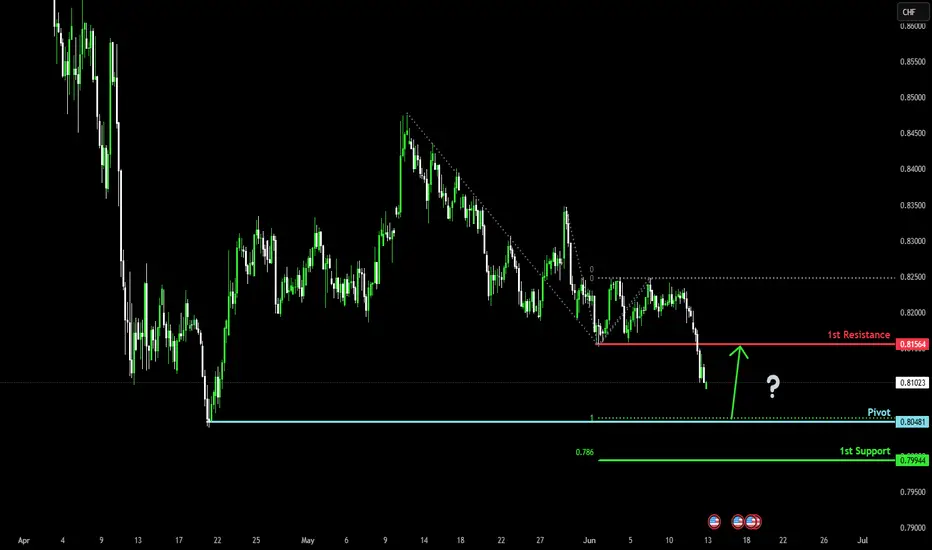
Falling towards major support?USD/CHF is falling towards the pivot and could bounce to the 1st resistance.
Pivot: 0.8048
1st Support: 0.7994
1st Resistance: 0.8156
Risk Warning:
Trading Forex and CFDs carries a high level of risk to your capital and you should only trade with money you can afford to lose. Trading Forex and CFDs may not be suitable for all investors, so please ensure that you fully understand the risks involved and seek independent advice if necessary.
Disclaimer:
The above opinions given constitute general market commentary, and do not constitute the opinion or advice of IC Markets or any form of personal or investment advice.
Any opinions, news, research, analyses, prices, other information, or links to third-party sites contained on this website are provided on an "as-is" basis, are intended only to be informative, is not an advice nor a recommendation, nor research, or a record of our trading prices, or an offer of, or solicitation for a transaction in any financial instrument and thus should not be treated as such. The information provided does not involve any specific investment objectives, financial situation and needs of any specific person who may receive it. Please be aware, that past performance is not a reliable indicator of future performance and/or results. Past Performance or Forward-looking scenarios based upon the reasonable beliefs of the third-party provider are not a guarantee of future performance. Actual results may differ materially from those anticipated in forward-looking or past performance statements. IC Markets makes no representation or warranty and assumes no liability as to the accuracy or completeness of the information provided, nor any loss arising from any investment based on a recommendation, forecast or any information supplied by any third-party.
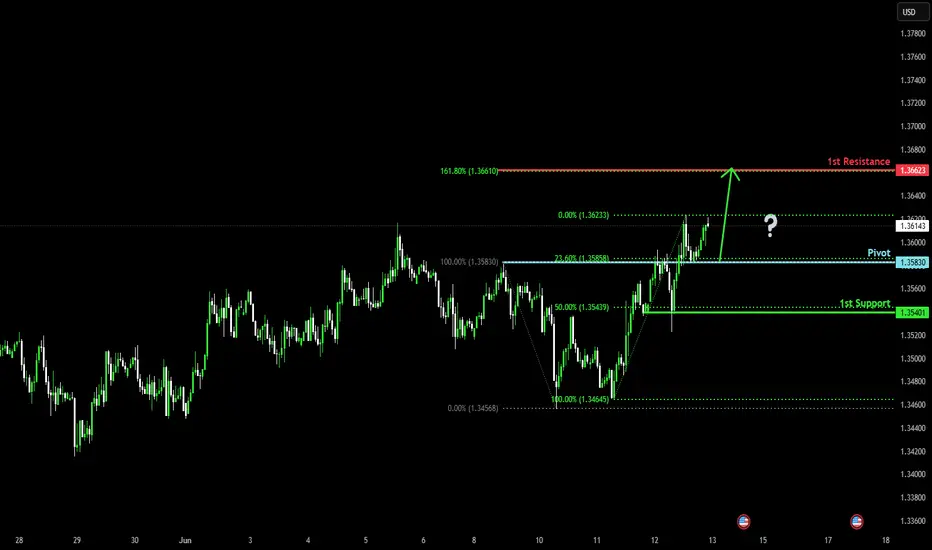
Potential bullish rise?The Cable (GBP/ISD) has bounced off the pivot and could rise to the 1st resistance.
Pivot: 1.3580
1st Support: 1.3540
1st Resistance: 1.3662
Risk Warning:
Trading Forex and CFDs carries a high level of risk to your capital and you should only trade with money you can afford to lose. Trading Forex and CFDs may not be suitable for all investors, so please ensure that you fully understand the risks involved and seek independent advice if necessary.
Disclaimer:
The above opinions given constitute general market commentary, and do not constitute the opinion or advice of IC Markets or any form of personal or investment advice.
Any opinions, news, research, analyses, prices, other information, or links to third-party sites contained on this website are provided on an "as-is" basis, are intended only to be informative, is not an advice nor a recommendation, nor research, or a record of our trading prices, or an offer of, or solicitation for a transaction in any financial instrument and thus should not be treated as such. The information provided does not involve any specific investment objectives, financial situation and needs of any specific person who may receive it. Please be aware, that past performance is not a reliable indicator of future performance and/or results. Past Performance or Forward-looking scenarios based upon the reasonable beliefs of the third-party provider are not a guarantee of future performance. Actual results may differ materially from those anticipated in forward-looking or past performance statements. IC Markets makes no representation or warranty and assumes no liability as to the accuracy or completeness of the information provided, nor any loss arising from any investment based on a recommendation, forecast or any information supplied by any third-party.
Potential bearish drop?USD/JPY is rising towards the resistance level which is a pullback resistance that aligns with the 38.2% Fibonacci retracement and could drop from this level to ur take profit.
Entry: 144.11
Why we like it:
There is a pullback resistance level that lines up with the 38.2% Fibonacci retracement.
Stop loss: 145.07
Why we like it:
There is a pullback resistance level that lines up with the 78.6% Fibonacci retracement.
Take profit: 142.00
Why we like it:
There is a pullback support level that is slightly below the 78.6% Fibonacci projection.
Enjoying your TradingView experience? Review us!
Please be advised that the information presented on TradingView is provided to Vantage (‘Vantage Global Limited’, ‘we’) by a third-party provider (‘Everest Fortune Group’). Please be reminded that you are solely responsible for the trading decisions on your account. There is a very high degree of risk involved in trading. Any information and/or content is intended entirely for research, educational and informational purposes only and does not constitute investment or consultation advice or investment strategy. The information is not tailored to the investment needs of any specific person and therefore does not involve a consideration of any of the investment objectives, financial situation or needs of any viewer that may receive it. Kindly also note that past performance is not a reliable indicator of future results. Actual results may differ materially from those anticipated in forward-looking or past performance statements. We assume no liability as to the accuracy or completeness of any of the information and/or content provided herein and the Company cannot be held responsible for any omission, mistake nor for any loss or damage including without limitation to any loss of profit which may arise from reliance on any information supplied by Everest Fortune Group.

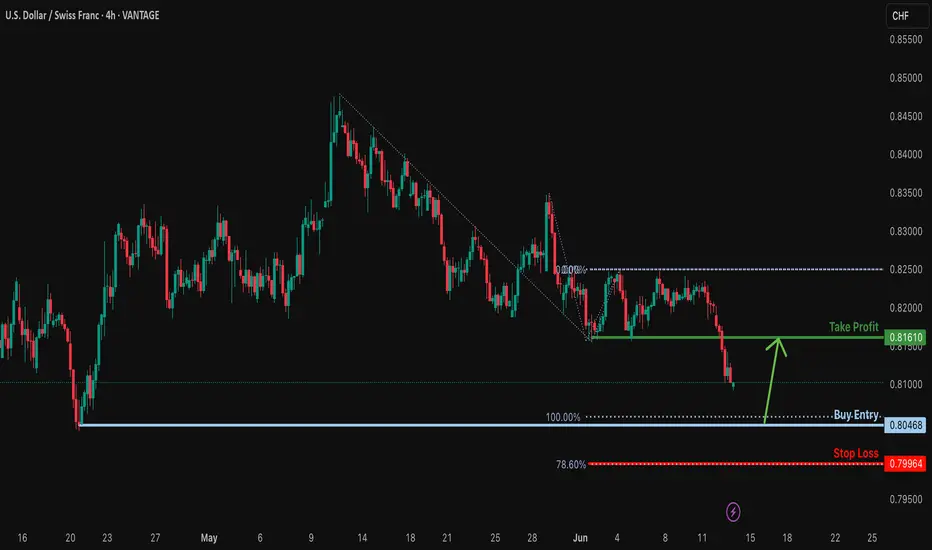
Falling towards pullback support?USD/CHF is falling toward the support level, which is a pullback support aligning with the 100% Fibonacci projection. A bounce from this level could indicate a double bottom pattern, potentially leading to a price rise toward our take profit target.
Entry: 0.8046
Why we like it:
There is a pullback support level that aligns with the 100% Fibonacci projection.
Stop loss: 0.7996
Why we like it:
There is a support level at the 78.6% Fibonacci projection.
Take profit: 0.8161
Why we like it:
There is a pullback resistance level.
Enjoying your TradingView experience? Review us!
Please be advised that the information presented on TradingView is provided to Vantage (‘Vantage Global Limited’, ‘we’) by a third-party provider (‘Everest Fortune Group’). Please be reminded that you are solely responsible for the trading decisions on your account. There is a very high degree of risk involved in trading. Any information and/or content is intended entirely for research, educational and informational purposes only and does not constitute investment or consultation advice or investment strategy. The information is not tailored to the investment needs of any specific person and therefore does not involve a consideration of any of the investment objectives, financial situation or needs of any viewer that may receive it. Kindly also note that past performance is not a reliable indicator of future results. Actual results may differ materially from those anticipated in forward-looking or past performance statements. We assume no liability as to the accuracy or completeness of any of the information and/or content provided herein and the Company cannot be held responsible for any omission, mistake nor for any loss or damage including without limitation to any loss of profit which may arise from reliance on any information supplied by Everest Fortune Group.
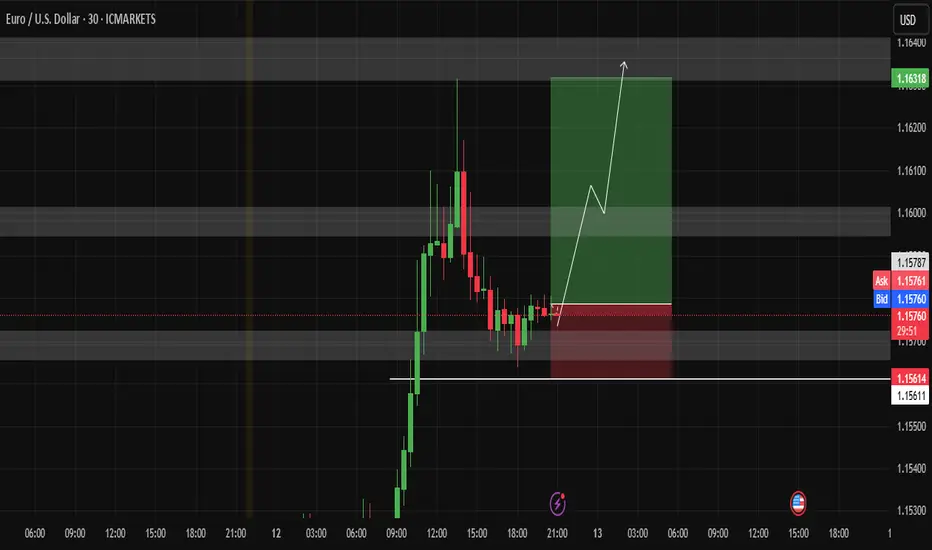
Opportunity to buy EURUSDI see an opportunity to buy the EUR/USD pair from the support shown in the image and the target will be 1.16316
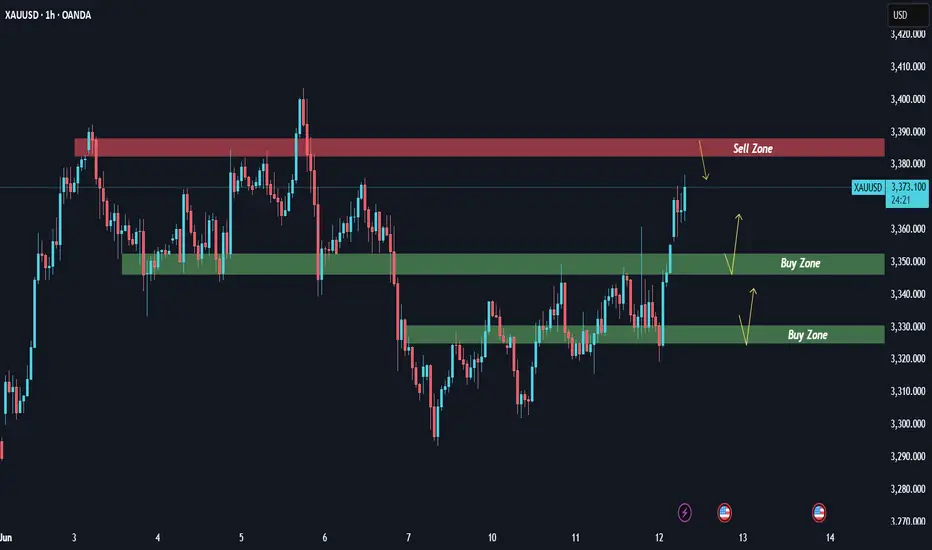
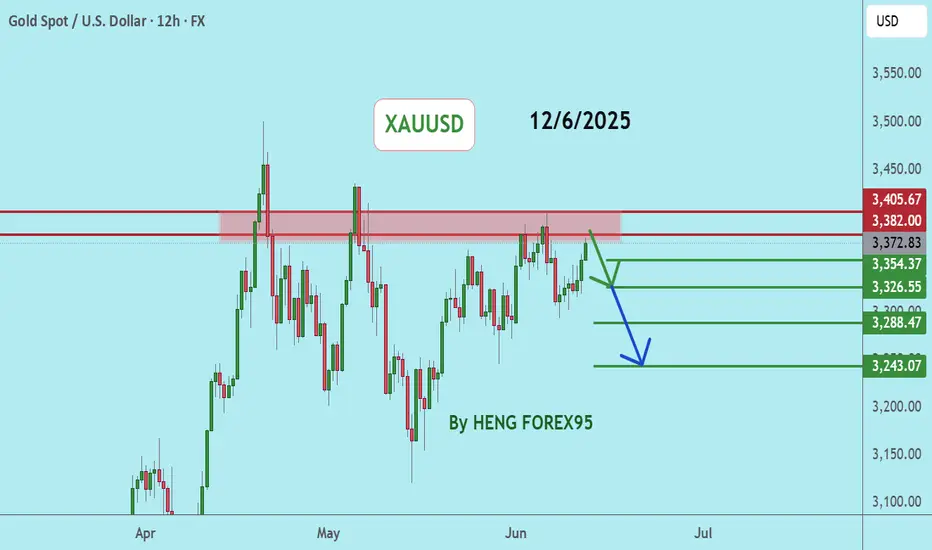
XAUUSD: Analysis June 12XAUUSD is trading within a short-term rising channel.
The market structure remains slightly bullish, with continuous corrections to support zones and then rebounds.
The RSI and MACD indicators have not entered the overbought zone, indicating that there is still room for growth if important support zones are held.
Buy Zone:
1. 3346 – 3350: If the price does not go deep, this is the "retest MA/trendline" zone in the uptrend channel. You can Buy when there is a clear price reaction in this zone.
2. 3330 – 3325: This is a very clear H1 technical support zone. Price may retrace here before bouncing back.
Sell Zone:
3385 - 3390: This is a strong resistance zone on the H1 chart, coinciding with the “Order Block” zone of the sellers. The price may touch and react strongly if there is no breakout momentum.
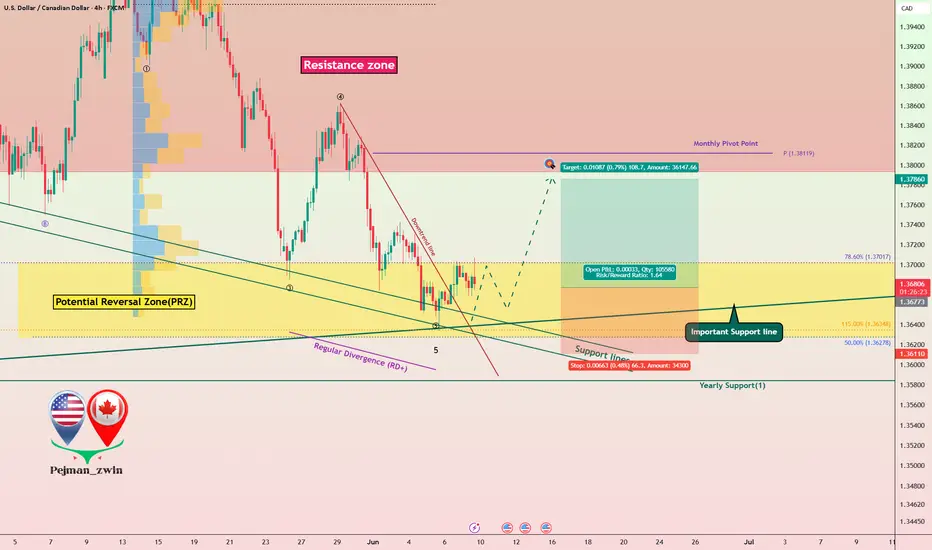
USDCAD Hits Support as Fed-Hawkish & BoC Cuts! Big Bounce ComingUSDCAD ( OANDA:USDCAD ) is trading at the Potential Reversal Zone(PRZ) and near the important Support line and Support lines .
In terms of Elliott Wave theory , it seems that USDCAD has managed to complete 5 main down waves and we can expect more up waves .
Also, we can see the Regular Divergence(RD+) between Consecutive Valleys .
I expect USDCAD to rise to at least 1.37860 CAD.
Fundamental View:
The Bank of Canada initiated its rate-cutting cycle , while the Federal Reserve remains firm with no immediate plans to ease.
Strong NFP data on Friday reinforced USD ( TVC:DXY ) strength .
Oil prices( BLACKBULL:BRENT ) may offer temporary support to CAD , but macro divergences clearly favor the dollar .
Note: Stop Loss(SL)= 1.36110 CAD
U.S Dollar/Canadian Dollar Analyze (USDCAD), 4-hour time frame.
Be sure to follow the updated ideas.
Do not forget to put a Stop loss for your positions (For every position you want to open).
Please follow your strategy; this is just my idea, and I will gladly see your ideas in this post.
Please do not forget the ✅' like '✅ button 🙏😊 & Share it with your friends; thanks, and Trade safe.
EURGBP: Overbought Market & Pullback🇪🇺🇬🇧
EURGBP nicely respected a key daily horizontal resistance.
After a liquidity grab above that, the price formed
a strong bearish imbalance candle on an hourly time frame.
I think that the pair will retrace to 0.85
❤️Please, support my work with like, thank you!❤️
I am part of Trade Nation's Influencer program and receive a monthly fee for using their TradingView charts in my analysis.

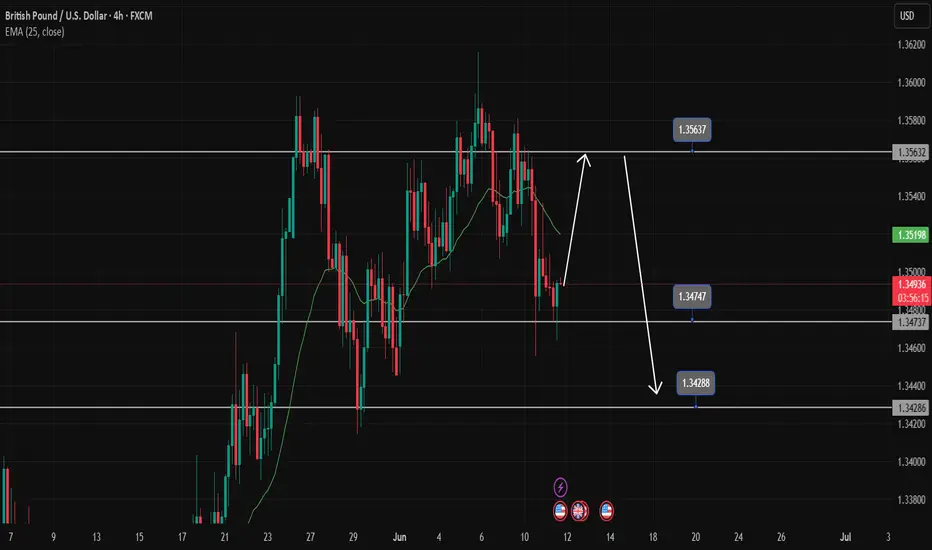
GBPUSD is rising towards the resistance zone of 1.35600GBPUSD is heading towards 1.35600. If the gold price closes around this area, it confirms that the buyers have entered the market. You can set up a BUY signal now with SL placed below the candle wick. After touching 1.356, we can wait for the price reaction and set up a SELL signal again following the sideways border.
Do you agree with our view of buying 1.34900 and SL 1.34600?
Leave a comment
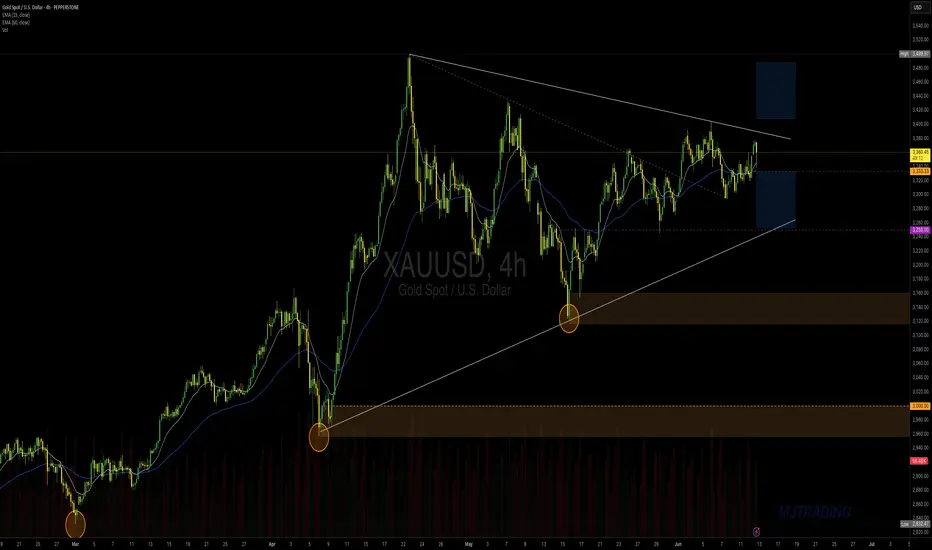
XAUUSD Breakout Brewing -- Squeeze Setup in Play📆 June 12, 2025 | ⏱ 4H Chart Analysis
Gold (XAUUSD) is pressing against a key trendline resistance while holding a clean, ascending trendline from early March — forming a classic triangle squeeze.
🔍 Technical Breakdown:
The long-term bullish trendline has been respected three times, with each touch followed by strong buying interest (see orange circles).
Current price action is compressing between this trendline and descending resistance, tightening toward a potential breakout zone.
Two likely outcomes on the table:
🔺 Bullish Scenario: A confirmed breakout above $3,385 could fuel a rally toward $3,500–$3,520, especially if momentum accelerates.
🔻 Bearish Scenario: Breakdown below $3,260 risks deeper correction toward the $3,000 psychological level, aligning with prior demand zones.
📊 Indicators Insight:
EMA(15) & EMA(60) have flattened → signaling potential volatility expansion ahead.
Volume is building slightly, adding weight to a coming move.
=================================================================
⚖️ Trade Idea (Not Financial Advice)
🟢 Buy on breakout above 3,385, Target: 3,500+
🔴 Sell on breakdown below 3,260, Target: 3,000
📌 Wait for confirmation and avoid chasing within the squeeze range.
💬 What's your take — will gold break through or bounce back?
📌 Follow for consistent multi-timeframe setups across Gold, Silver, and FX majors — 2–3 times weekly.
#XAUUSD #Gold #TechnicalAnalysis #BreakoutSetup #Forex #EMA #SqueezePlay #TrianglePattern #tradingview #MJTrading
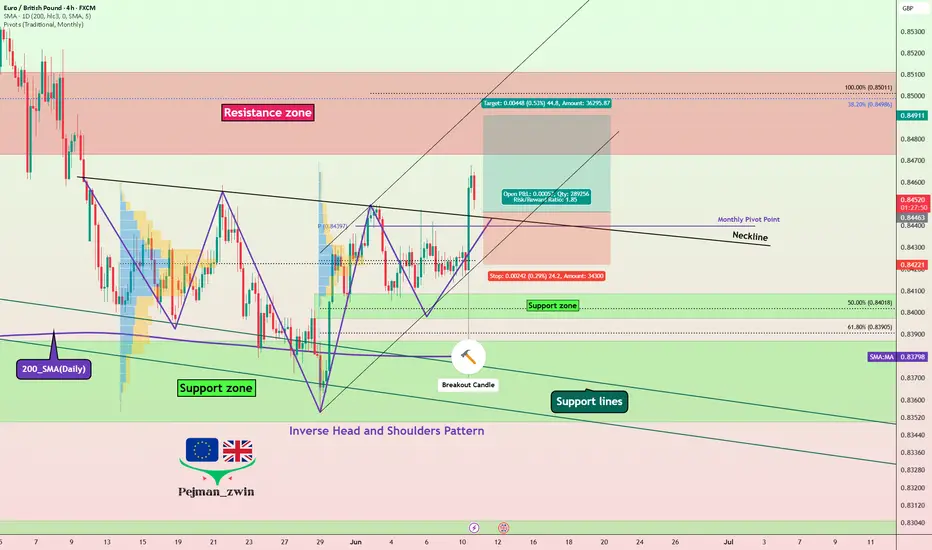
Inverse H&S Breakout! EURGBP Eyes Resistance Zone Amid Eurozone EURGBP ( OANDA:EURGBP ) is moving between two Support zone(0.83870 GBP-0.83500 GBP) and Resistance zone(0.8511 GBP-0.8470 GBP) .
In terms of Classic Technical Analysis , EURGBP has managed to break the Neckline of the Inverse Head and Shoulders Pattern .
I expect EURGBP to rise to at least 0.84911 GBP and attack the Resistance zone(0.8511 GBP- 0.8470 GBP) .
-----------------------------------------------------------
EURGBP Fundamental Analysis:
1. Eurozone (EUR) Overview :
The Eurozone economy has shown moderate recovery signs after pandemic disruptions.
Inflation remains a concern, but the European Central Bank (ECB) is expected to maintain or even tighten monetary policy gradually to combat inflation.
Economic data such as GDP growth and industrial production are mixed but generally indicate slow growth.
Political stability in the Eurozone is relatively steady compared to the UK.
The ECB’s forward guidance leans towards cautious optimism, supporting EUR strength over time.
2. United Kingdom (GBP) Overview :
The UK economy faces several challenges, including slower growth prospects compared to the Eurozone.
Inflation has been high but the Bank of England (BoE) has been raising interest rates aggressively to control it.
Political uncertainties related to Brexit aftermath, trade deals, and fiscal policies have created some volatility.
Consumer confidence and retail sales have shown signs of weakness in recent months.
Overall, the BoE’s hawkish stance is strong, but economic fundamentals are less robust compared to the Eurozone.
3. Comparative Factors Favoring EUR Long :
The Eurozone's relatively better economic stability and growth prospects support EUR strength.
UK economic challenges and political uncertainties weaken GBP.
ECB’s more gradual tightening approach may prevent shocks, making EUR attractive.
Brexit-related trade issues continue to pose risks for GBP.
4. Risks to Consider :
Unexpected ECB dovish moves could weaken EUR.
Positive UK economic surprises or faster-than-expected BoE tightening might strengthen GBP.
External shocks like geopolitical tensions can affect risk sentiment, impacting both currencies.
-----------------------------------------------------------
Note: Stop Loss(SL)= 0.84221 GBP
Euro/British Pound Analyze (EURGBP), 4-hour time frame.
Be sure to follow the updated ideas.
Do not forget to put a Stop loss for your positions (For every position you want to open).
Please follow your strategy; this is just my idea, and I will gladly see your ideas in this post.
Please do not forget the ✅' like '✅ button 🙏😊 & Share it with your friends; thanks, and Trade safe.
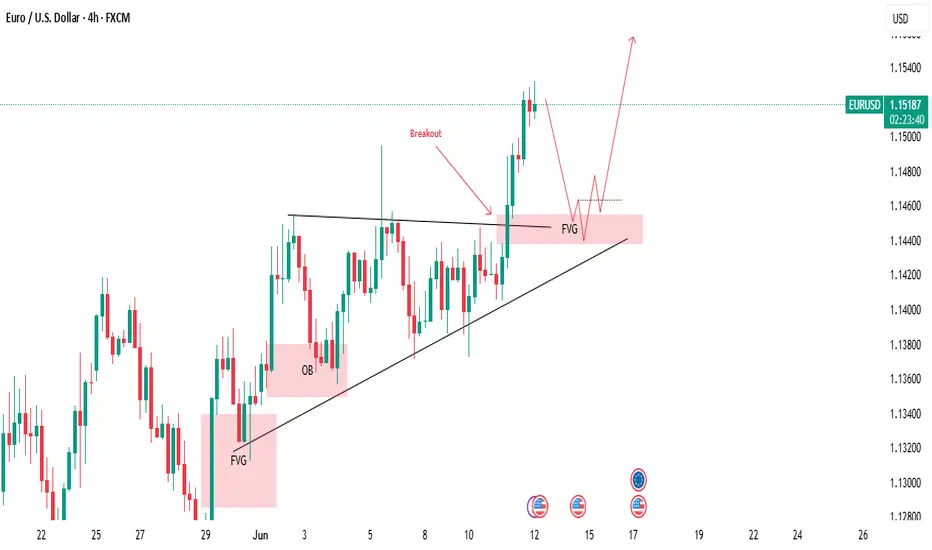
Let the market pull back toward the marked FVG.🚨 EUR/USD Traders – Eyes on This Setup! 💹
The market has been respecting a trendline over the past few days, bouncing off support and climbing steadily. 🧗♂️ While doing so, it’s also been tapping into Fair Value Gaps (FVGs)—a clear sign of smart money interest. 📊
🔥 And guess what? We’ve just seen a breakout above the trendline resistance! This could be the beginning of a strong bullish move. BUT… patience is key! 🕰️
📉 Let the market pull back toward the marked FVG zone. If it does, that could give us a golden buy opportunity with high potential upside! 🚀
🧠 Always remember: Do Your Own Research (DYOR)
📛 Not Financial Advice – Trade Smart!
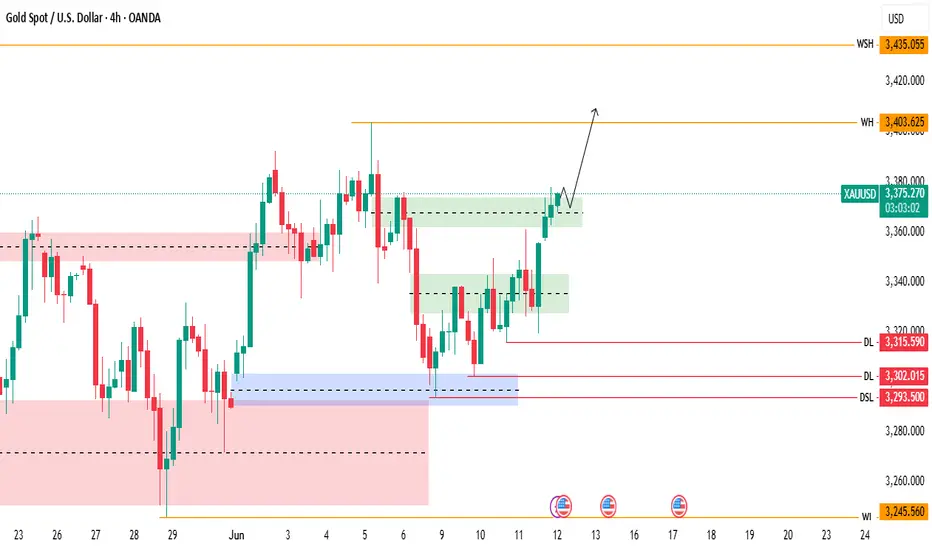
At present, the market has invalidated the 4-hour bearish FVG.Gold Market Update:
The gold market is currently moving upward after previously sweeping the liquidity below the previous day's lows. This liquidity grab typically signals the exhaustion of bearish momentum, and in this case, it appears to have served as a springboard for the current upward movement.
Notably, the bearish PD arrays (Price Delivery Arrays)—which are often indicative of bearish structure and order flow—are currently failing to hold. This failure suggests a weakening of bearish pressure and a possible shift in market sentiment toward bullishness.
At present, the market has invalidated the 4-hour bearish Fair Value Gap (FVG) and successfully closed above it. This is a significant development, as it often implies that the price is rejecting lower levels and building strength to push further upward. In simple terms, the market has absorbed the bearish imbalance and chosen to go higher, showing strong bullish intent.
Given this scenario, it's reasonable to interpret that the market is now aiming for higher levels, specifically toward the previous weekly high—marked on the chart with the line labeled "WH" (Weekly High). The price action suggests that the market is in the mood to test or reach that level in the near term.
However, this is not a guarantee. It's essential to watch the market closely for further confirmation signals before making any trading decisions. Additional confirmations could come from continuation patterns, bullish structure formations, or order flow alignment.
---
Reminder:
Always Do Your Own Research (DYOR) before making any financial decisions.
This is not financial advice.
XAUUSD, GoldGold is in a correction phase. If the price cannot break through the $3429 level, it is expected that the price will drop. Consider selling in the red zone.
🔥Trading futures, forex, CFDs and stocks carries a risk of loss.
Please consider carefully whether such trading is suitable for you.
>>GooD Luck 😊
❤️ Like and subscribe to never miss a new idea!
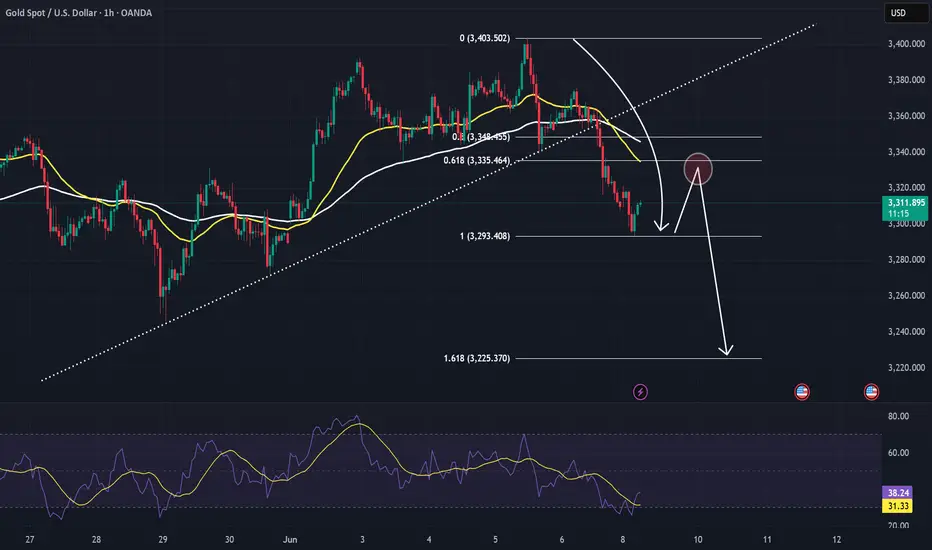
XAUUSD analysis - potential for pullback and continuationOANDA:XAUUSD is currently consolidating near $3,310 after a decisive breakdown below the ascending trendline, signaling a shift in the short-term structure from bullish to bearish. This breakdown was accompanied by strong bearish momentum, indicating that buyers have temporarily lost control of the market.
After the initial drop, the price is now attempting to retrace toward the 0.5–0.618 Fibonacci zone, with the 0.618 level located around $3,335. This zone also coincides with dynamic resistance from short-term moving averages (EMA cluster), making it an important confluence area. A rejection from this level would confirm a bearish retest, supporting the idea of a continuation toward the 1.618 Fibonacci extension near the $3,225 level.
However, if the price breaks and holds above $3,348, the bearish scenario will be invalidated, potentially signaling that buyers are regaining strength and may aim to reclaim higher resistance levels.
Traders are advised to wait for confirmation, such as a bearish engulfing candle, rejection wicks, or a surge in volume, before entering short positions. As always, this is a personal viewpoint, not financial advice. Trade with appropriate risk management.
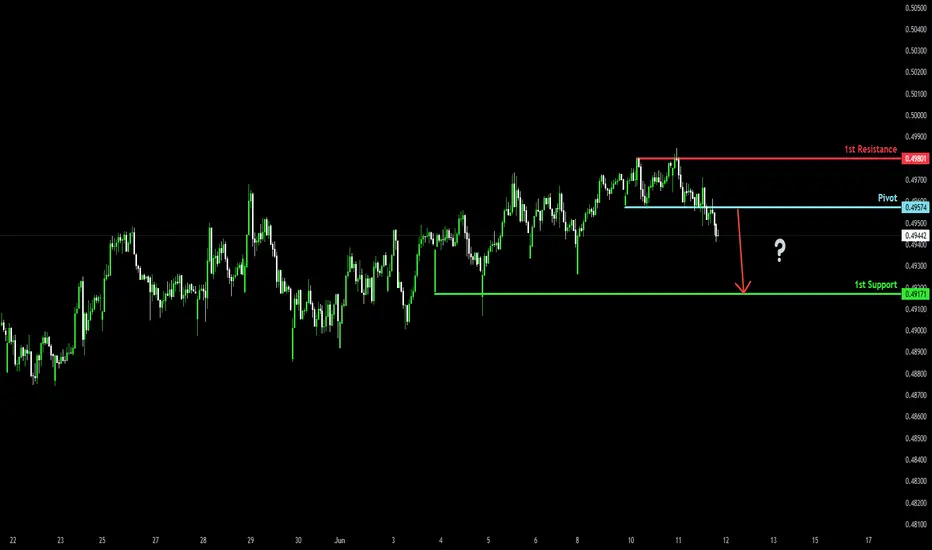
Bearish drop?NZD/CHF has reacted off the pivot and could drop to the 1st support.
Pivot: 0.49574
1st Support: 0.49171
1st Resistance: 0.49801
Risk Warning:
Trading Forex and CFDs carries a high level of risk to your capital and you should only trade with money you can afford to lose. Trading Forex and CFDs may not be suitable for all investors, so please ensure that you fully understand the risks involved and seek independent advice if necessary.
Disclaimer:
The above opinions given constitute general market commentary, and do not constitute the opinion or advice of IC Markets or any form of personal or investment advice.
Any opinions, news, research, analyses, prices, other information, or links to third-party sites contained on this website are provided on an "as-is" basis, are intended only to be informative, is not an advice nor a recommendation, nor research, or a record of our trading prices, or an offer of, or solicitation for a transaction in any financial instrument and thus should not be treated as such. The information provided does not involve any specific investment objectives, financial situation and needs of any specific person who may receive it. Please be aware, that past performance is not a reliable indicator of future performance and/or results. Past Performance or Forward-looking scenarios based upon the reasonable beliefs of the third-party provider are not a guarantee of future performance. Actual results may differ materially from those anticipated in forward-looking or past performance statements. IC Markets makes no representation or warranty and assumes no liability as to the accuracy or completeness of the information provided, nor any loss arising from any investment based on a recommendation, forecast or any information supplied by any third-party.
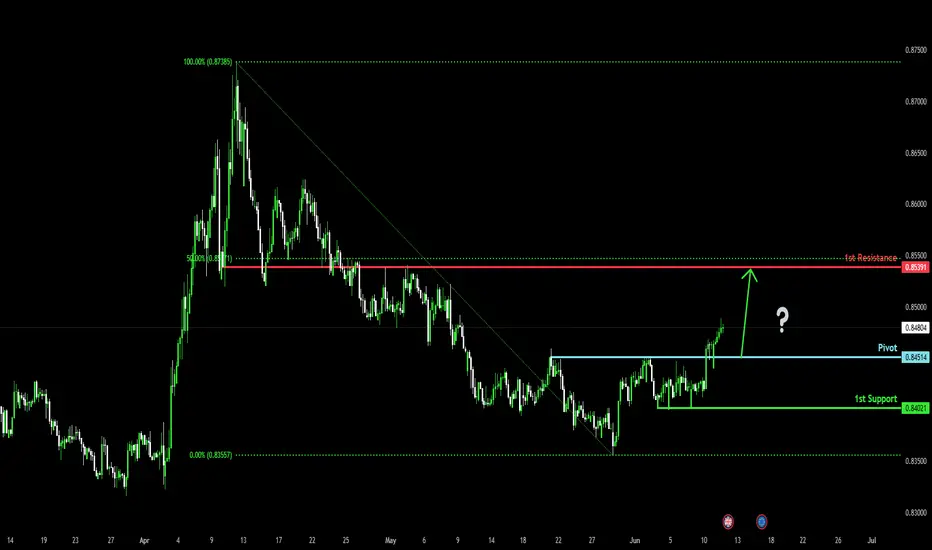
Bullish rise?EUR/GBP has reacted off the pivot and could rise to the 1st resistance.
Pivot: 0.8451
1st Support: 0.8402
1st Resistance: 0.8539
Risk Warning:
Trading Forex and CFDs carries a high level of risk to your capital and you should only trade with money you can afford to lose. Trading Forex and CFDs may not be suitable for all investors, so please ensure that you fully understand the risks involved and seek independent advice if necessary.
Disclaimer:
The above opinions given constitute general market commentary, and do not constitute the opinion or advice of IC Markets or any form of personal or investment advice.
Any opinions, news, research, analyses, prices, other information, or links to third-party sites contained on this website are provided on an "as-is" basis, are intended only to be informative, is not an advice nor a recommendation, nor research, or a record of our trading prices, or an offer of, or solicitation for a transaction in any financial instrument and thus should not be treated as such. The information provided does not involve any specific investment objectives, financial situation and needs of any specific person who may receive it. Please be aware, that past performance is not a reliable indicator of future performance and/or results. Past Performance or Forward-looking scenarios based upon the reasonable beliefs of the third-party provider are not a guarantee of future performance. Actual results may differ materially from those anticipated in forward-looking or past performance statements. IC Markets makes no representation or warranty and assumes no liability as to the accuracy or completeness of the information provided, nor any loss arising from any investment based on a recommendation, forecast or any information supplied by any third-party.
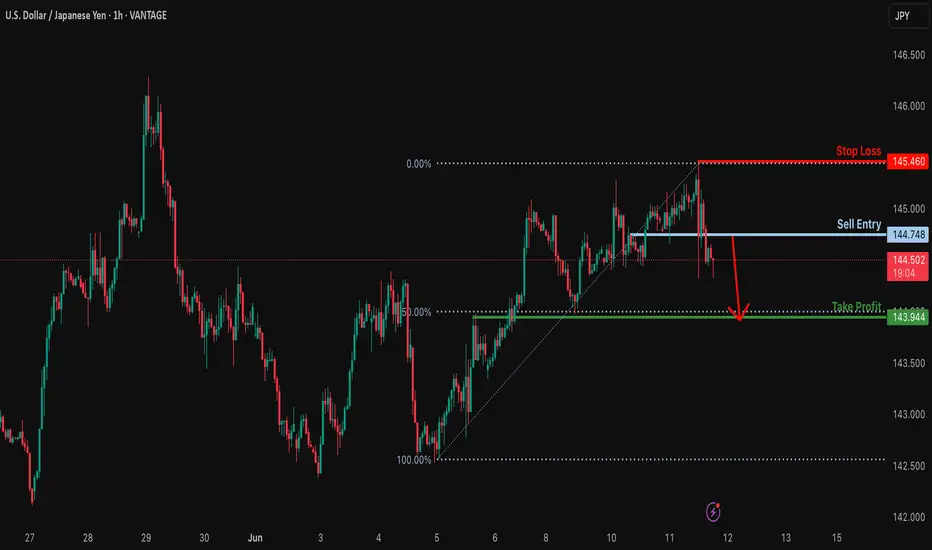
Potential bearish drop?USD/JPY has reacted off the resistance level which is a pullback resistance and could drop from this level to our take profit.
Entry: 144.74
Why we like it:
There is a pullback resistance level.
Stop loss: 145.46
Why we like it:
There is a pullback resistance level.
Take profit: 143.94
Why we like it:
There is an overlap support level that lines up with the 50% Fibonacci retracement.
Enjoying your TradingView experience? Review us!
Please be advised that the information presented on TradingView is provided to Vantage (‘Vantage Global Limited’, ‘we’) by a third-party provider (‘Everest Fortune Group’). Please be reminded that you are solely responsible for the trading decisions on your account. There is a very high degree of risk involved in trading. Any information and/or content is intended entirely for research, educational and informational purposes only and does not constitute investment or consultation advice or investment strategy. The information is not tailored to the investment needs of any specific person and therefore does not involve a consideration of any of the investment objectives, financial situation or needs of any viewer that may receive it. Kindly also note that past performance is not a reliable indicator of future results. Actual results may differ materially from those anticipated in forward-looking or past performance statements. We assume no liability as to the accuracy or completeness of any of the information and/or content provided herein and the Company cannot be held responsible for any omission, mistake nor for any loss or damage including without limitation to any loss of profit which may arise from reliance on any information supplied by Everest Fortune Group.