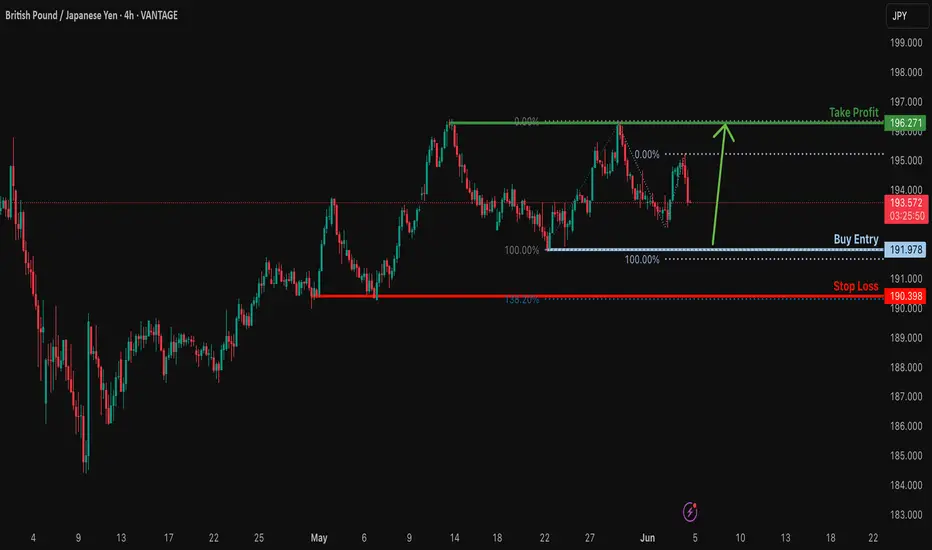
Bullish bounce?GBP/JPY is falling towards the support level which is a pullback support that is slightly above the 100% Fibonacci projection and could bounce from this level to our take profit.
Entry: 191.97
Why we like it:
There is a pullback support level that is slightly above the 100% Fibonacci projection.
Stop loss: 190.39
Why we like it:
There is a pullback support level that lines up with the 138.2% Fibonacci extension.
Take profit: 196.27
Why we like it:
There is a pullback resistance level.
Enjoying your TradingView experience? Review us!
Please be advised that the information presented on TradingView is provided to Vantage (‘Vantage Global Limited’, ‘we’) by a third-party provider (‘Everest Fortune Group’). Please be reminded that you are solely responsible for the trading decisions on your account. There is a very high degree of risk involved in trading. Any information and/or content is intended entirely for research, educational and informational purposes only and does not constitute investment or consultation advice or investment strategy. The information is not tailored to the investment needs of any specific person and therefore does not involve a consideration of any of the investment objectives, financial situation or needs of any viewer that may receive it. Kindly also note that past performance is not a reliable indicator of future results. Actual results may differ materially from those anticipated in forward-looking or past performance statements. We assume no liability as to the accuracy or completeness of any of the information and/or content provided herein and the Company cannot be held responsible for any omission, mistake nor for any loss or damage including without limitation to any loss of profit which may arise from reliance on any information supplied by Everest Fortune Group.
Forexsignals
Bullish bounce off 50% Fibonacci support?GBP/USD is falling towards the support level which is a pullback support that aligns with the 50% Fibonacci retracement and could bounce from this level to our take profit.
Entry: 1.3536
Why we like it:
There is a pullback support level that lines up with the 50% Fibonacci retracement.
Stop loss: 1.3510
Why we like it:
There is a pullback support level that is slightly below the 78.6% Fibonacci retracement.
Take profit: 1.3590
Why we like it:
There is a pullback resistance level that aligns with the 138.2% Fibonacci extension.
Enjoying your TradingView experience? Review us!
Please be advised that the information presented on TradingView is provided to Vantage (‘Vantage Global Limited’, ‘we’) by a third-party provider (‘Everest Fortune Group’). Please be reminded that you are solely responsible for the trading decisions on your account. There is a very high degree of risk involved in trading. Any information and/or content is intended entirely for research, educational and informational purposes only and does not constitute investment or consultation advice or investment strategy. The information is not tailored to the investment needs of any specific person and therefore does not involve a consideration of any of the investment objectives, financial situation or needs of any viewer that may receive it. Kindly also note that past performance is not a reliable indicator of future results. Actual results may differ materially from those anticipated in forward-looking or past performance statements. We assume no liability as to the accuracy or completeness of any of the information and/or content provided herein and the Company cannot be held responsible for any omission, mistake nor for any loss or damage including without limitation to any loss of profit which may arise from reliance on any information supplied by Everest Fortune Group.

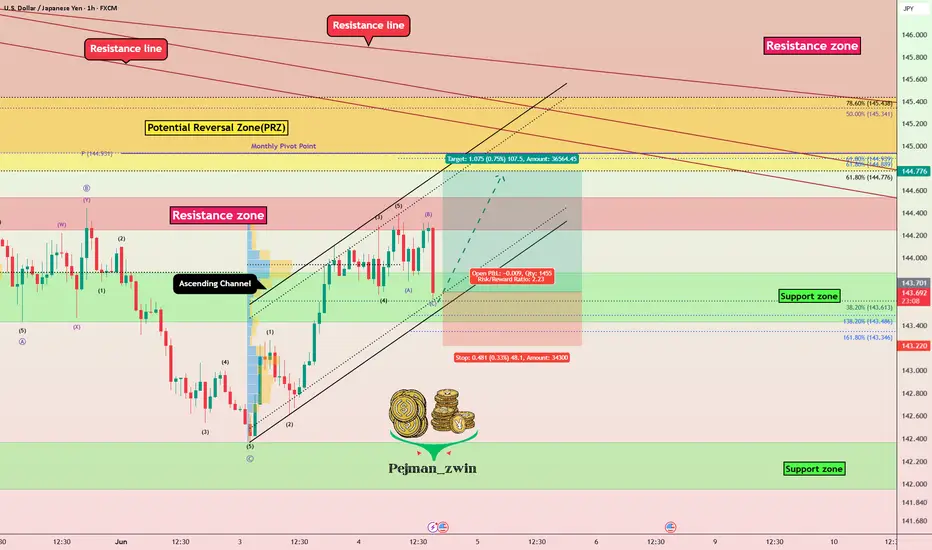
USDJPY Tests Channel Support After ADP Shock — Rebound Ahead?In the last hour's candle after the ADP Non-Farm Employment Change Index was released, USDJPY ( FX:USDJPY ) started to fall, but considering the position of this pair, I think we can have a good Risk-To-Reward even if the Stop Loss (SL) is touched.
USDJPY is trading near the lower line of the ascending channel and the Support zone(143.870 JPY-143.430 JPY) .
From an Elliott Wave perspective , USDJPY appears to be completing a corrective pattern .
I expect USDJPY to rise at least to the Potential Reversal Zone(PRZ) .
Note: Stop Loss = 143.220 JPY
Please respect each other's ideas and express them politely if you agree or disagree.
U.S. Dollar/Japanese Yen Analyze (USDJPY), 1-hour time frame.
Be sure to follow the updated ideas.
Do not forget to put a Stop loss for your positions (For every position you want to open).
Please follow your strategy and updates; this is just my Idea, and I will gladly see your ideas in this post.
Please do not forget the ✅' like '✅ button 🙏😊 & Share it with your friends; thanks, and Trade safe.
EURCHF: The Most Predictable Soap Opera in ForexUnder 0.94 with low volume? You board that bus. Every. Single. Time.
CAPITALCOM:EURCHF
Since 2022, EURCHF has been playing the same tired but reliable rhythm.
Drop below 0.94, keep volume low, and boom, the bounce.
Not once. Not twice.
We've seen it repeat 48 times in 24 months!!!! Check the chart!
Let them discuss inflation, war, central banks, and macro theory all day.
Meanwhile, this pair is just running a predictable underground shuttle:
Tickets are issued quietly, below 0.94.
Entry is boring.
Exit? Clean profit....
Now, let’s talk politics. Because EURCHF is more than a chart
It’s a financial proxy war in slow motion.
On one side! The Eurozone, a union that behaves like a dysfunctional family reunion. Everyone talks. No one agrees.
The ECB? Too slow, too soft, too diplomatic. France wants spending. Germany wants austerity. Italy just wants to be invited.
On the other side: Switzerland.
A country that acts like the rich uncle who never comes to dinner but still gets the final say.
They don’t speak loudly, they just stack gold, flex the franc, and smile silently.
Neutral in politics, but never neutral in profit.
So every time the Euro wobbles, whether war in Ukraine, elections in France, or the ECB mumbling about rate cuts, the Swiss franc tightens its tie and appreciates quietly.
But here’s the punchline:
Eventually, the Euro shrugs it off.
It always does.
Maybe because the EU is too big to fail, or Switzerland can only push so far before exporters start screaming.
So what happens? EURCHF bounces. Every time.
Low volume under 0.94? That’s the market whispering to insiders.
We don’t need to guess.
We don’t need breaking news.
We just follow the same damn wave.
No reason to change strategy.
No reason to listen to noise.
It’s not about being smart, it’s about being consistent.
This isn’t trading. It’s public transportation.
And until that bus breaks down, we ride it.

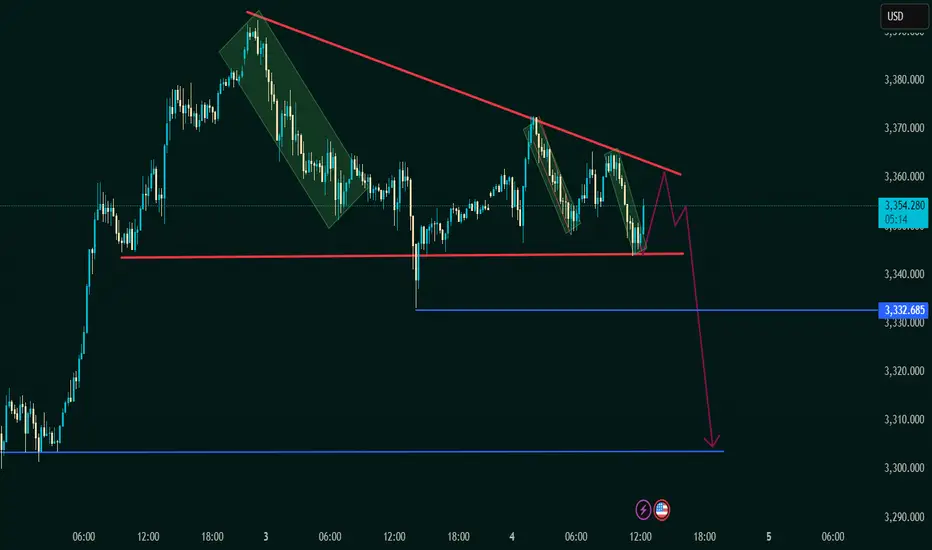
XAU/USD (Gold vs USD)📏 Trendlines:
Red descending trendline = consistent lower highs → selling pressure increases.
Horizontal red support line (~3349) = price tested multiple times, but no strong bounce.
📦 Chart Patterns:
Multiple bear flag formations marked in green = typical continuation patterns in downtrends.
Suggests repeated attempts to rally are being sold into.
🟣 Support & Resistance:
Immediate resistance: Downtrend line (~3355–3360).
Key support level: 3349 (horizontal red line).
Breakdown target: 3332.685 (blue horizontal line) and further to ~3310 zone.
🧭 Price Projection:
🚨 Expect a potential pullback to the trendline (~3355), which may reject again.
📉 If 3349 support breaks, a strong drop to 3332 is likely.
Final bearish target: ~3310 level, aligning with the magenta arrow.
📌 Conclusion:
⚠️ Bias: Bearish under 3355.
🧨 Watch for breakdown confirmation below 3349 to trigger short positions.
🕵️♂️ Be cautious of false breakouts; wait for candle close confirmation.
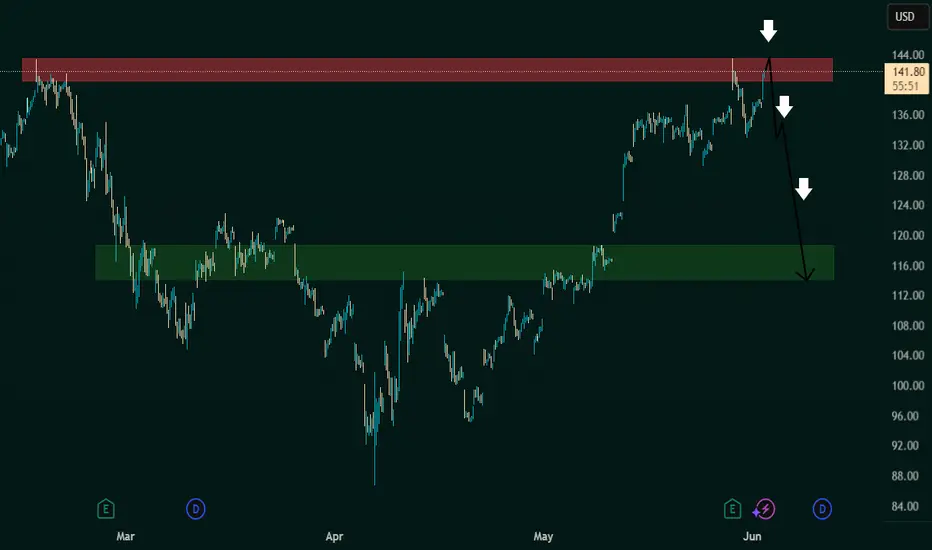
Potential Reversal Zone for NVDAThis chart of NVIDIA Corporation (NVDA) as of June 3, 2025, shows a technical analysis scenario forecasting a possible bearish reversal. The price action, zones, and arrows suggest a setup based on supply and demand zones.
Key Elements in the Chart:
🔴 Supply Zone (Resistance Area)
Location: Around $141.73 to ~$144
Observation: The price recently entered this red-shaded area, indicating strong historical resistance.
Implication: The area is expected to act as a ceiling, where sellers may overwhelm buyers, causing a reversal.
⚫ Price Reaction:
The chart shows price approaching and briefly piercing the supply zone, followed by a bearish candle or rejection (as indicated by the top arrow).
Arrows project a downward movement, suggesting bearish sentiment.
🟢 Demand Zone (Support Area)
Location: Approximately $114–$121
Observation: This green-shaded area acted as a base for a previous upward move.
Implication: It is likely to act as a strong support if the price drops significantly.
Projected Price Path:
Short-term reversal from the resistance zone (~$144).
Initial drop to mid $130s (likely a lower high or minor support).
Continuation to demand zone around $116, completing the projected bearish move.
Technical Interpretation:
This setup is a classic supply and demand reversal strategy.
Confirmation of the short setup may require:
A clear rejection candle at resistance.
Break of minor support levels on the way down.
Risk for bulls is high near resistance; short sellers may find opportunities targeting the demand zone.
EURUSD 15 MIN Long📊 EUR/USD Smart Money Concept Trade Idea – 15-Minute Chart
This setup highlights a textbook example of how market structure, liquidity grabs, and Fibonacci confluence can provide high-probability trade setups.
🔍 Breakdown:
Support Respected (Left Side)
Price previously respected a key support zone, leading to a strong bullish impulse.
Previous Support → Resistance Flip
Once price revisited this zone (marked in red), it failed to hold, indicating a shift in sentiment. This became a liquidity zone where early buyers got trapped.
Liquidity Grab (Red Line)
Notice how price dipped below the previous swing low, triggering stop-losses from buyers. This is a liquidity grab, a classic smart money move to fuel large buy orders.
Structure Shift (Green Label)
After the liquidity grab, price formed a higher high, indicating a potential shift in market structure from bearish to bullish.
50% Fibonacci Level (Green Line)
The price then retraced perfectly to the 50% Fibonacci level of the bullish leg post-liquidity grab – a golden zone often used by institutions for entries.
Re-Entry After Pullback
The retracement to the 50 FIB level after the structure shift provided a low-risk, high-reward long opportunity, targeting the previous liquidity zone (blue line) as take-profit.
Target & Stop Placement
Entry: Around the 50 FIB level
Stop: Below the liquidity grab low
Take Profit: Near the previous liquidity zone (marked in blue), where many sell-side stops likely sit

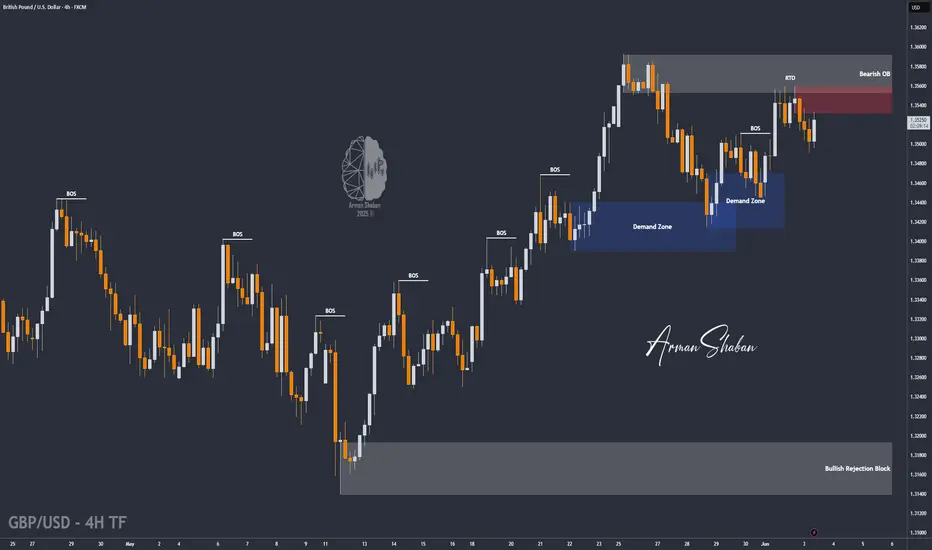
GBP/USD : Ready for Fall (READ THE CAPTION)By examining the GBP/USD chart on the 4-hour timeframe, we can see that the price is currently trading within the 1.35 supply zone. If a strong rejection occurs from this level, we can expect further downside movement. The potential bearish targets are 1.34915 and 1.34500. Other key supply zones are located at 1.35520, 1.35730, and 1.35930.
Please support me with your likes and comments to motivate me to share more analysis with you and share your opinion about the possible trend of this chart with me !
Best Regards , Arman Shaban
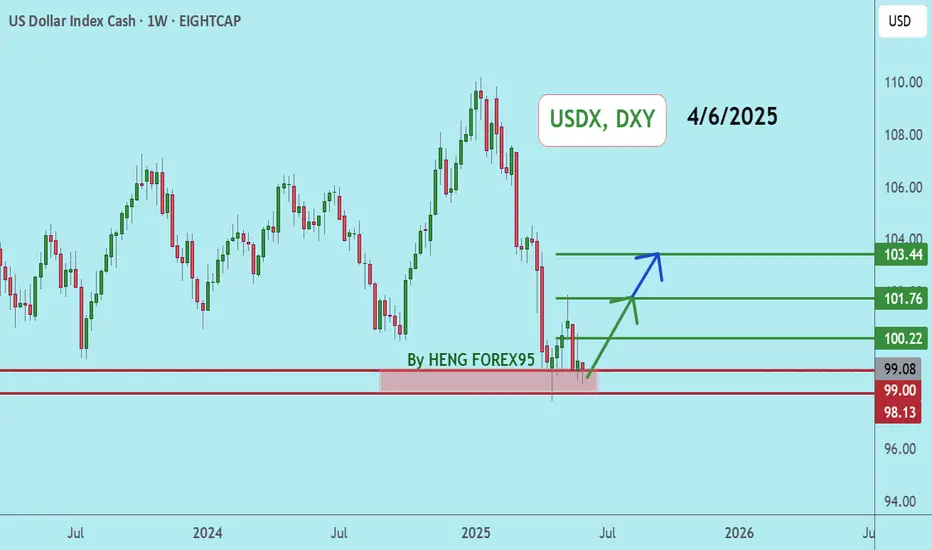
DXYDXY price is near the support zone 98.74-97.87. If the price cannot break through the 97.87 level, it is expected that the price will rebound. Consider buying the red zone.
🔥Trading futures, forex, CFDs and stocks carries a risk of loss.
Please consider carefully whether such trading is suitable for you.
>>GooD Luck 😊
❤️ Like and subscribe to never miss a new idea!
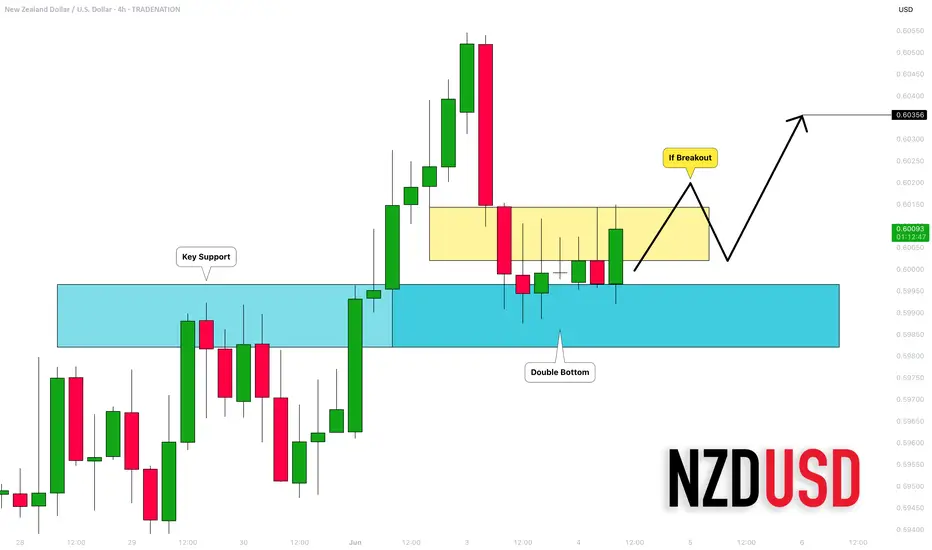
NZDUSD: Your Trading Plan For Today Explained 🇳🇿🇺🇸
NZDUSD is currently consolidating on a strong intraday/daily support.
To buy the pair with a confirmation, I suggest to focus on a double
bottom pattern on a 4H time frame.
Its neckline breakout and a 4H candle close above 0.6015
will provide a reliable bullish confirmation.
Goal will be 0.6035.
Alternatively, if the price sets a new lower low on a 4H,
this setup will become invalid.
❤️Please, support my work with like, thank you!❤️
I am part of Trade Nation's Influencer program and receive a monthly fee for using their TradingView charts in my analysis.
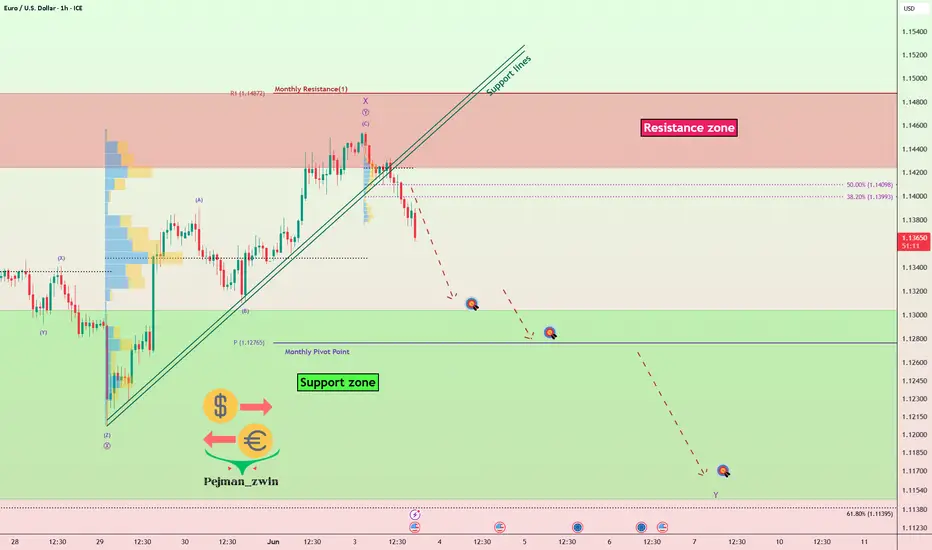
Stronger U.S. JOLTS Data Pressures EURUSD!!!EURUSD ( FX:EURUSD ) failed to break the Resistance zone($1.1487-$1.1424) and started to fall again , breaking the Support lines .
In terms of Elliott Wave theory , it seems that EURUSD has managed to complete the main wave X of the Double Three Correction(WXY) structure .
Just moments ago, the U.S. JOLTS Job Openings data was released.
-------------------------------
Actual: 7.39M
Forecast: 7.11M
Previous: 7.19M
The stronger-than-expected JOLTS figure at 7.39 million signals a resilient labor market. This reduces recession fears and increases the likelihood that the Federal Reserve may keep interest rates elevated for longer.
Bullish for the U.S. Dollar( TVC:DXY )
Bearish pressure could hit EURUSD, especially if it's approaching the key resistance zone.
-------------------------------
I expect EURUSD to start to fall again after the pullback to the Support lines and to fall to the targets I have specified on the chart.
Note: If EURUSD touches $1.14580(Stop Loss(SL)), we can expect a failure of the Resistance zone($1.1487-$1.1424).
Please respect each other's ideas and express them politely if you agree or disagree.
Euro/U.S. Dollar Analyze (EURUSD), 1-hour time frame.
Be sure to follow the updated ideas.
Do not forget to put a Stop loss for your positions (For every position you want to open).
Please follow your strategy and updates; this is just my Idea, and I will gladly see your ideas in this post.
Please do not forget the ✅' like '✅ button 🙏😊 & Share it with your friends; thanks, and Trade safe.
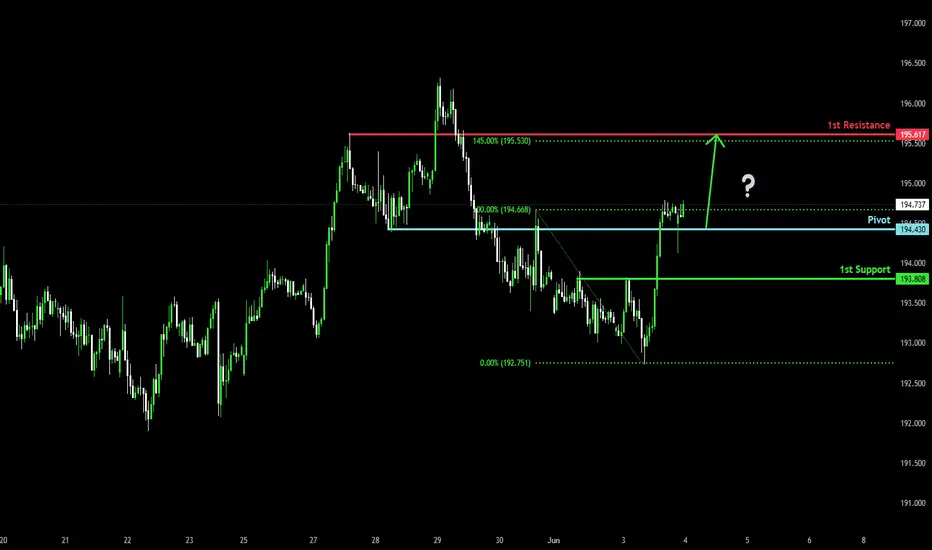
Potential bullish rise?GBP/JPY has reacted off the pivot and could rise to the 145% Fibonacci resistance.
Pivot: 194.43
1st Support: 193.80
1st Resistance: 195.61
Risk Warning:
Trading Forex and CFDs carries a high level of risk to your capital and you should only trade with money you can afford to lose. Trading Forex and CFDs may not be suitable for all investors, so please ensure that you fully understand the risks involved and seek independent advice if necessary.
Disclaimer:
The above opinions given constitute general market commentary, and do not constitute the opinion or advice of IC Markets or any form of personal or investment advice.
Any opinions, news, research, analyses, prices, other information, or links to third-party sites contained on this website are provided on an "as-is" basis, are intended only to be informative, is not an advice nor a recommendation, nor research, or a record of our trading prices, or an offer of, or solicitation for a transaction in any financial instrument and thus should not be treated as such. The information provided does not involve any specific investment objectives, financial situation and needs of any specific person who may receive it. Please be aware, that past performance is not a reliable indicator of future performance and/or results. Past Performance or Forward-looking scenarios based upon the reasonable beliefs of the third-party provider are not a guarantee of future performance. Actual results may differ materially from those anticipated in forward-looking or past performance statements. IC Markets makes no representation or warranty and assumes no liability as to the accuracy or completeness of the information provided, nor any loss arising from any investment based on a recommendation, forecast or any information supplied by any third-party.
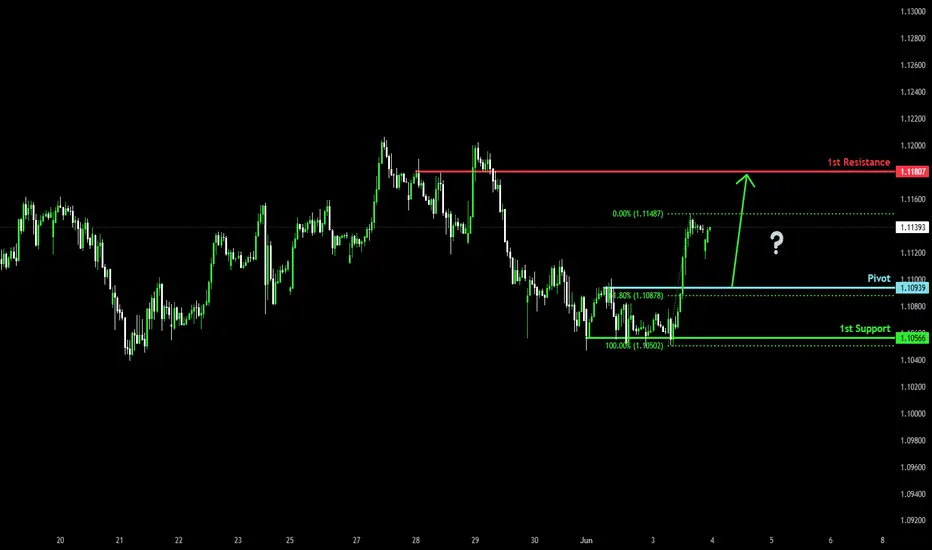
Bullish bounce off 61.8% Fibonacci support?GBP/CHF is falling towards the pivot, which is a pullback support and could bounce to the 1st resistance, which acts as a pullback resistance.
Pivot: 1.1093
1st Support: 1.1056
1st Resistance: 1.1180
Risk Warning:
Trading Forex and CFDs carries a high level of risk to your capital and you should only trade with money you can afford to lose. Trading Forex and CFDs may not be suitable for all investors, so please ensure that you fully understand the risks involved and seek independent advice if necessary.
Disclaimer:
The above opinions given constitute general market commentary, and do not constitute the opinion or advice of IC Markets or any form of personal or investment advice.
Any opinions, news, research, analyses, prices, other information, or links to third-party sites contained on this website are provided on an "as-is" basis, are intended only to be informative, is not an advice nor a recommendation, nor research, or a record of our trading prices, or an offer of, or solicitation for a transaction in any financial instrument and thus should not be treated as such. The information provided does not involve any specific investment objectives, financial situation and needs of any specific person who may receive it. Please be aware, that past performance is not a reliable indicator of future performance and/or results. Past Performance or Forward-looking scenarios based upon the reasonable beliefs of the third-party provider are not a guarantee of future performance. Actual results may differ materially from those anticipated in forward-looking or past performance statements. IC Markets makes no representation or warranty and assumes no liability as to the accuracy or completeness of the information provided, nor any loss arising from any investment based on a recommendation, forecast or any information supplied by any third-party.
Bearish drop?EUR/AUD has reacted off the pivot, which is a pullback resistance and could drop to he 1st support that lines up with the 61.8% Fibonacci retracement.
Pivot: 1.77100
1st Support: 1.73968
1st Resistance: 1.78859
Risk Warning:
Trading Forex and CFDs carries a high level of risk to your capital and you should only trade with money you can afford to lose. Trading Forex and CFDs may not be suitable for all investors, so please ensure that you fully understand the risks involved and seek independent advice if necessary.
Disclaimer:
The above opinions given constitute general market commentary, and do not constitute the opinion or advice of IC Markets or any form of personal or investment advice.
Any opinions, news, research, analyses, prices, other information, or links to third-party sites contained on this website are provided on an "as-is" basis, are intended only to be informative, is not an advice nor a recommendation, nor research, or a record of our trading prices, or an offer of, or solicitation for a transaction in any financial instrument and thus should not be treated as such. The information provided does not involve any specific investment objectives, financial situation and needs of any specific person who may receive it. Please be aware, that past performance is not a reliable indicator of future performance and/or results. Past Performance or Forward-looking scenarios based upon the reasonable beliefs of the third-party provider are not a guarantee of future performance. Actual results may differ materially from those anticipated in forward-looking or past performance statements. IC Markets makes no representation or warranty and assumes no liability as to the accuracy or completeness of the information provided, nor any loss arising from any investment based on a recommendation, forecast or any information supplied by any third-party.

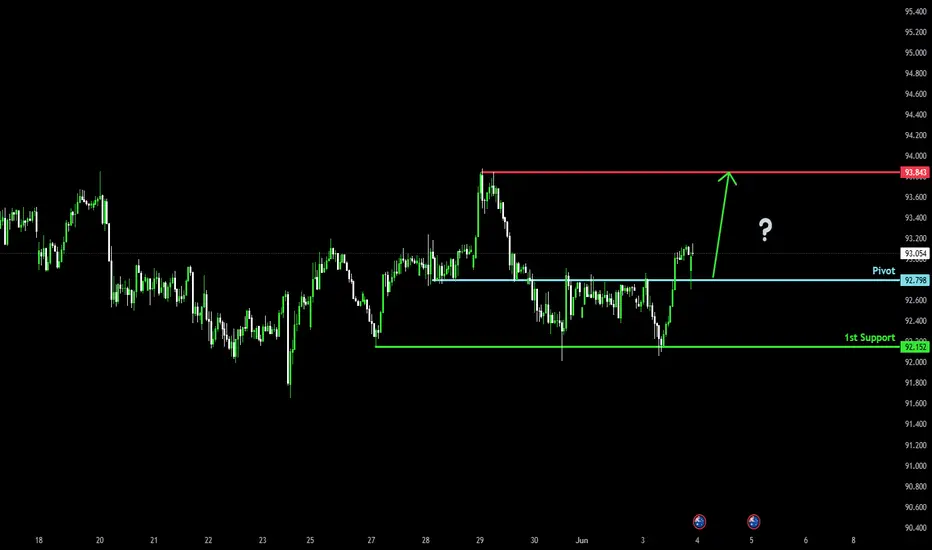
Bullish bounce?AUD/JPY has bounced off the pivot and could rise to the 1st resistance.
Pivot: 92.79
1st Support: 92.15
1st Resistance: 93.84
Risk Warning:
Trading Forex and CFDs carries a high level of risk to your capital and you should only trade with money you can afford to lose. Trading Forex and CFDs may not be suitable for all investors, so please ensure that you fully understand the risks involved and seek independent advice if necessary.
Disclaimer:
The above opinions given constitute general market commentary, and do not constitute the opinion or advice of IC Markets or any form of personal or investment advice.
Any opinions, news, research, analyses, prices, other information, or links to third-party sites contained on this website are provided on an "as-is" basis, are intended only to be informative, is not an advice nor a recommendation, nor research, or a record of our trading prices, or an offer of, or solicitation for a transaction in any financial instrument and thus should not be treated as such. The information provided does not involve any specific investment objectives, financial situation and needs of any specific person who may receive it. Please be aware, that past performance is not a reliable indicator of future performance and/or results. Past Performance or Forward-looking scenarios based upon the reasonable beliefs of the third-party provider are not a guarantee of future performance. Actual results may differ materially from those anticipated in forward-looking or past performance statements. IC Markets makes no representation or warranty and assumes no liability as to the accuracy or completeness of the information provided, nor any loss arising from any investment based on a recommendation, forecast or any information supplied by any third-party.
Bearish drop?AUD/CAD has rejected off the pivot and could drop to the 1st support.
Pivot: 0.89082
1st Support: 0.87895
1st Resistance: 0.89646
Risk Warning:
Trading Forex and CFDs carries a high level of risk to your capital and you should only trade with money you can afford to lose. Trading Forex and CFDs may not be suitable for all investors, so please ensure that you fully understand the risks involved and seek independent advice if necessary.
Disclaimer:
The above opinions given constitute general market commentary, and do not constitute the opinion or advice of IC Markets or any form of personal or investment advice.
Any opinions, news, research, analyses, prices, other information, or links to third-party sites contained on this website are provided on an "as-is" basis, are intended only to be informative, is not an advice nor a recommendation, nor research, or a record of our trading prices, or an offer of, or solicitation for a transaction in any financial instrument and thus should not be treated as such. The information provided does not involve any specific investment objectives, financial situation and needs of any specific person who may receive it. Please be aware, that past performance is not a reliable indicator of future performance and/or results. Past Performance or Forward-looking scenarios based upon the reasonable beliefs of the third-party provider are not a guarantee of future performance. Actual results may differ materially from those anticipated in forward-looking or past performance statements. IC Markets makes no representation or warranty and assumes no liability as to the accuracy or completeness of the information provided, nor any loss arising from any investment based on a recommendation, forecast or any information supplied by any third-party.
